. 2021 May 3;32(5):1131-1149.
doi: 10.1681/ASN.2020081112. Epub 2021 Mar 17.

Renal Inflammation Induces Salt Sensitivity in Male db/db Mice through Dysregulation of ENaC

Affiliations

Renal Inflammation Induces Salt Sensitivity in Male db/db Mice through Dysregulation of ENaC

Luciana C Veiras et al. J Am Soc Nephrol. .

Abstract

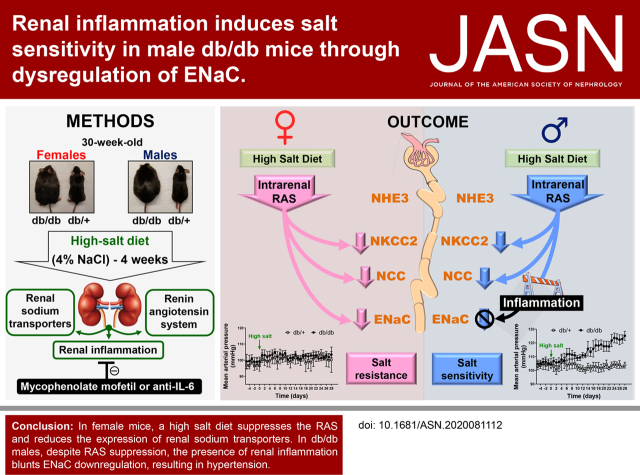
Background: Hypertension is considered a major risk factor for the progression of diabetic kidney disease. Type 2 diabetes is associated with increased renal sodium reabsorption and salt-sensitive hypertension. Clinical studies show that men have higher risk than premenopausal women for the development of diabetic kidney disease. However, the renal mechanisms that predispose to salt sensitivity during diabetes and whether sexual dimorphism is associated with these mechanisms remains unknown.

Methods: Female and male db/db mice exposed to a high-salt diet were used to analyze the progression of diabetic kidney disease and the development of hypertension.

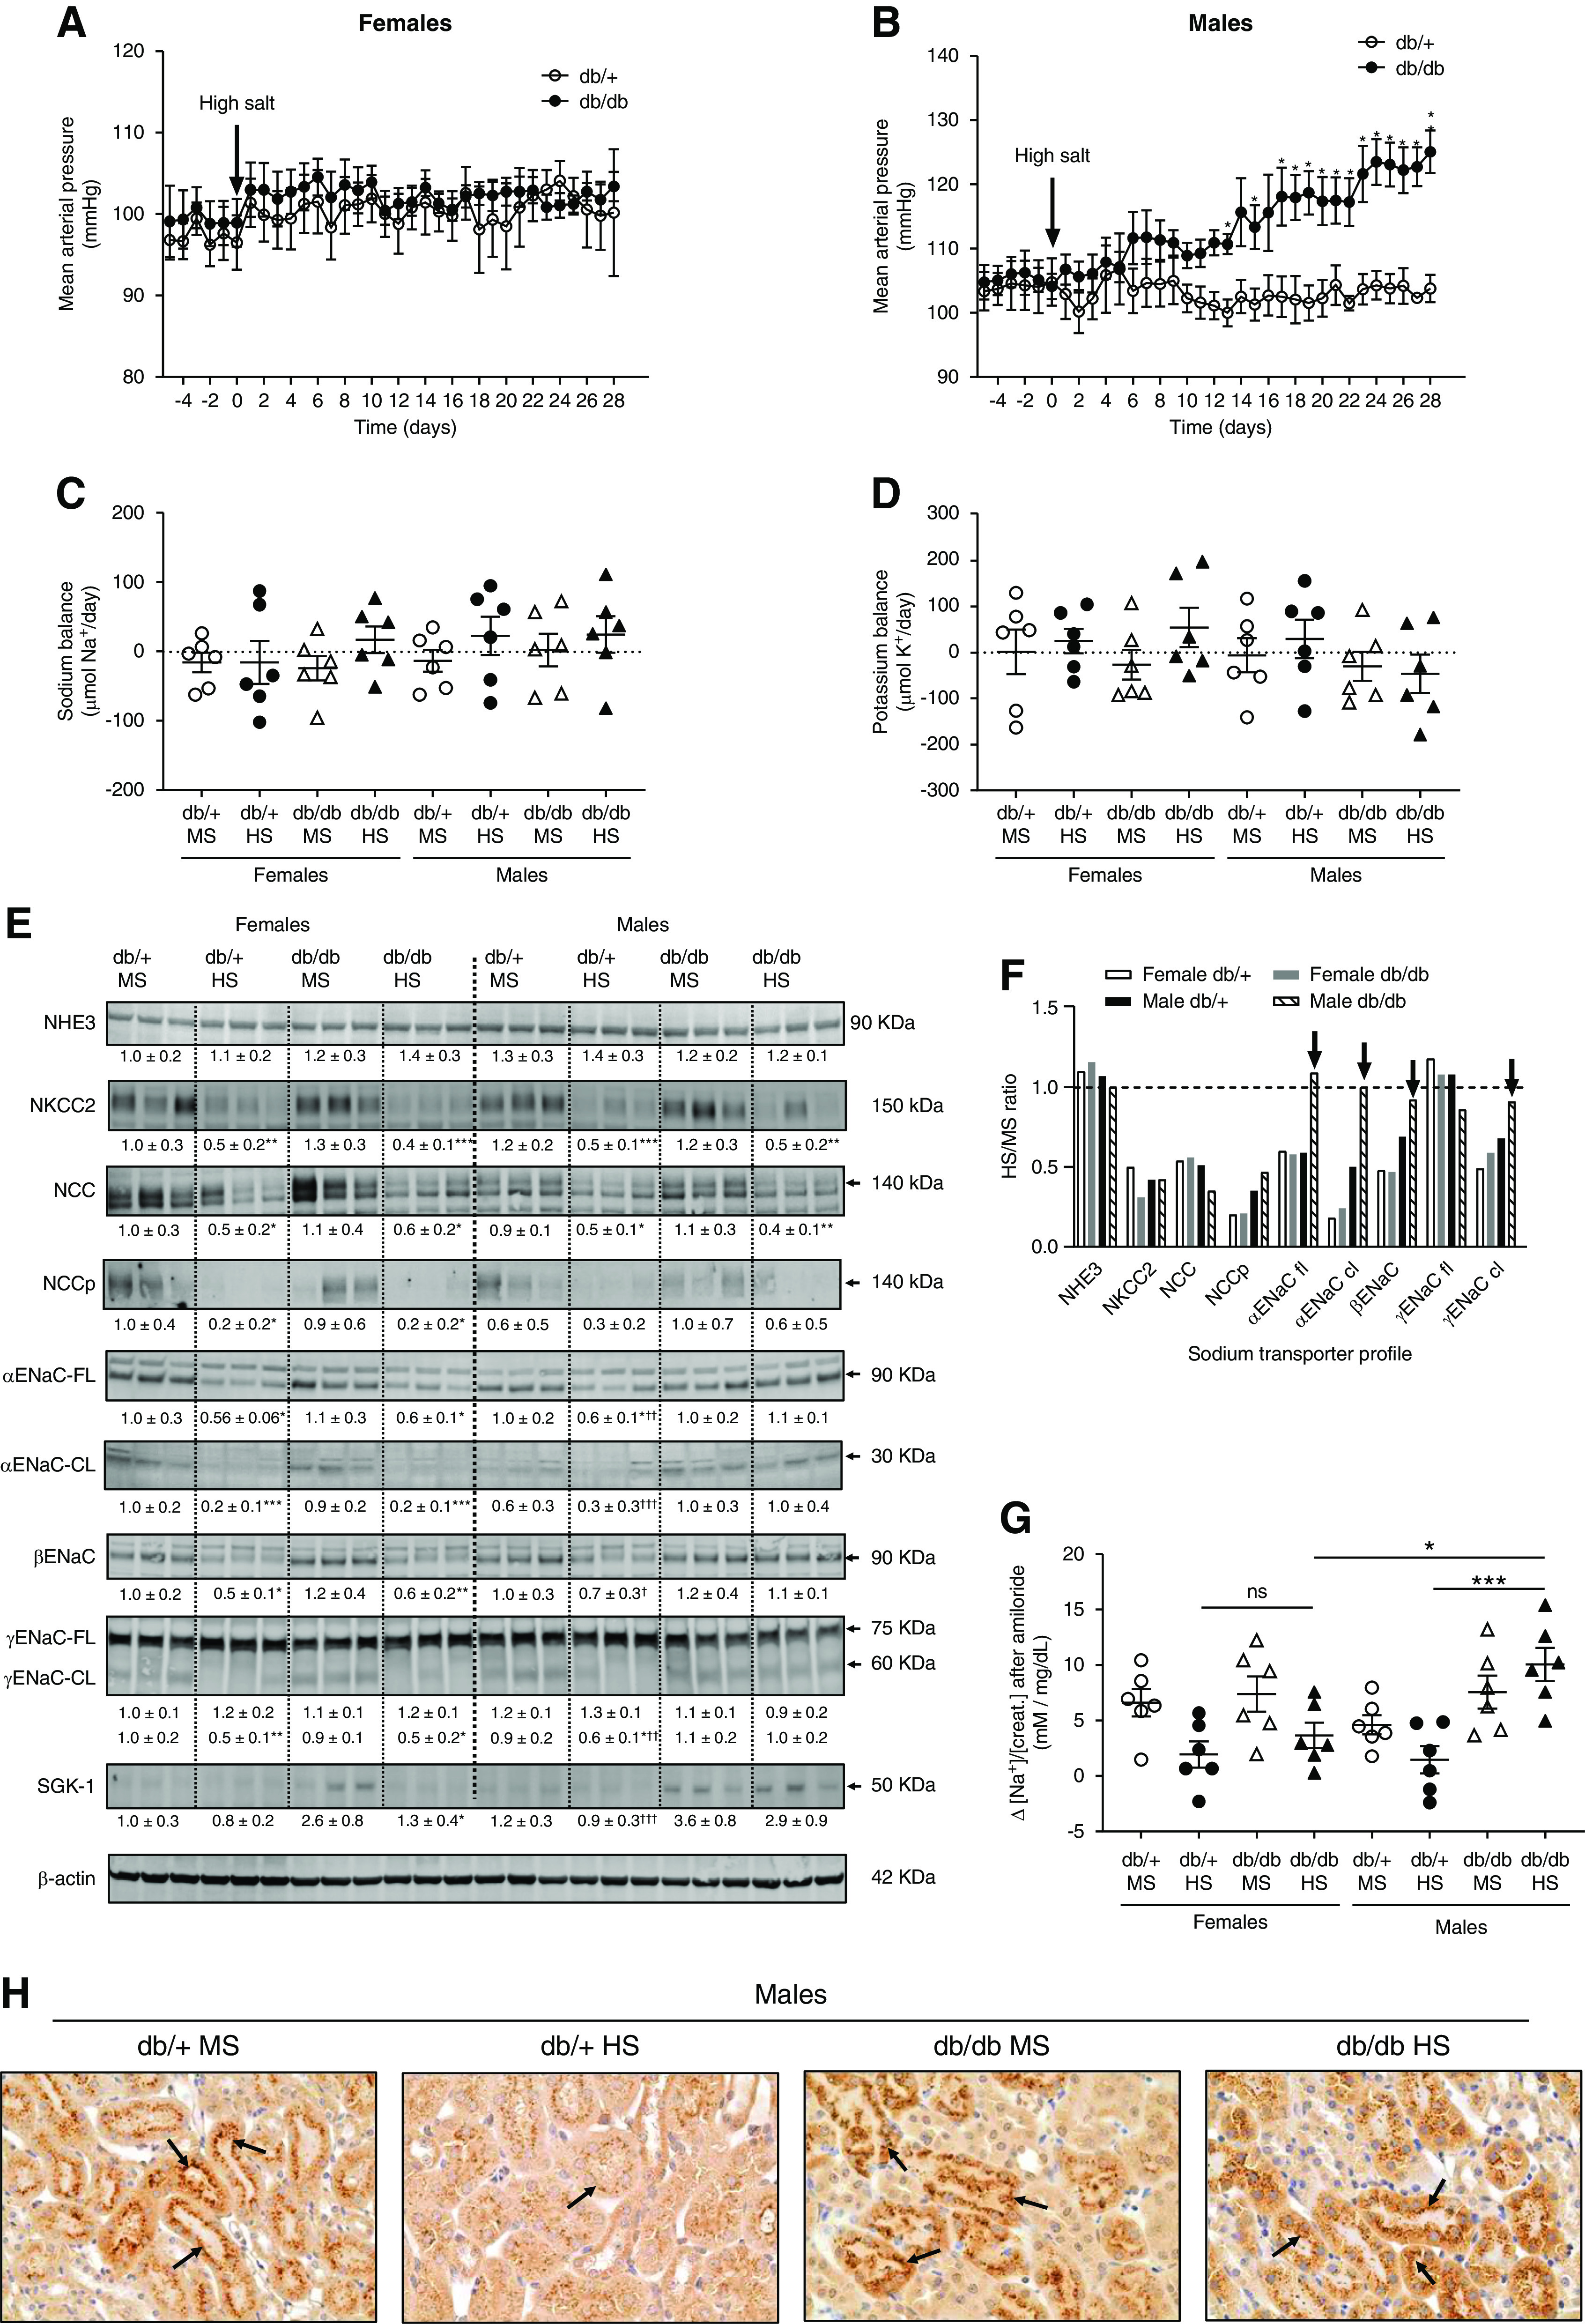
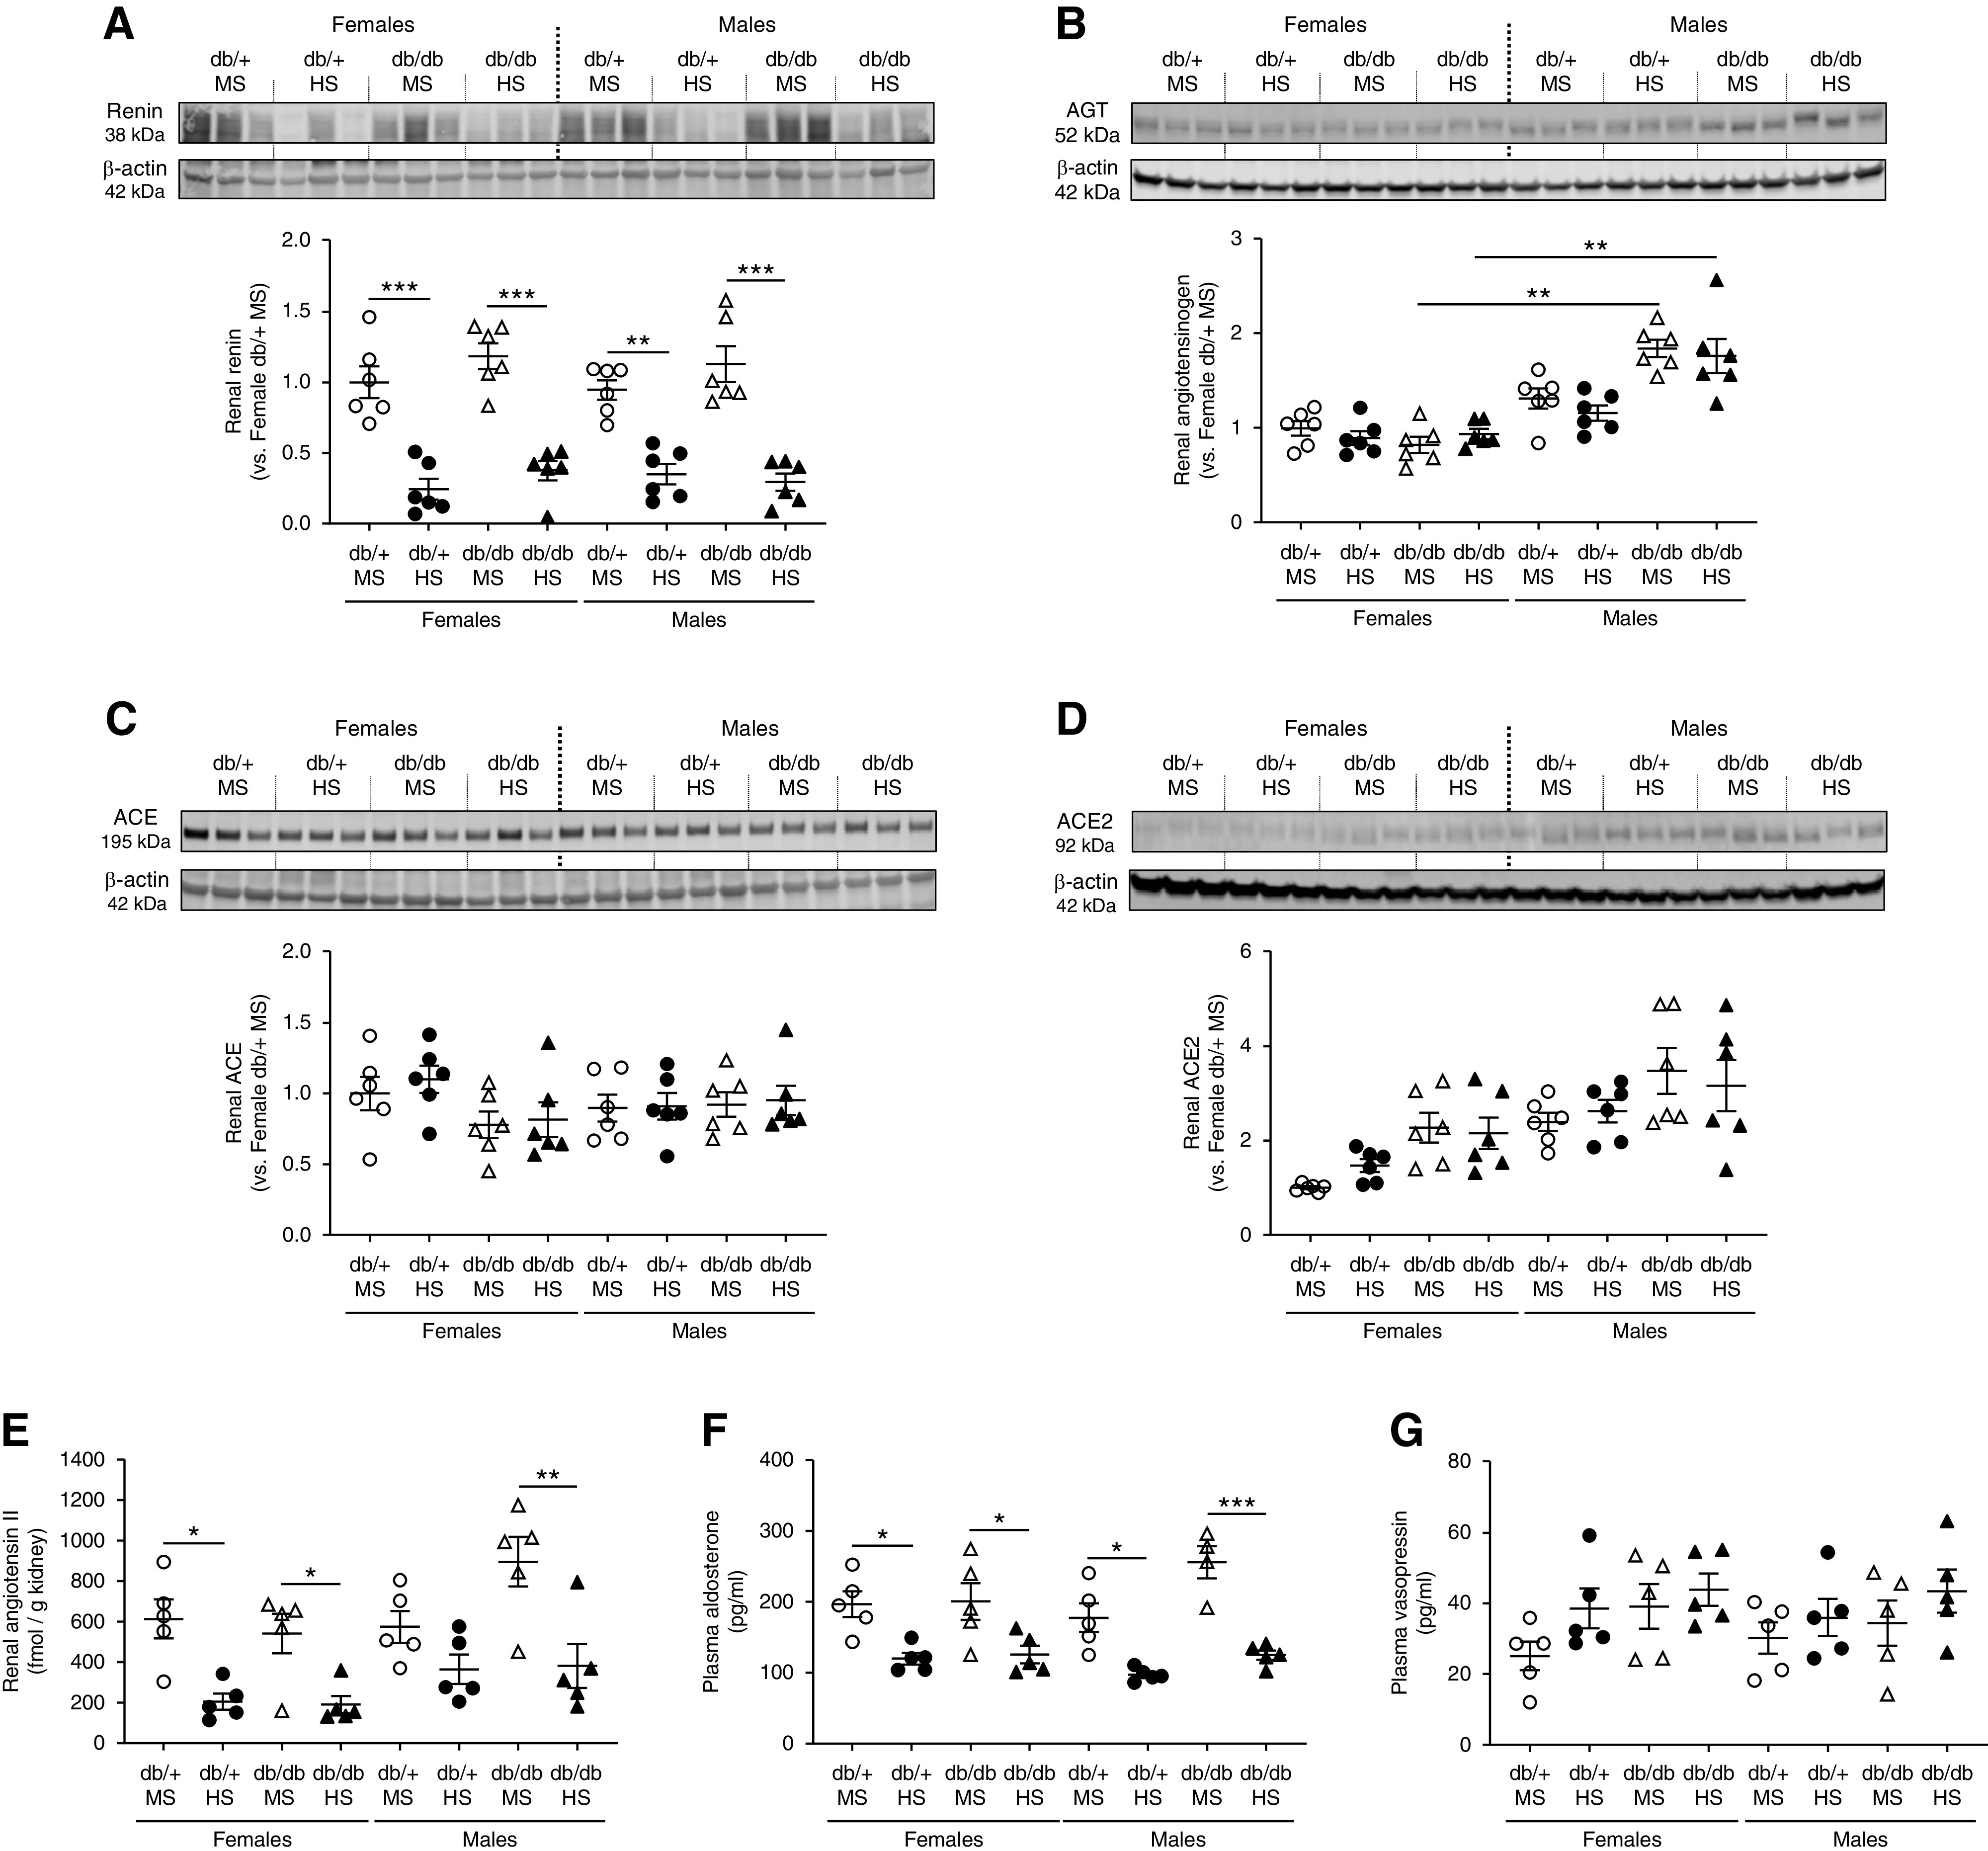
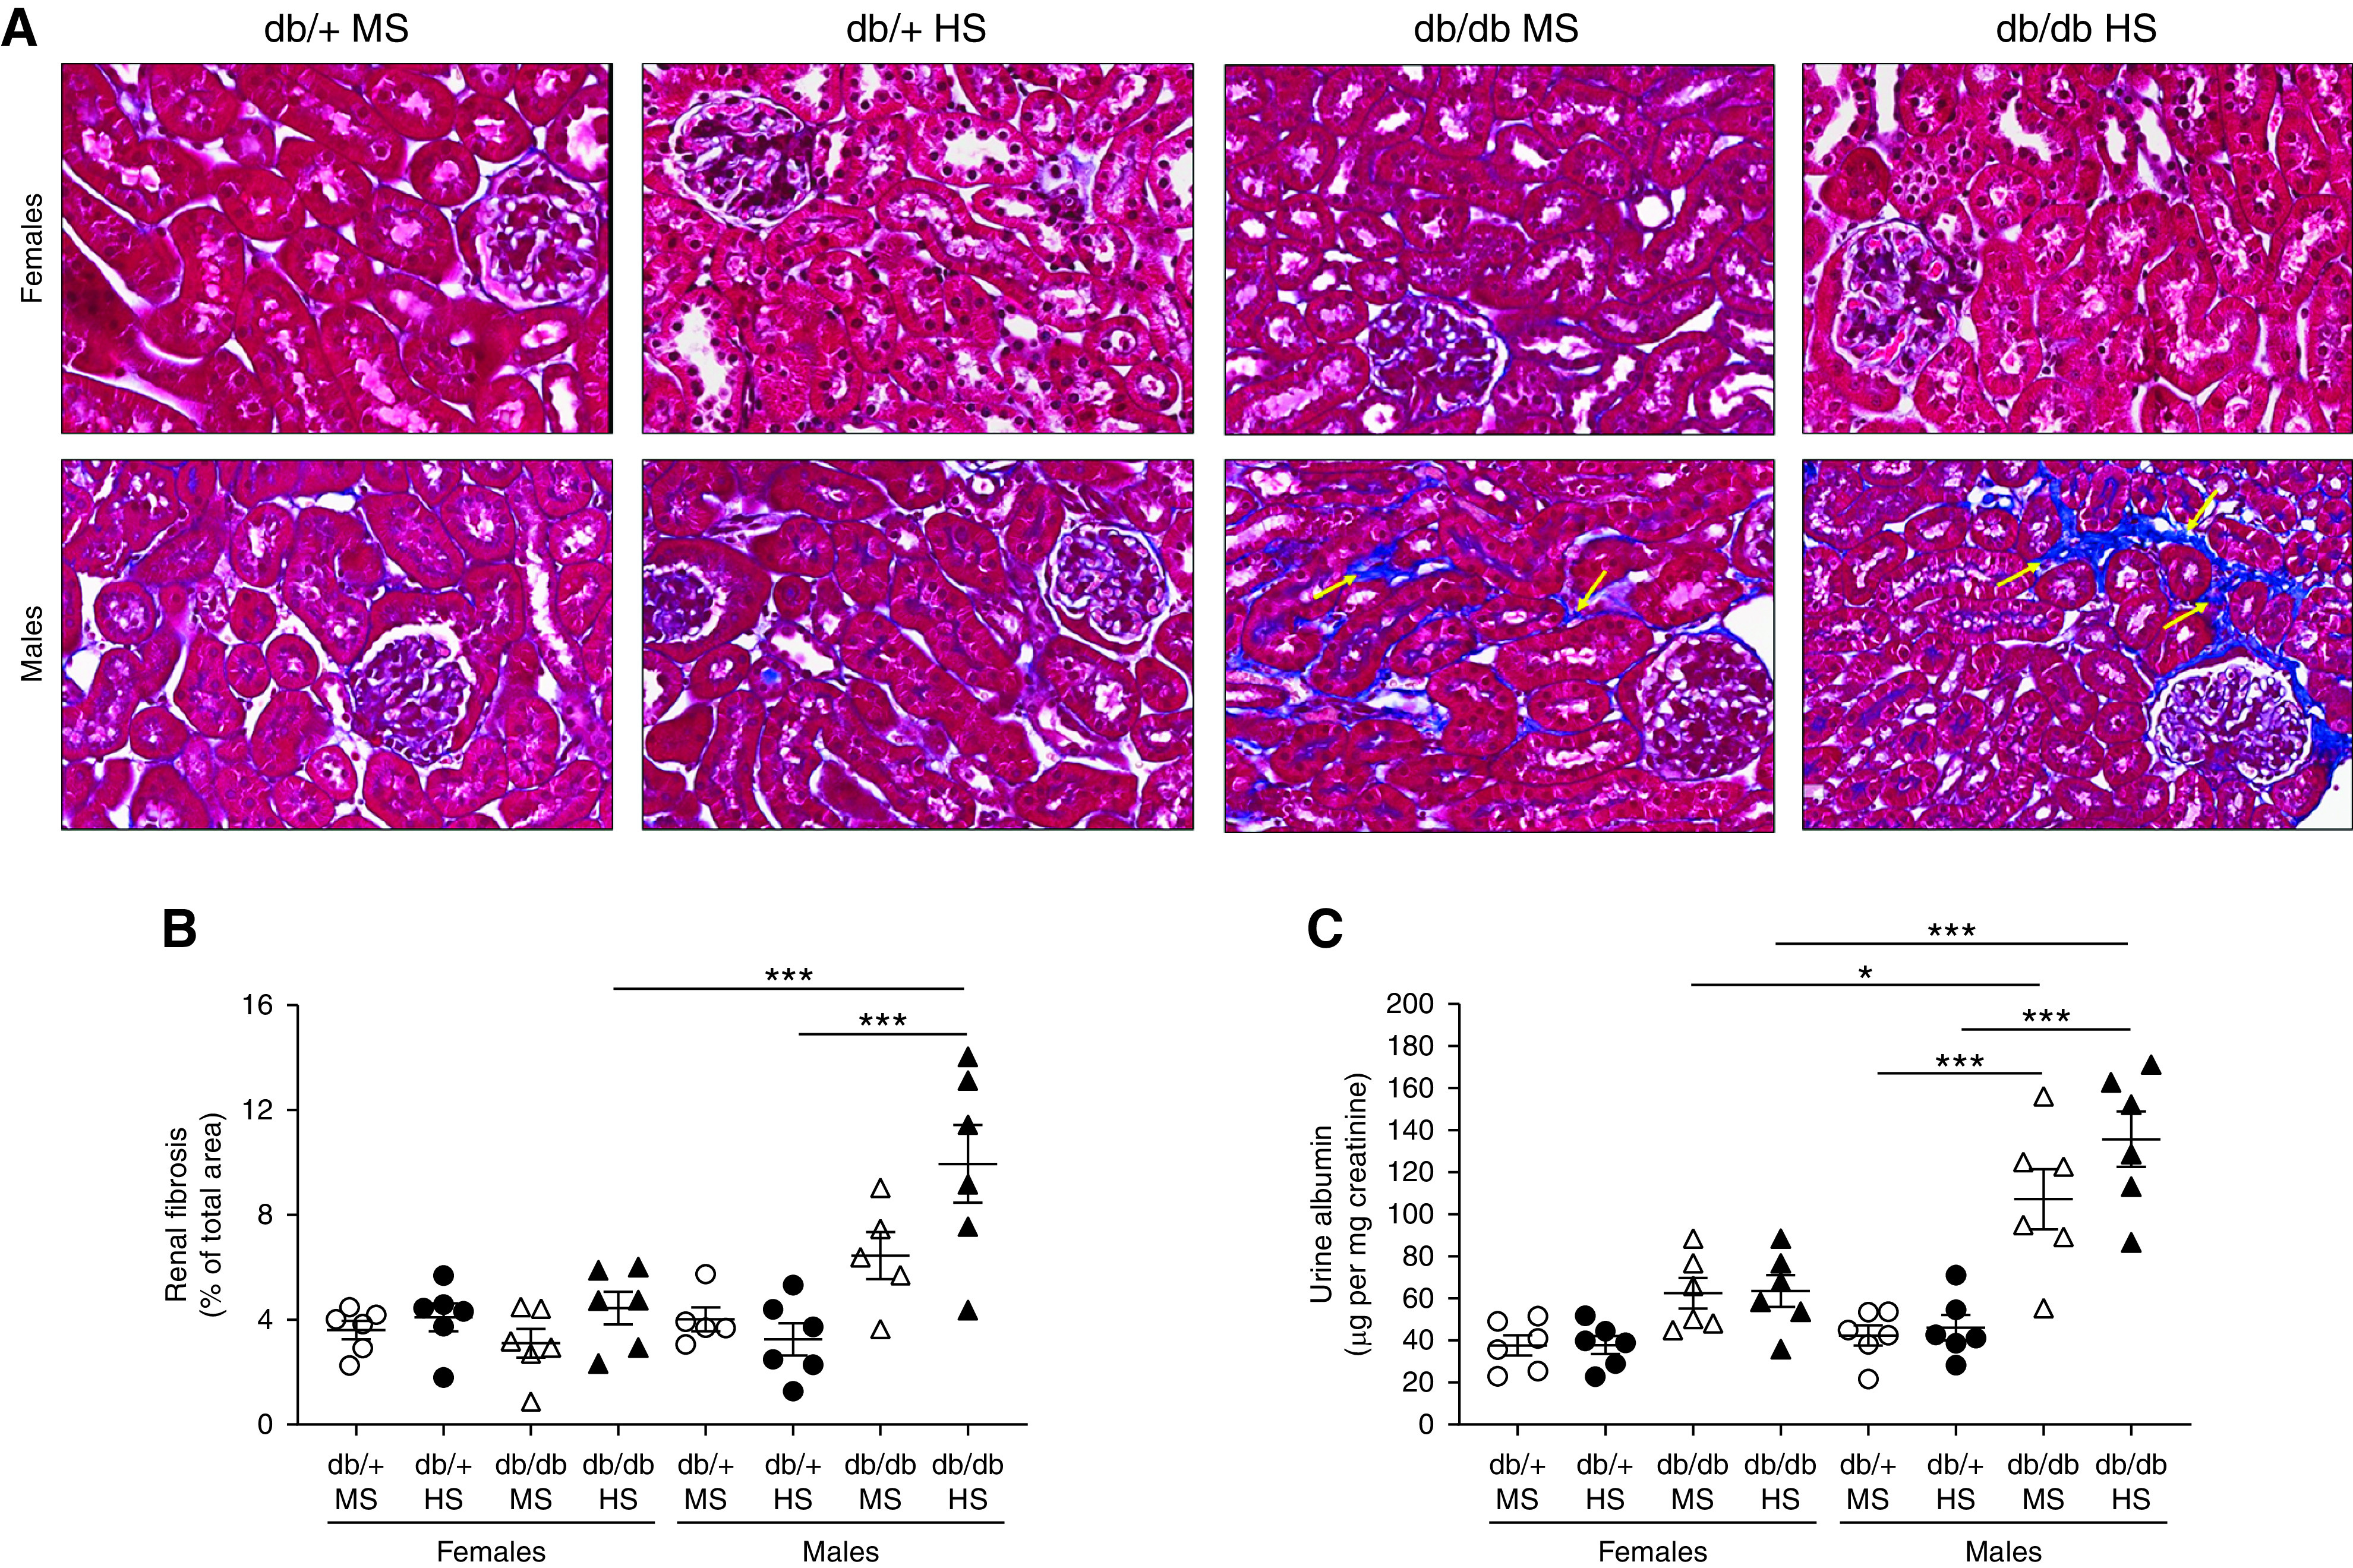
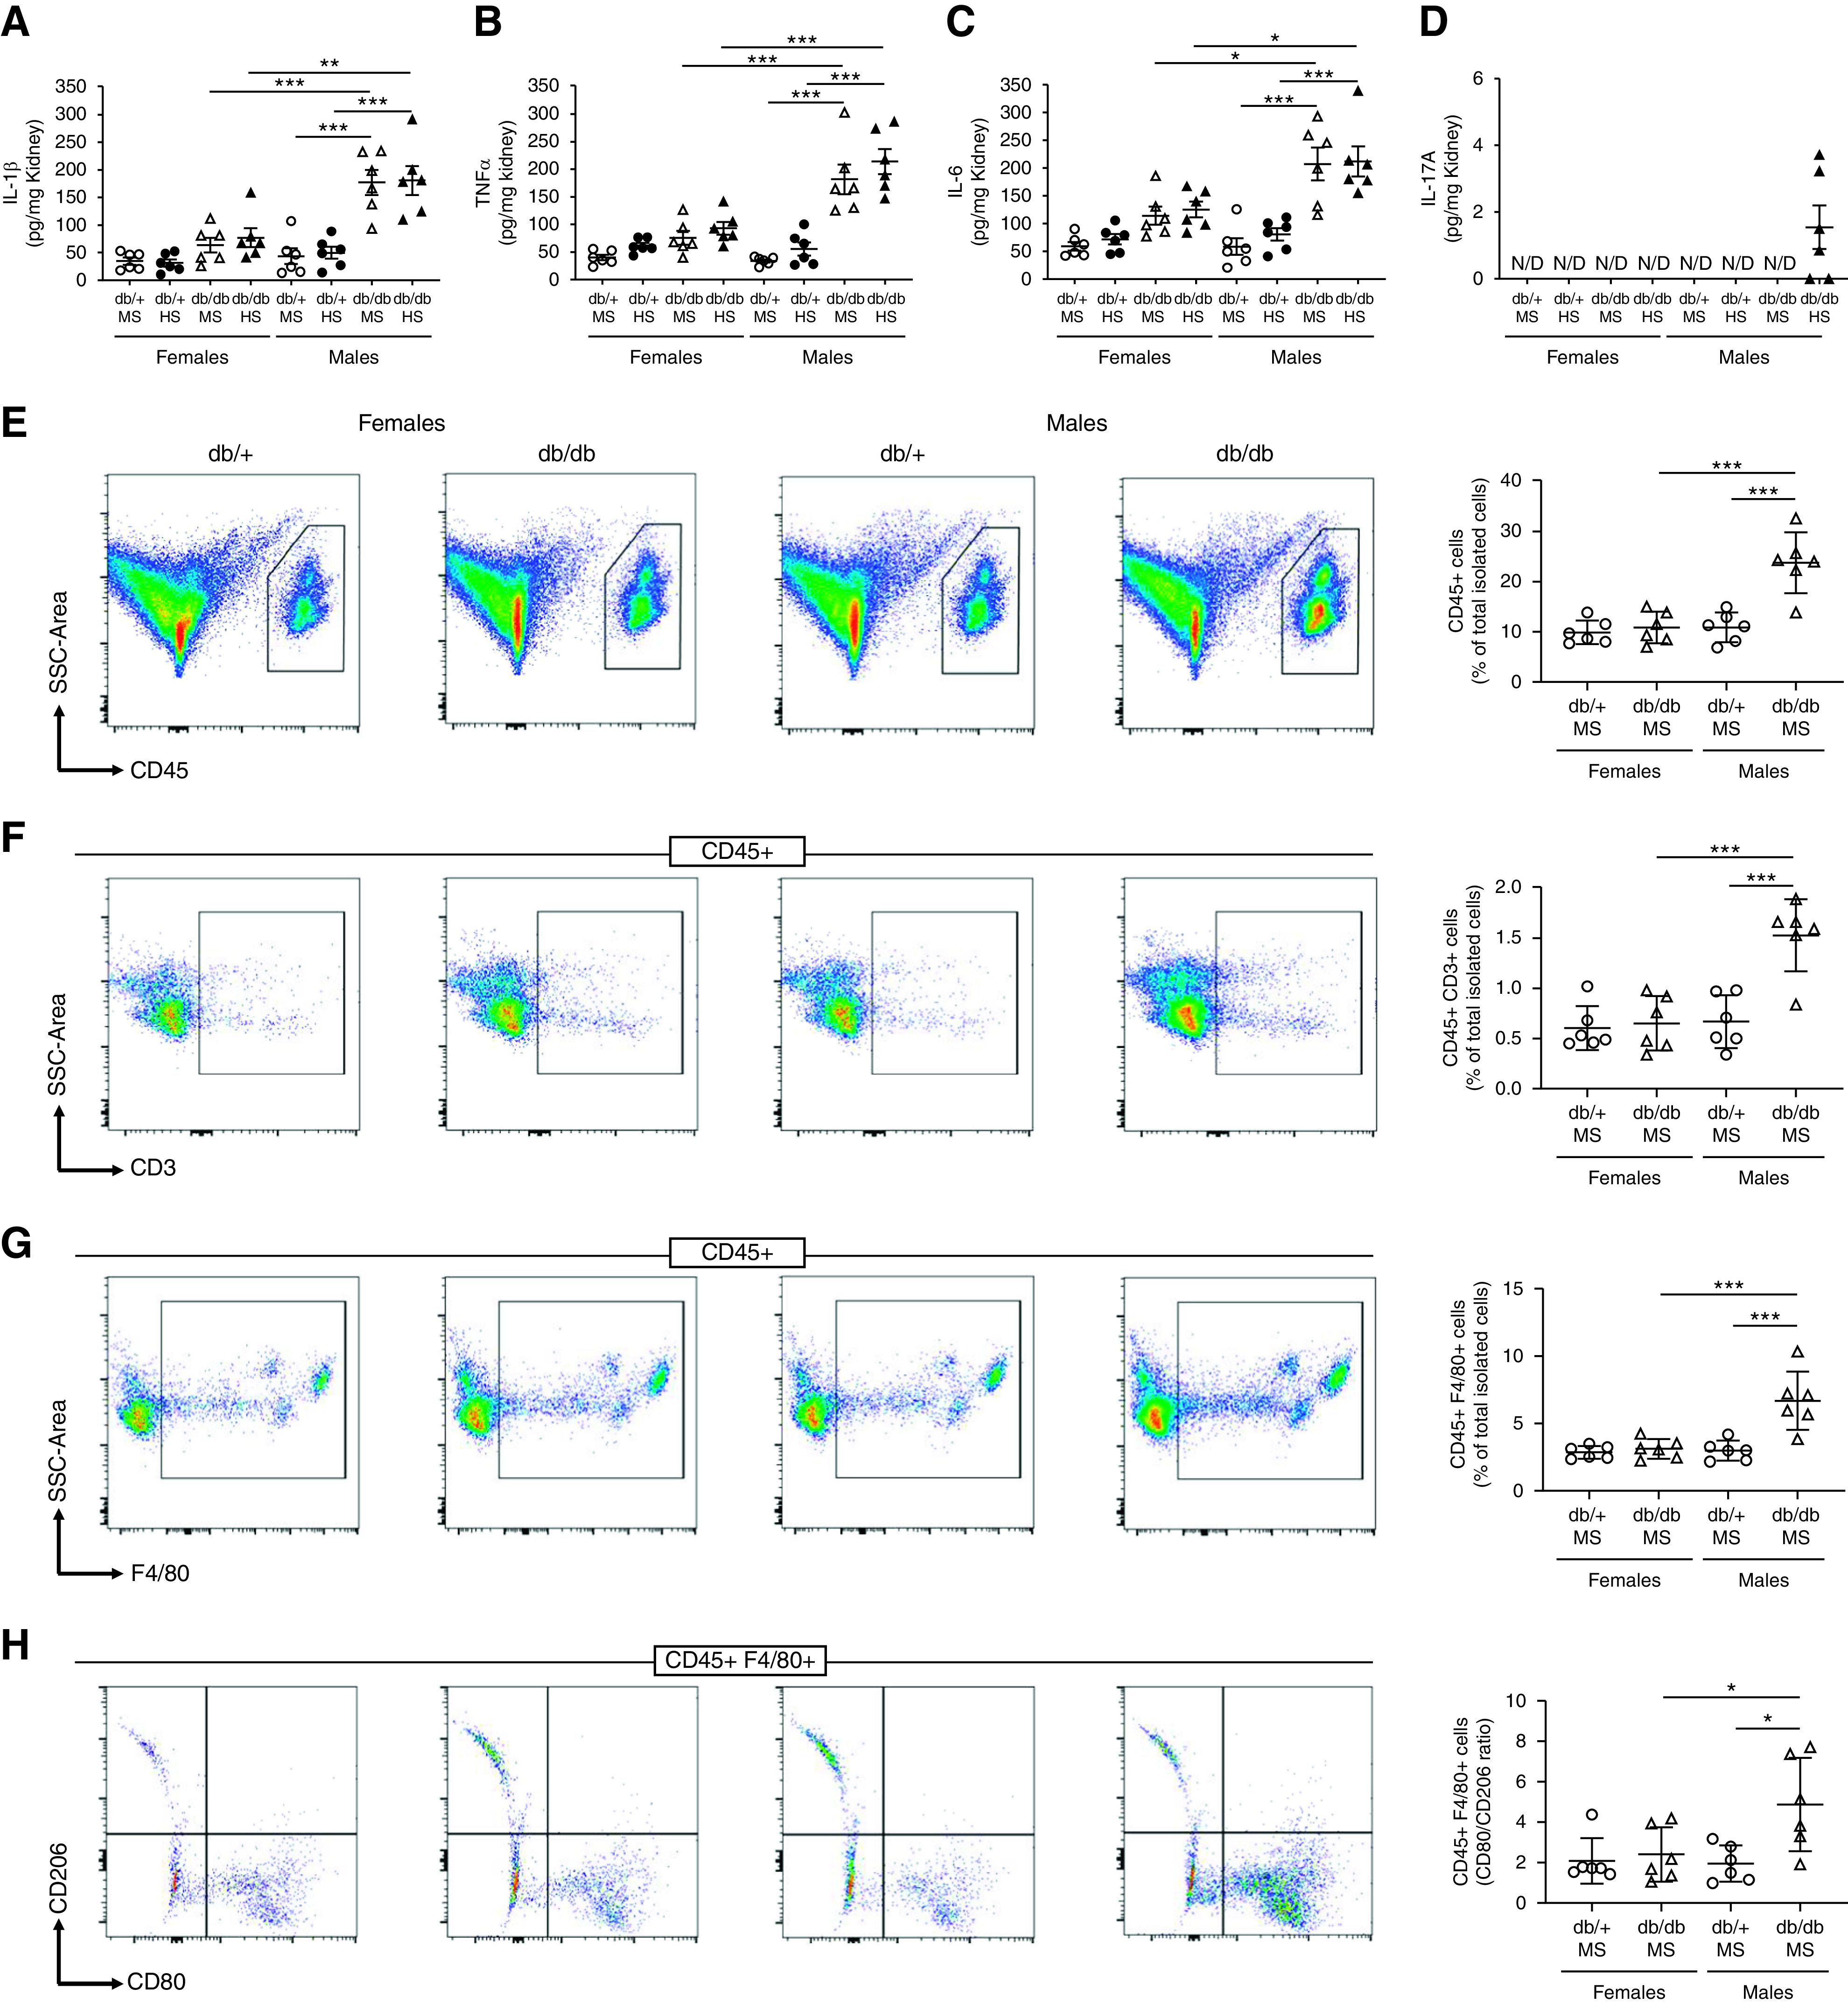
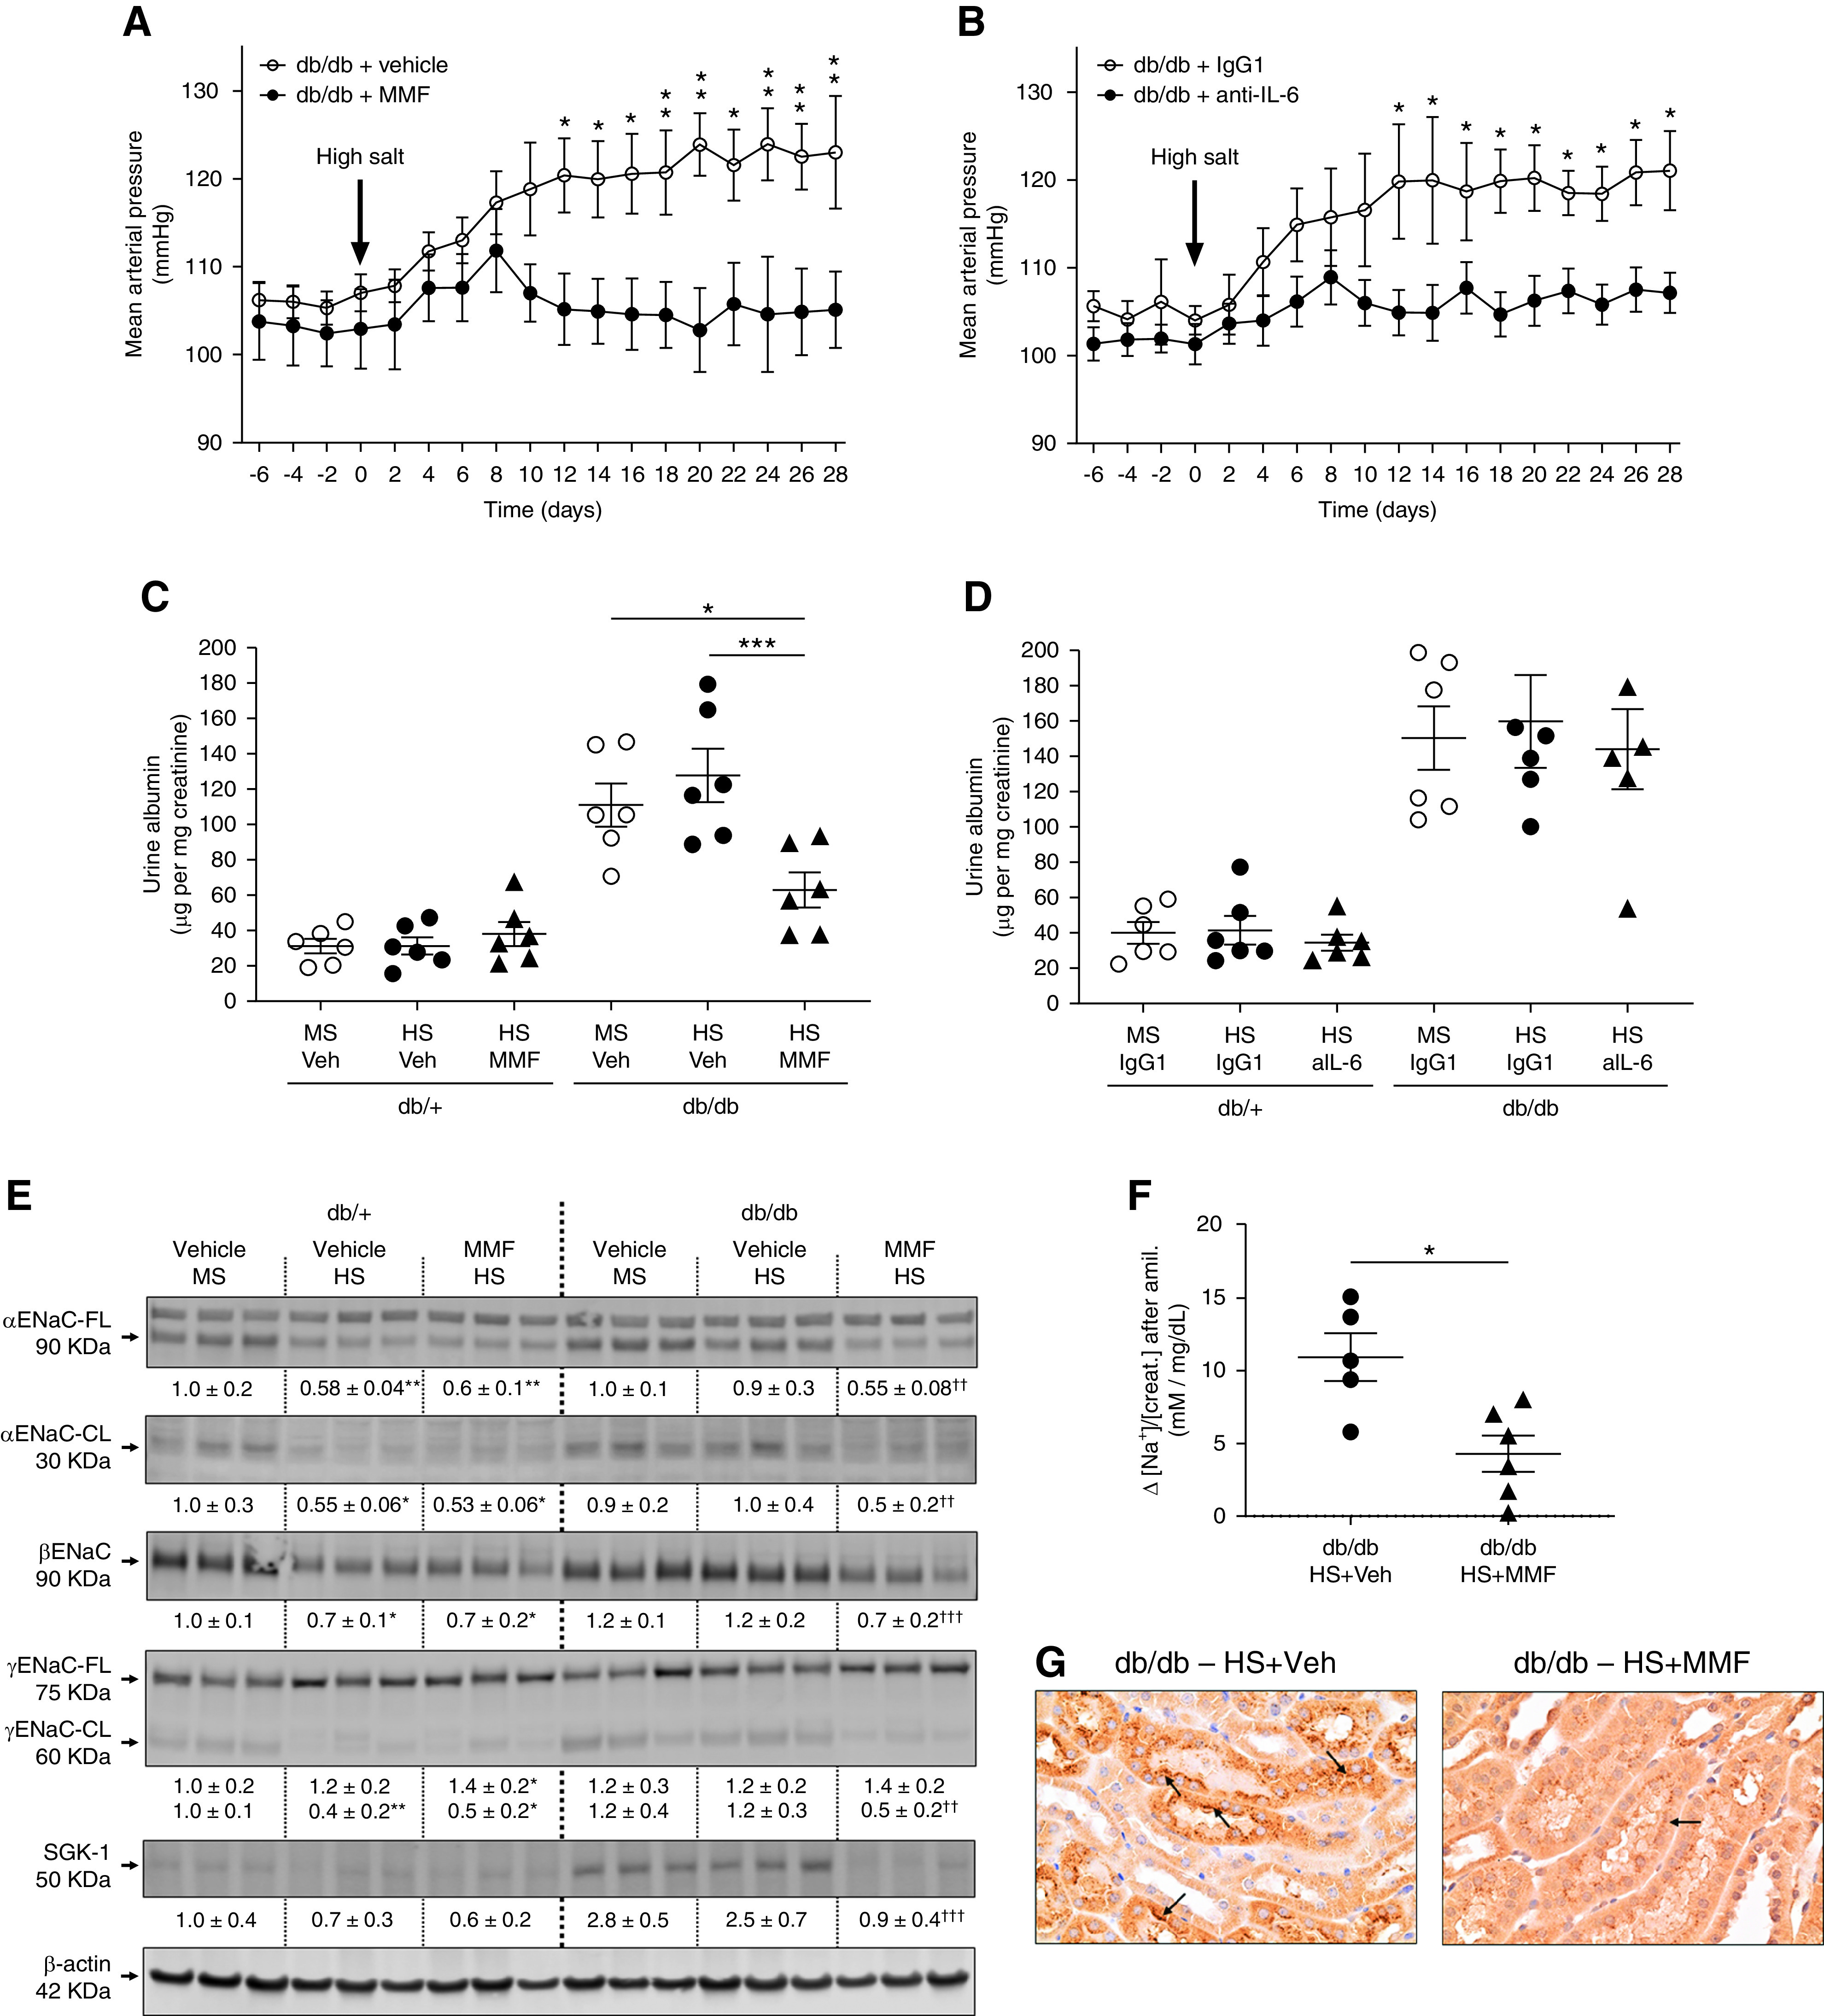
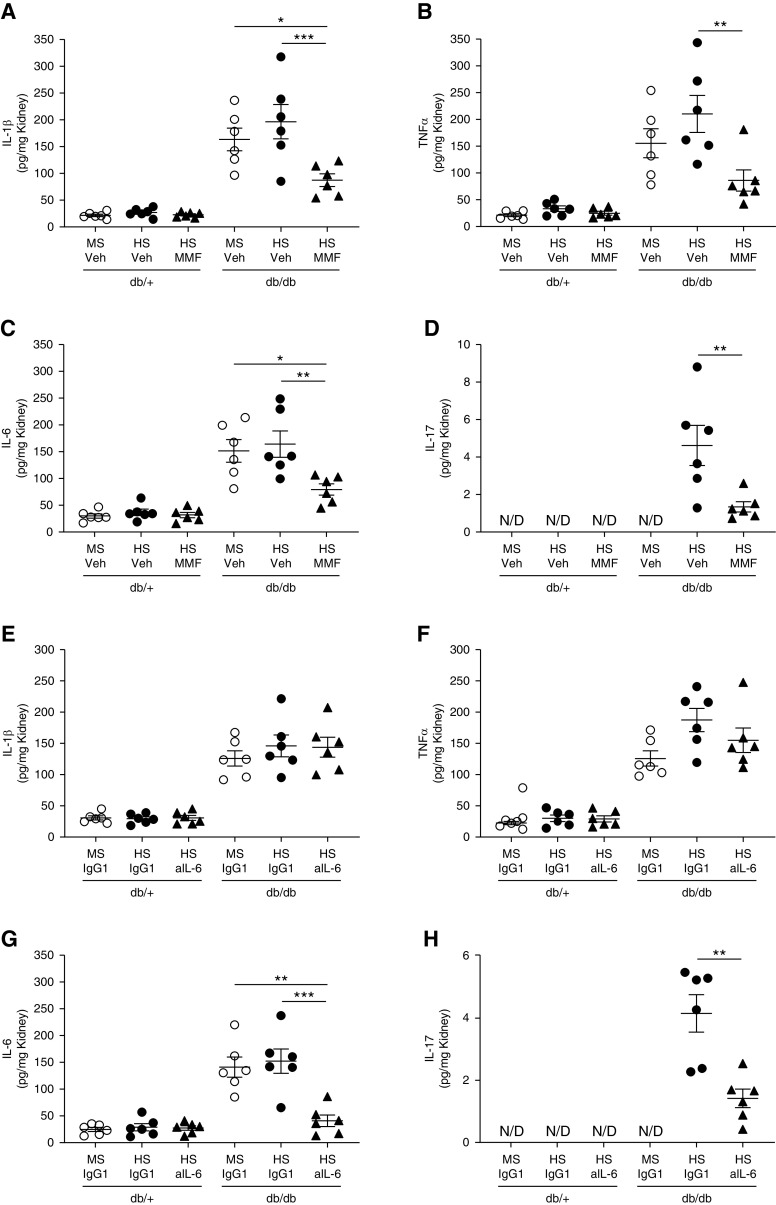
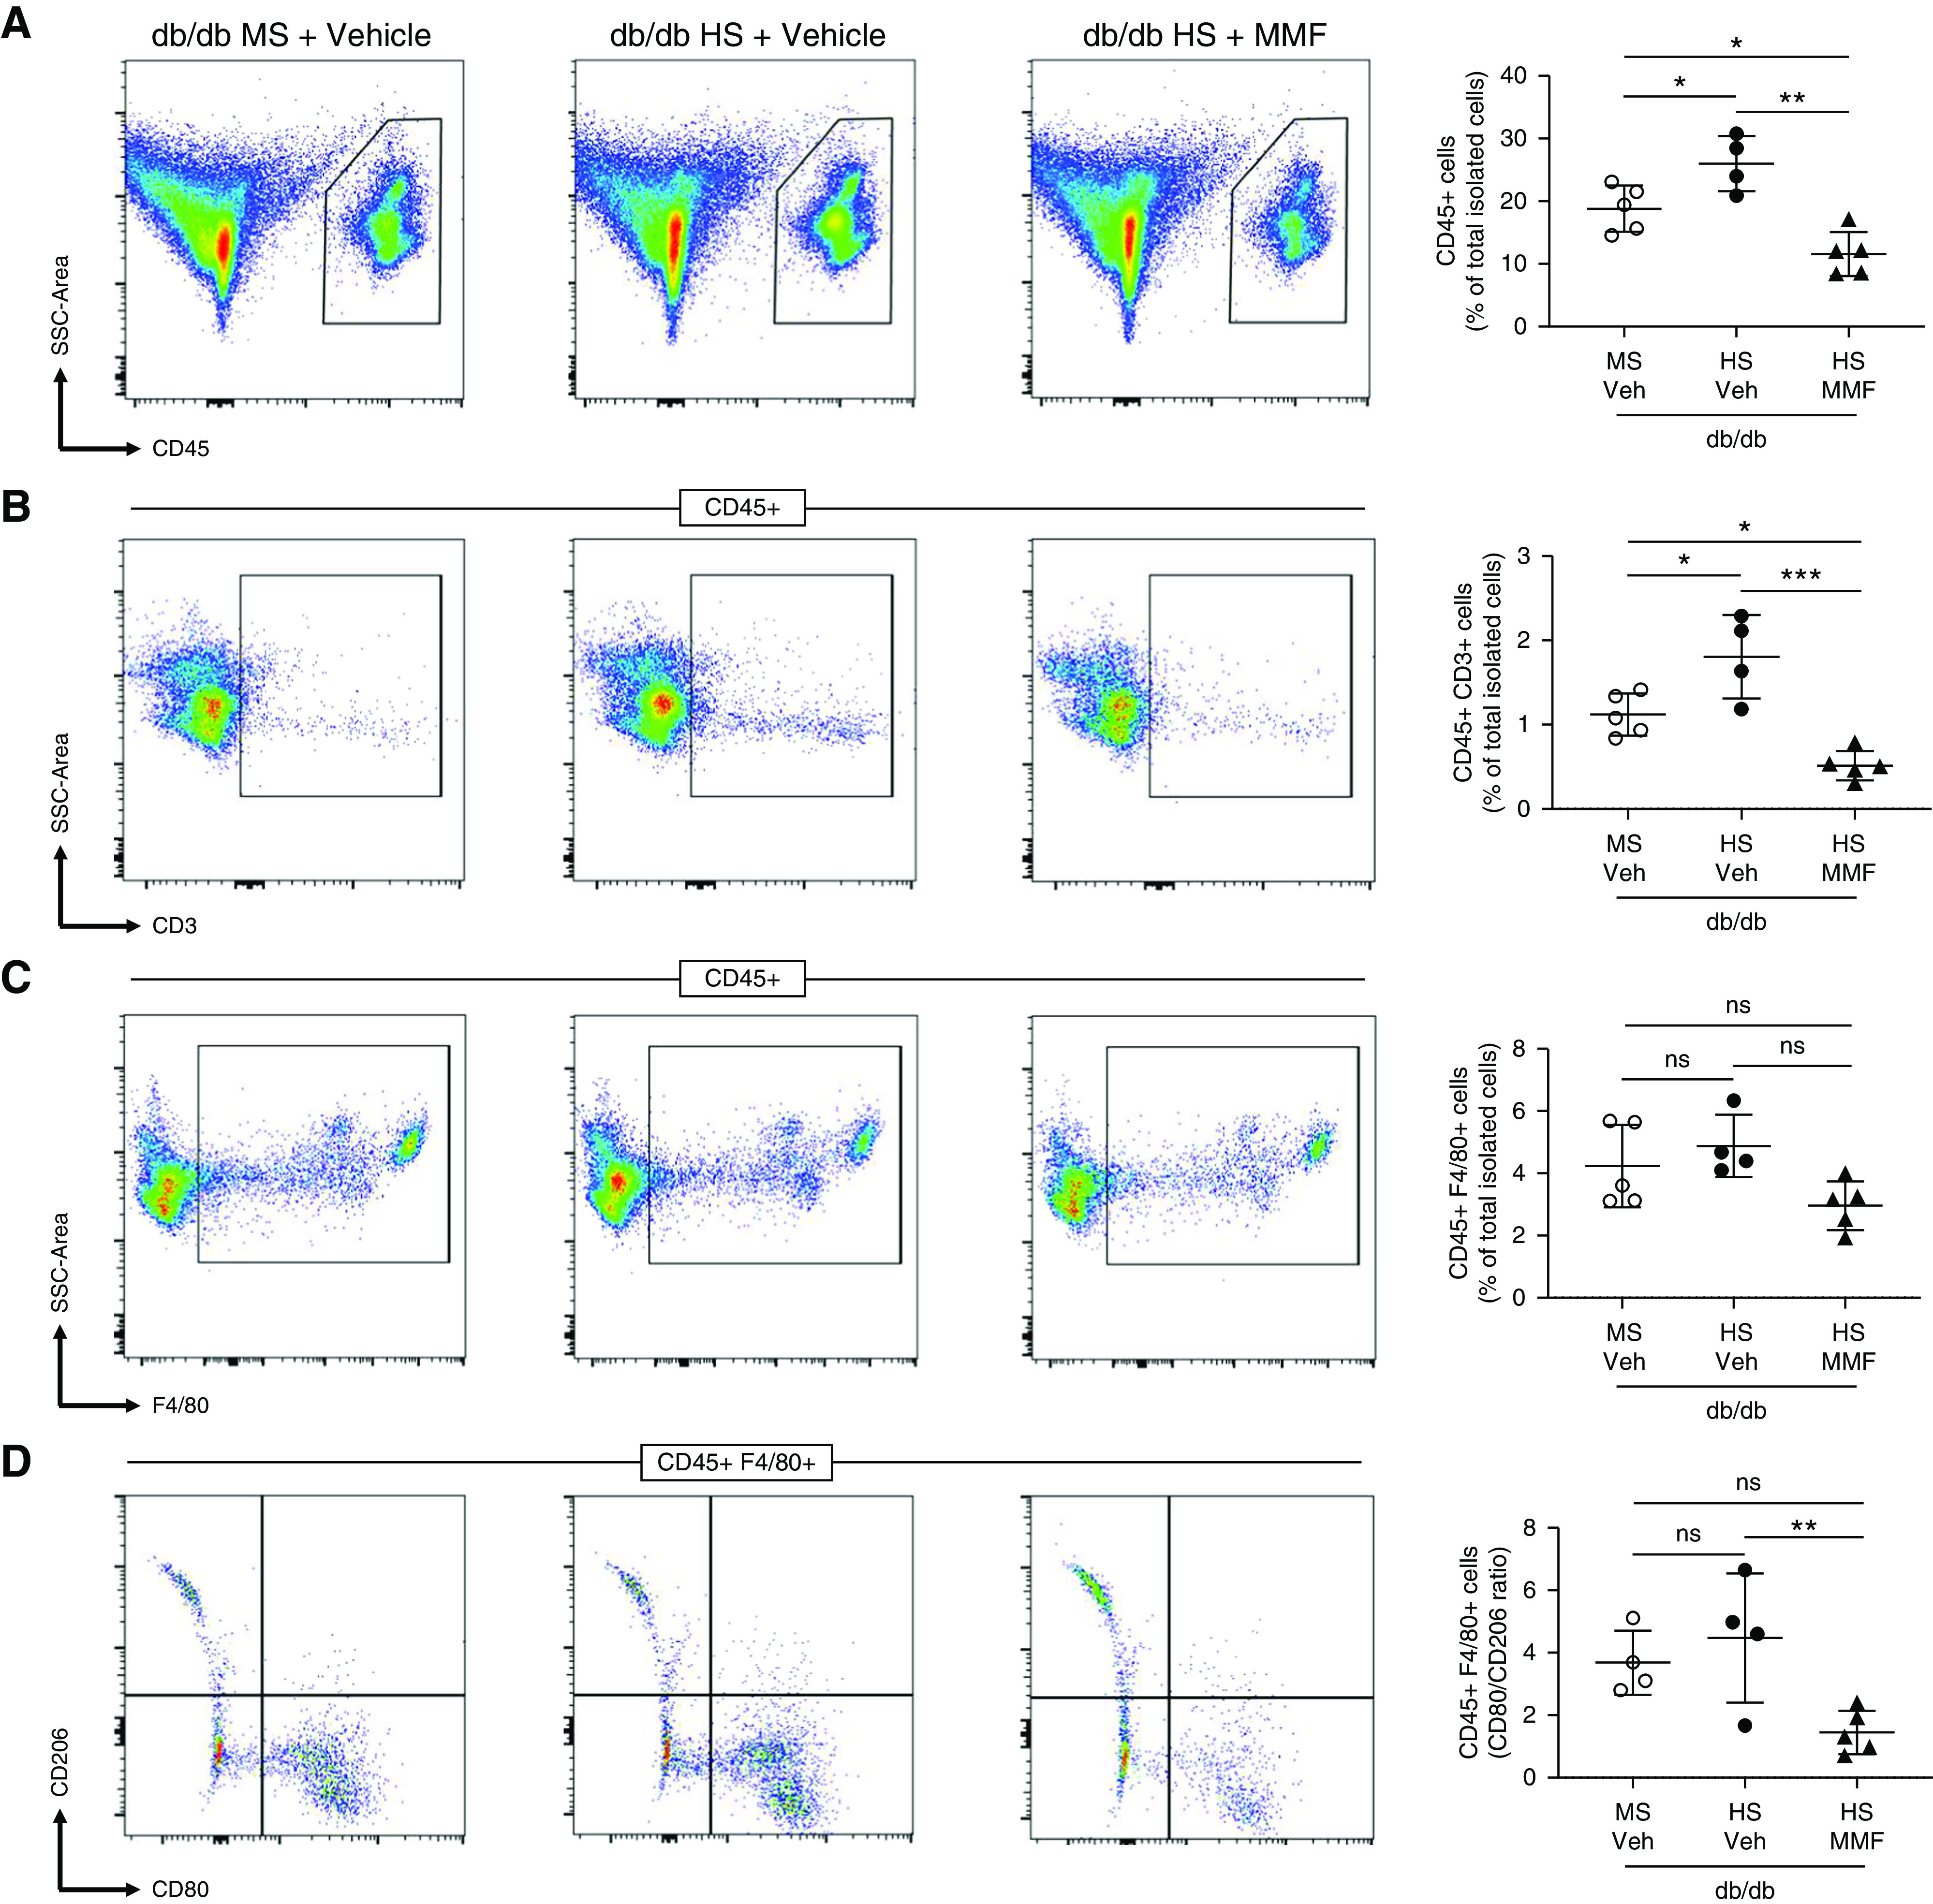
Results: Male, 34-week-old, db/db mice display hypertension when exposed to a 4-week high-salt treatment, whereas equivalently treated female db/db mice remain normotensive. Salt-sensitive hypertension in male mice was associated with no suppression of the epithelial sodium channel (ENaC) in response to a high-salt diet, despite downregulation of several components of the intrarenal renin-angiotensin system. Male db/db mice show higher levels of proinflammatory cytokines and more immune-cell infiltration in the kidney than do female db/db mice. Blocking inflammation, with either mycophenolate mofetil or by reducing IL-6 levels with a neutralizing anti-IL-6 antibody, prevented the development of salt sensitivity in male db/db mice.

Conclusions: The inflammatory response observed in male, but not in female, db/db mice induces salt-sensitive hypertension by impairing ENaC downregulation in response to high salt. These data provide a mechanistic explanation for the sexual dimorphism associated with the development of diabetic kidney disease and salt sensitivity.

Keywords: diabetes; hypertension; inflammation; interleukin-6; obesity; renin angiotensin system; sex differences; sodium transporters.


Figures

None
Graphical abstract
Figure 1.
Figure 1.
Male db/db but not female db/db mice display salt sensitivity. (A) Female and (B) male 30-week-old db/db and db/+ mice were exposed to an HS diet for 4 weeks. MAP was continuously monitored by radiotelemetry. Data are expressed as daily average. At the end of the experiment (week 34), mice were housed in metabolic cages for 24 hours. Mice treated with an MS diet were used as controls. *P<0.05, **P<0.01 versus db/+ mice by multiple t test. (C) Sodium and (D) potassium balance was calculated on the basis of urinary sodium and potassium concentration, urinary volume, and food intake (displayed in Supplemental Figure 1). Data are expressed as dot plots. Horizontal bars represent the mean±SD (n=6 per group). (E) Immunoblots for sodium-hydrogen exchanger isoform 3 (NHE3), NKCC2, NCC, NCC phosphorylated at serine 71 (NCCp), full-length (FL) and cleaved (CL) ENaC α subunit, βENaC, γENaC-FL and -CL, and SGK-1 were performed in kidney homogenates with a constant amount of protein per lane; β-actin was used as loading control. Relative abundance from each group is displayed below the corresponding blot. Female db/+ mice on MS was considered as 1.0. Blots from three representative samples are shown. Uncropped immunoblots and dot-plot analysis for all samples are shown in Supplemental Figures 39. *P<0.05, **P<0.01, ***P<0.001 versus the corresponding group treated with MS. P<0.05, †† P<0.01, ††† P<0.001 versus male db/db HS by three-way ANOVA. (F) Summary of renal sodium-transporter profile expressed as the ratio between HS and MS values. Black arrows indicate those ENaC subunits not suppressed by the HS diet. (G) For the amiloride test, the difference (Δ) in urine sodium/creatinine concentration ([Na+]/[creat.]) between vehicle (0.9% saline) and amiloride injection (5 mg/g body wt in 100 ml of 0.9% NaCl) was calculated. Urine was collected for 4 hours. Data are expressed as dot plots. Horizontal bars represent the mean±SD (n=6 per group). *P<0.05, ***P<0.001 by three-way ANOVA. (H) Immunohistochemical analysis of αENaC in kidney samples. Black arrows indicate positive αENaC staining. K+, potassium; Na+, sodium.
Figure 2.
Figure 2.
HS diet suppresses the intrarenal RAS in all experimental groups. (A) Renin, (B) angiotensinogen, (C) ACE, and (D) ACE2 expression were evaluated by Western blot in kidney homogenates. Immunoblots were performed with a constant amount of protein per lane; β-actin was used as loading control. Female db/+ mice on MS was considered as 1.0. Blots from three representative samples are shown. Uncropped immunoblots for all samples are shown in Supplemental Figures 10 and 11. (E) Renal angiotensin II was evaluated by ELISA in kidney homogenates. (F) Plasma aldosterone and (G) vasopressin were assessed by ELISA. Data are expressed as dot plots. Horizontal bars represent the mean±SD (n=5–6 per group). *P<0.05, **P<0.01, ***P<0.001 by three-way ANOVA.
Figure 3.
Figure 3.
Male db/db mice display higher fibrosis and albuminuria than female and male db/+ mice. (A) Renal interstitial fibrosis was evaluated using Masson trichrome staining and (B) expressed as the percentage of fibrosis of the total kidney area. (C) Urinary albumin was measured by ELISA in 24-hour urine and expressed as micrograms of albumin per milligram of creatinine. Data are expressed as dot plots. Horizontal bars represent the mean±SD (n=6 per group). *P<0.05, ***P<0.001 by three-way ANOVA. Yellow arrows in (A) indicate interstitial fibrosis.
Figure 4.
Figure 4.
Female db/db mice have lower renal inflammation and less immune-cell infiltration in the kidney compared with male db/db mice. (A) IL-1β, (B) TNFα, (C) IL-6, and (D) IL-17A were evaluated in kidney homogenates by ELISA. Data are expressed as dot plots. Horizontal bars represent the mean±SD (n=6 per group). *P<0.05, **P<0.01, ***P<0.001 by three-way ANOVA. A single-cell suspension from kidney was analyzed by flow cytometry. (E) Total immune cells (CD45+), (F) lymphocytes (CD45+ CD3+), (G) macrophages (CD45+ F4/80+), and (H) the macrophage CD80/CD206 ratio were measured. Data are expressed as dot plots. Horizontal bars represent the average percentage of positive cells as mean±SD (n=6 per group). *P<0.05, ***P<0.001 by two-way ANOVA. N/D, not detected. SSC, side scatter.
Figure 5.
Figure 5.
MMF and IL-6 neutralization prevent salt sensitivity in male db/db mice. (A) Male db/db mice were exposed to the HS diet for 4 weeks in the presence of MMF (30 mg/kg per day dissolved in 3% DMSO vol/vol in saline). Control mice were treated with vehicle (Veh; DMSO 3% in saline). (B) Another cohort of male db/db mice was exposed to the HS diet in the presence of anti–IL-6 neutralizing antibody (aIL-6; 0.2 mg/wk dissolved in saline). Control mice received isotype control rat IgG1 (0.2 mg/wk dissolved in saline). MAP was continuously monitored by radiotelemetry. Data are expressed as daily average. *P<0.05, **P<0.01 versus db/db mice receiving control treatment by multiple t test. At the end of the experiment (week 34), mice were housed in metabolic cages for 24 hours for urine collection. (C–D) Urine albumin was assessed by ELISA and expressed as micrograms of albumin per milligram of creatinine. (E) For mice treated with MMF, immunoblots for full-length (FL) and cleaved (CL) αENaC, βENaC, γENaC-FL and -CL, and SGK-1 were performed in kidney homogenates with a constant amount of protein per lane; β-actin was used as loading control. Relative abundance from each group is displayed below the corresponding blot. The group of db/+ mice on MS and vehicle was considered as 1.0. Blots from three representative samples are shown. Uncropped immunoblots and dot-plot analysis for all samples are shown in Supplemental Figures 1417. *P<0.05, **P<0.01 versus db/+ mice on MS and vehicle; †† P<0.01, ††† P<0.001 versus db/db mice on HS and vehicle by two-way ANOVA. (F) For the amiloride test, the difference (Δ) in urine sodium/creatinine concentration ([Na+]/[creat.]) between vehicle (0.9% saline) and amiloride injection (5 mg/g body wt in 100 ml of 0.9% NaCl) was calculated. Urine was collected for 4 hours. Data are expressed as dot plots. Horizontal bars represent the mean±SD (n=6 per group). *P<0.05 by t test. (G) Immunohistochemical analysis of αENaC in kidney samples. Black arrows indicate positive αENaC staining.
Figure 6.
Figure 6.
MMF and IL-6 neutralization prevent the accumulation of cytokines in the kidney. (A and E) IL-1β, (B and F) TNFα, (C and G) IL-6, and (D and H) IL-17A were evaluated in kidney homogenates by ELISA. Data are expressed as dot plots. Horizontal bars represent the mean±SD (n=6 per group). *P<0.05, **P<0.01, ***P<0.001 by two-way ANOVA. Panels (A–D) show renal cytokine levels in mice treated with MMF. Panels (E–H) show renal cytokine levels in mice treated with an anti–IL-6 neutralizing antibody (aIL-6). N/D, not detected; Veh, vehicle.
Figure 7.
Figure 7.
MMF prevents the accumulation of immune cells in the kidney of db/db mice. A single-cell suspension from kidney was stained with antibodies detecting CD45, CD3, F4/80, CD80, and CD206. (A) Total immune cells (CD45+), (B) lymphocytes (CD45+ CD3+), (C) macrophages (CD45+ F4/80+), and (D) the macrophage CD80/CD206 ratio were measured by flow cytometry. Data are expressed as dot plots. Horizontal bars represent the average percentage of positive cells as mean±SD (n=4–5 per group). *P<0.05, **P<0.01, ***P<0.001 by one-way ANOVA. SSC, side scatter; Veh, vehicle.
Figure 8.
Figure 8.
Male, 22-week-old, db/db mice do not develop salt sensitivity but have impaired sodium handling and inflammation. (A) Female and (B) male 18-week-old db/db and db/+ mice were exposed to an HS diet for 4 weeks. MAP was continuously monitored by radiotelemetry. Data are expressed as daily average. At the end of the experiment (week 22), mice were housed in metabolic cages for 24-hour urine collection. (C) Urinary albumin was measured by ELISA in 24-hour urine and expressed as micrograms of albumin per milligram of creatinine. Data are expressed as dot plots. Horizontal bars represent the mean±SD. For saline test, (D) female and (E) male mice were challenged with an i.p. bolus of warmed saline, equivalent to 10% of their body weight, and placed in metabolic cages for hourly urine collection. Plots represent the accumulated excretion of sodium over a 5-hour collection period. n=6 per group. **P<0.01 by t test. (F) IL-1β, (G) IL-6, and (H) TNFα were evaluated in total kidney homogenates by ELISA. Data are expressed as dot plots. Horizontal bars represent the mean±SD (n=6 per group). *P<0.05, **P<0.01, ***P<0.001 by three-way ANOVA.

References

    1. Abbate R, Mannucci E, Cioni G, Fatini C, Marcucci R: Diabetes and sex: From pathophysiology to personalized medicine. Intern Emerg Med 7[Suppl 3]: S215–S219, 2012. - PubMed
    1. Neugarten J, Golestaneh L: Gender and the prevalence and progression of renal disease. Adv Chronic Kidney Dis 20: 390–395, 2013. - PubMed
    1. Parving HH, Gall MA, Skøtt P, Jørgensen HE, Løkkegaard H, Jørgensen F, et al. .: Prevalence and causes of albuminuria in non-insulin-dependent diabetic patients. Kidney Int 41: 758–762, 1992. - PubMed
    1. Ravid M, Brosh D, Ravid-Safran D, Levy Z, Rachmani R: Main risk factors for nephropathy in type 2 diabetes mellitus are plasma cholesterol levels, mean blood pressure, and hyperglycemia. Arch Intern Med 158: 998–1004, 1998. - PubMed
    1. Fernandez-Fernandez B, Ortiz A, Gomez-Guerrero C, Egido J: Therapeutic approaches to diabetic nephropathy--beyond the RAS. Nat Rev Nephrol 10: 325–346, 2014. - PubMed

Publication types