

Frequency and source of prescription eyewear insurance coverage in Ontario: a repeated population-based cross-sectional study using survey data
- PMID: 33731423
- PMCID: PMC8034370
- DOI: 10.9778/cmajo.20200104
Frequency and source of prescription eyewear insurance coverage in Ontario: a repeated population-based cross-sectional study using survey data
Abstract
Background: Insurance coverage may reduce cost barriers to obtain vision correction. Our aim was to determine the frequency and source of prescription eyewear insurance to understand how Canadians finance optical correction.
Methods: We conducted a repeated population-based cross-sectional study using 2003, 2005 and 2013-2014 Canadian Community Health Survey data from respondents aged 12 years or older from Ontario, Canada. In this group, the cost of prescription eyewear is not covered by the government unless one is registered with a social assistance program or belongs to a specific population. We determined the frequency and source of insurance coverage for prescription eyewear in proportions. We used survey weights provided by Statistics Canada in all analyses to account for sample selection, a complex survey, and adjustments for seasonal effect, poststratification, nonresponse and calibration. We compared unadjusted proportions and adjusted prevalence ratios (PRs) of having insurance.
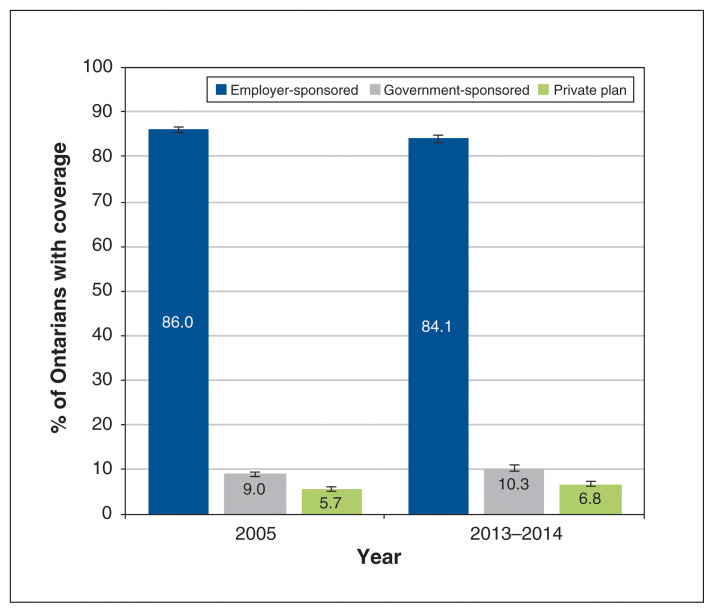
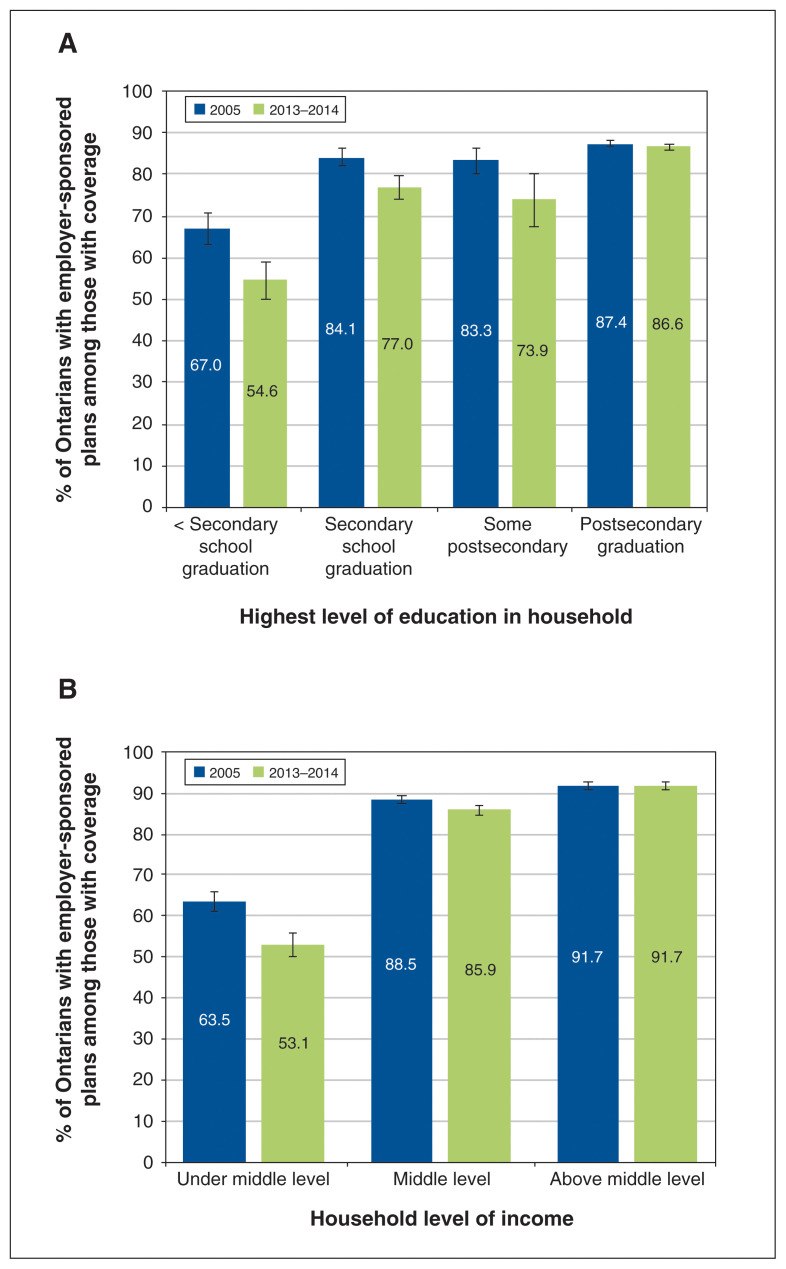
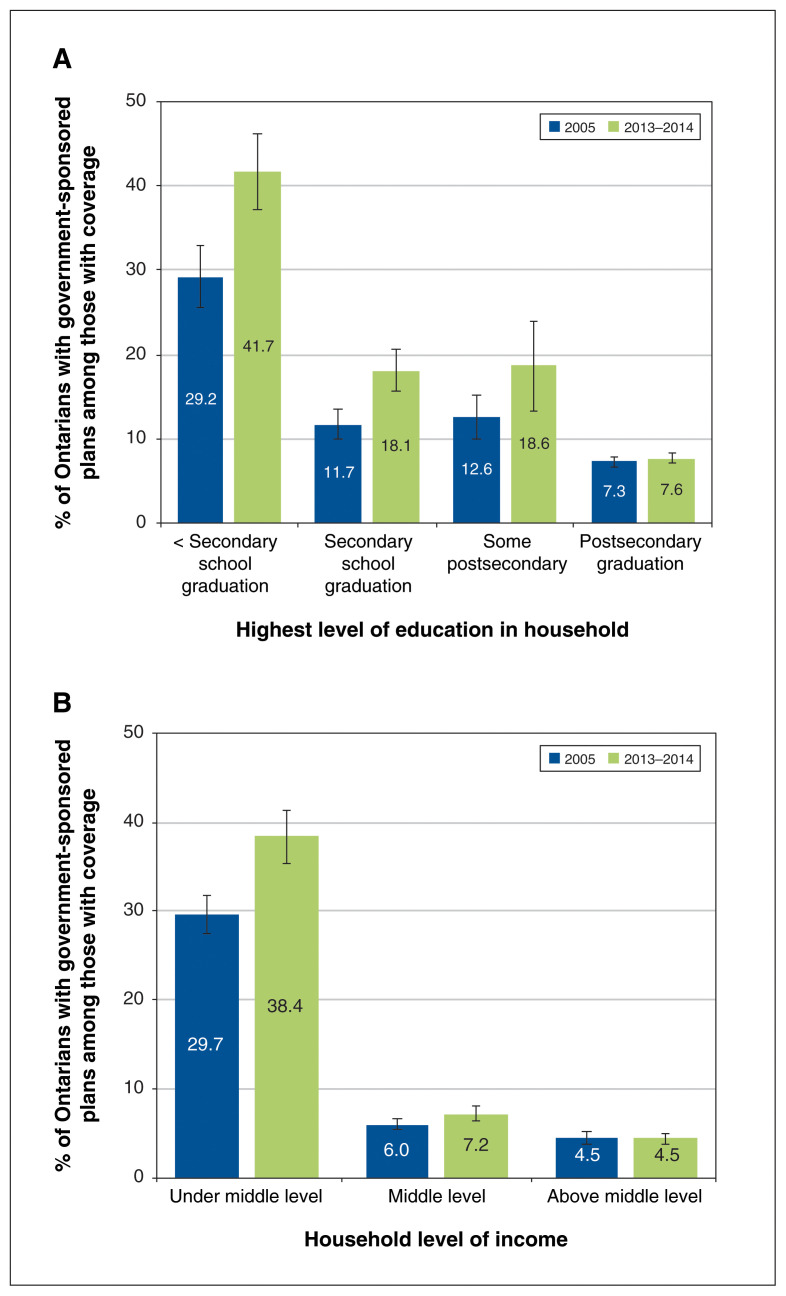
Results: Insurance covered all or part of the costs of prescription eyewear for 62% of Ontarians in all 3 survey years. Of those insured, 84.1%-86.0% had employer-sponsored coverage, 9.0%-10.3% had government-sponsored coverage, and 5.7%-6.8% had private plans. Employer-sponsored coverage remained constant for those in households with postsecondary graduation but decreased significantly for those in households with less than secondary school graduation, from 67.0% (95% confidence interval [CI] 63.2%-70.8%) (n = 175 000) in 2005 to 54.6% (95% CI 50.1%-59.2%) (n = 123 500) in 2013-2014. Government-sponsored coverage increased significantly for those in households with less than secondary school graduation, from 29.2% (95% CI 25.5%-32.9%) (n = 76 400) in 2005 to 41.7% (95% CI 37.2%-46.1%) (n = 93 900) in 2013-2014. In 2013-2014, Ontarians in households with less than secondary school graduation were less likely than those with secondary school graduation to report employer-sponsored coverage (adjusted PR 0.79, 95% CI 0.75-0.84) but were more likely to have government-sponsored coverage (adjusted PR 1.27, 95% CI 1.06-1.53).
Interpretation: Sixty-two percent of Ontarians had prescription eyewear insurance in 2003, 2005 and 2013-2014; the largest source of insurance was employers, primarily covering those with higher education levels, whereas government-sponsored insurance increased significantly among those with lower education levels. Further research is needed to elucidate barriers to obtaining prescription eyewear and the degree to which affordability impairs access to vision correction.
© 2021 Joule Inc. or its licensors.
Conflict of interest statement
Competing interests: Sherif El-Defrawy reports research grant support from Alcon, outside the submitted work. Ya-Ping Jin reports research grant support from the Lindenfield Family Research Grant for this study, and from the Glaucoma Research Society of Canada and the Kensington Eye Institute, outside the submitted work. Yvonne Buys reports consulting fees from Allergan and Bausch & Lomb, outside the submitted work. No other competing interests were declared.
Figures
Similar articles
-
Impact of eyewear insurance coverage on utilization of eyecare providers in Ontario, Canada.Can J Ophthalmol. 2025 Jun;60(3):e350-e356. doi: 10.1016/j.jcjo.2024.08.005. Epub 2024 Aug 22. Can J Ophthalmol. 2025. PMID: 39181159
-
Significant disparities in eyeglass insurance coverage in Canada.Can J Ophthalmol. 2018 Jun;53(3):260-265. doi: 10.1016/j.jcjo.2017.10.007. Epub 2017 Dec 11. Can J Ophthalmol. 2018. PMID: 29784163
-
Financial burden of household out-of-pocket expenditures for prescription drugs: cross-sectional analysis based on national survey data.Open Med. 2011;5(1):e1-9. Epub 2011 Jan 4. Open Med. 2011. PMID: 22046212 Free PMC article.
-
Selection and Costs for Employer-Sponsored Health Insurance in the Private Sector, 2013 versus 2012.2014 Jul. In: Statistical Brief (Medical Expenditure Panel Survey (US)) [Internet]. Rockville (MD): Agency for Healthcare Research and Quality (US); 2001–. STATISTICAL BRIEF #445. 2014 Jul. In: Statistical Brief (Medical Expenditure Panel Survey (US)) [Internet]. Rockville (MD): Agency for Healthcare Research and Quality (US); 2001–. STATISTICAL BRIEF #445. PMID: 29360329 Free Books & Documents. Review.
-
Employer-Sponsored Single, Employee-Plus-One, and Family Health Insurance Coverage in the Private Sector: Selection and Cost, 2012.2013 Jul. In: Statistical Brief (Medical Expenditure Panel Survey (US)) [Internet]. Rockville (MD): Agency for Healthcare Research and Quality (US); 2001–. STATISTICAL BRIEF #416. 2013 Jul. In: Statistical Brief (Medical Expenditure Panel Survey (US)) [Internet]. Rockville (MD): Agency for Healthcare Research and Quality (US); 2001–. STATISTICAL BRIEF #416. PMID: 29708706 Free Books & Documents. Review.
References
-
- Population estimates on July 1st, by age and sex: Table 17-10-0005-01. Ottawa: Statistics Canada; 2019. [accessed 2018 June 10]. Available: www150.statcan.gc.ca/t1/tbl1/en/cv.action?pid=1710000501.
-
- Perruccio AV, Badley EM, Trope GE. A Canadian population-based study of vision problems: assessing the significance of socioeconomic status. Can J Ophthalmol. 2010;45:477–83. - PubMed
Publication types
MeSH terms
Grants and funding
LinkOut - more resources
Full Text Sources
Other Literature Sources
Medical
Research Materials