. 2021 Mar 17;13(585):eabb0122.
doi: 10.1126/scitranslmed.abb0122.

Graft-derived extracellular vesicles transported across subcapsular sinus macrophages elicit B cell alloimmunity after transplantation

Affiliations

Graft-derived extracellular vesicles transported across subcapsular sinus macrophages elicit B cell alloimmunity after transplantation

Furong Zeng et al. Sci Transl Med. .

Abstract

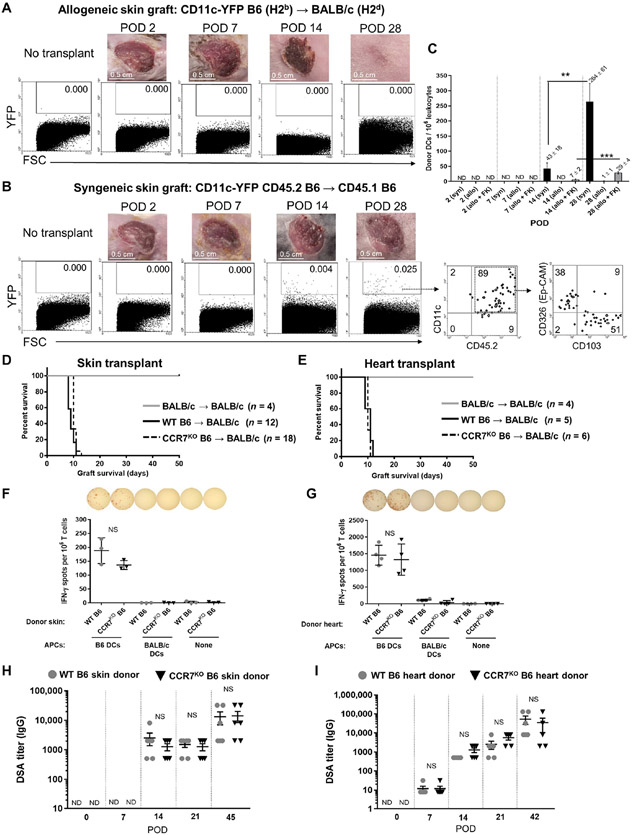
Despite the role of donor-specific antibodies (DSAs) in recognizing major histocompatibility complex (MHC) antigens and mediating transplant rejection, how and where recipient B cells in lymphoid tissues encounter donor MHC antigens remains unclear. Contrary to the dogma, we demonstrated here that migration of donor leukocytes out of skin or heart allografts is not necessary for B or T cell allosensitization in mice. We found that mouse skin and cardiac allografts and human skin grafts release cell-free donor MHC antigens via extracellular vesicles (EVs) that are captured by subcapsular sinus (SCS) macrophages in lymph nodes or analog macrophages in the spleen. Donor EVs were transported across the SCS macrophages, and donor MHC molecules on the EVs were recognized by alloreactive B cells. This triggered B cell activation and DSA production, which were both prevented by SCS macrophage depletion. These results reveal an unexpected role for graft-derived EVs and open venues to interfere with EV biogenesis, trafficking, or function to restrain priming or reactivation of alloreactive B cells.


Figures

Fig. 1.
Fig. 1.. Migration of donor APCs and sensitization against donor MHC antigen.
(A) Flow cytometry analysis in graft-dLNs of DCs mobilized from CD11c-YFP skin allografts. (B) Detection by flow cytometry of donor DCs in graft-dLNs after transplantation of CD11-YFP skin in syngeneic (CD45.1 congenic) recipients. Right contour plots: Donor YFP DCs mobilized from the graft epidermis (CD326Pos) and dermis (CD326Neg CD103Pos). (C) Quantification by flow cytometry of donor DCs in graft-dLNs after transplantation of CD11c-YFP skin in syngeneic (syn) or allogenic (allo) recipients treated or not with FK506 (FK). ND, not detected. Numbers above bars indicate numbers of donor DCs. (D and E) Kaplan-Meier analysis of survival of CCR7KO and wt B6 skin (D) or heart (E) allografts in wt BALB/c mice. Numbers of recipients are in parentheses. (F and G) ELISpot analysis on POD 7 of the T cell response against donor intact MHC molecules (direct pathway) in graft-dLNs of BALB/c mice transplanted with wt or CCR7KO skin allografts (F) or in spleens of BALB/c mice grafted with wt or CCR7KO cardiac allografts (G). IFN-γ, interferon-γ. (H and I) Titer of DSAs analyzed by flow cytometry in serum of BALB/c mice before surgery and on successive PODs after transplantation of wt or CCR7KO skin (H) or heart (I) allografts. In (A) and (B), numbers in dot or contour plots are cell percentages. (A to C) Six mice per group. In (F) to (I), each dot represents a recipient. Results in (F) to (I) were analyzed by one-way ANOVA, followed by Tukey-Kramer multiple comparison test. Error bars denote means ± SD. NS, not significant. **P < 0.01 and ***P < 0.001.
Fig. 2.
Fig. 2.. Donor passenger leukocytes are retained within allografts.
(A) Planimetric view of donor Langerhans cells on epidermis of skin allografts and quantification on successive PODs. Images representative of six grafts per variable. Magnification, ×100. (B) Horizontal view of donor DCs (red) in dermal laminas of skin allografts. On POD 1, donor DCs accumulated inside lymphatics (arrows, inset). Images are representative of four grafts per group. Quantification by flow cytometry of donor DCs in dermal cell suspensions of skin allografts. Three to six grafts per group. Magnification, ×200 and ×400. (C) Vertical section of a skin allograft (POD 3) showing a dermal lymphatic vessel (blue) clogged with donor cells (green), with dendritic morphology, some coexpressing CD326 (inset). Dotted line indicates epidermal-dermal junction. Image representative of four allografts. X200, X400. EpCAM, Epithelial Cell Adhesion Molecule. (D) ImageStream of recipient DCs and B cells from LNs draining skin allografts on POD 2 cross-dressed with donor H2Kb and H2Db. Magnification, ×60; 20,000 cells. (E) Quantification by ImageStream in graft-dLNs of recipient DCs and B cells cross-dressed with donor H2Kb and H2Db after transplantation of allogeneic or syngeneic skin set as background (BKGD) staining. Each dot represents a recipient. (F) IEM images of recipient DCs and B cells, FACS-sorted from graft-dLNs on POD 2, cross-dressed with EVs carrying donor-derived H2Kb/IAb and CD63 (inset). N, nucleus. Magnification, ×2,500 to 10,000. Representative images of 60 to 80 immunogold-labeled cells. In (A), (B), and (F), results were analyzed by one-way ANOVA, followed by Tukey-Kramer multiple comparison test. Error bars represent means ± SD. **P < 0.01, ***P < 0.001, and ****P < 0.0001.
Fig. 3.
Fig. 3.. GILs do not transport donor intact MHC antigen to graft-dSLTs.
(A) CMV-Cre X ROSA26-loxP-stop-loxP-KikGR F1 mice expressing KikGR-green in ≥99% of PBMCs, measured by flow cytometry, were used as recipients. (B) Flow cytometry analysis (POD 3) of photoconversion of KikGR-green into KikGR-red in GILs within BALB/c skin grafts transplanted in B6 KikGR mice. Grafts were left untreated or exposed to violet light on PODs 1 and 2. One representative of six grafts per variable. (C) Quantification by flow cytometry of photoconverted leukocytes in LNs draining skin allografts left untreated or exposed to violet light on PODs 1 and 2 for POD 3 analysis, or PODs 1 to 6 for POD 7 analysis. Each dot corresponds to graft-dLNs from individual recipients. (D) Flow cytometry analysis on PODs 3 and 7 of donor MHC cross-dressing on photoconverted GILs and nonphotoconverted leukocytes in graft-dLNs. Donor MHC cross-dressing was detected on nonphotoconverted leukocytes (KikGR-redNeg cells within the red gates). Dot plots correspond to one set of graft-dLNs representative of six for POD 3 and seven for POD 7. (E) Quantification by flow cytometry on PODs 3 and 7 of percentages of donor MHC cross-dressing on photoconverted and nonphotoconverted leukocytes in LNs draining skin allografts exposed to violet light on PODs 1 and 2 for POD 3 analysis or PODs 1 to 6 for POD 7 analysis. Each dot corresponds to graft-dLNs from different recipients. In (C) and (E), comparisons were performed using two-tailed Student’s t test. Error bars denote means ± SD. *P < 0.05, ***P < 0.001, and ****P < 0.0001.
Fig. 4.
Fig. 4.. Allografts shed donor alloantigen to dLNs via EVs.
(A) Detection of donor IAb in SCS macrophages (inset) in graft-dLN after transplantation of skin allografts. Images representative of six recipients. Magnification, ×200. (B) IEM image of SCS of graft-dLN containing EVs carrying donor H2Kb/IAb and CD63 (red arrows, inset). White arrow indicates CD169 expression by SCS macrophages. Diagram shows image interpretation. (C) SCS macrophages (CD169, white arrows) containing EVs bearing donor H2Kb/IAb and CD63 (red arrows, inset) within a system of interconnected vesicles or channels (asterisks). Magnification, x20,000 and x80,000. Size of donor EVs internalized by SCS macrophages. (D) Sequence of allogeneic EVs captured by SCS macrophages in a pLN. Numbers indicate minutes after injection. (E) Two-photon microscopy of allogeneic EVs captured by SCS and medullary macrophages in a pLN. Dotted line indicates cortex-medulla junction. (F) Uptake of footpad-injected EVs by leukocytes in draining pLNs as measured by flow cytometry. Horizontal dotted lines indicate ex vivo uptake of exogenous EVs by bystander CD45.1 leukocytes. (G) STED microscopy of allogeneic EVs crossing a system of interconnected vesicles or tunnels filled with lymph tracer (blue) within pLN SCS macrophages. Line indicates LN capsule. (H) Sequence by STED microscopy in a pLN of transport across an SCS macrophage of allogeneic CM-Dil-EVs (inset). Arrows indicate directional passage of CM-DilPos material. One representative of two pLNs. (A to E) Images representative of graft-dLNs from three to four recipients. In (D) to (H), an equivalent of 55 × 108 allogeneic EVs (87 ± 49 nm in size) in 30 μl of PBS was injected per footpad. In (F), results were analyzed by one-way ANOVA, followed by Tukey-Kramer multiple comparison test. Error bars denote means ± SD. **P < 0.01, ***P < 0.001, and ****P < 0.0001.
Fig. 5.
Fig. 5.. B cells recognize allogeneic EVs on SCS macrophages.
(A) Image of a pLN showing tracks of alloreactive B cells contacting SCS macrophages with allogeneic EVs. (B) Instant velocities of individual B cell tracks from (A). (C) Mean velocities and arrest coefficients of alloreactive B cells contacting SCS macrophages with allogeneic EVs. (D) Cell tracks of B cells in proximity to SCS macrophages with allogeneic EVs. (E) Parameter comparison by two-photon microscopy between alloreactive and control B cells in pLNs, after footpad injection of allogeneic EVs. (F) Sequence of calcium flux in an alloreactive B cells contacting SCS macrophages with allogeneic EVs in pLNs. (G) Mobilization of alloreactive B cells to the B cell–T cell border of pLNs, after footpad injection of allogeneic EVs. X200. (H) Sequence of passage of allogeneic EVs to alloreactive B cells in pLNs (arrow, inset). (I and J) Flow cytometry analysis (I) and quantification (J) in pLNs of binding of CM-DiI-EVs to intravenously (i.v.) injected alloreactive (CMAC) or control (CFSE) B cells or endogenous B cells. (K) Flow cytometry analysis in pLNs of CD86 by intravenously injected alloreactive B cells after footpad injection of allogeneic or syngeneic CM-DiI-EVs. In (A) to (K), an equivalent of 55 × 108 allogeneic EVs (85 ± 39 nm in size) or syngeneic EVs (109 ± 49 nm in size) in 30 μl of PBS was injected per footpad. (A to K) Results are representative of three to nine pLNs per condition. In (J) and (K), each dot represents a pLN. Results analyzed by two-tailed Student’s t test and one-way ANOVA, followed by Tukey-Kramer multiple comparison test. Error bars denote means ± SD. **P < 0.01, ***P < 0.001, and ****P < 0.0001.
Fig. 6.
Fig. 6.. Depletion of SCS macrophages decreases recognition of allogeneic EVs by B cells.
(A and B) Representative flow cytometry analysis (A) and quantification (B) in pLNs of binding of syngeneic and allogeneic EVs (CM-DiI–labeled, footpad-injected) by CMAC-labeled, intravenously injected alloreactive B cells in presence or absence of SCS macrophages. SCS macrophages were depleted by administration of low-dose clodronate liposomes via footpad injection. (C and D) Representative flow cytometry analysis (C) and quantification (D) in pLNs of CD86 expression by CMAC-labeled, intravenously injected alloreactive B cells in response to syngeneic or allogeneic EVs (CM-DiI–labeled, footpad-injected), in presence or absence of SCS macrophages. (E and F) Mobilization to the B cell–T cell border in pLNs of CFSE-labeled, intravenously injected alloreactive B cells after footpad injection of syngeneic or allogeneic EVs in presence of SCS macrophages or after depletion. B cell migration was assessed 20 hours after EV injection. Images representative of eight LNs per condition. (G) Detection by flow cytometry of DSAs in serum of mice before and on consecutive days after footpad injection of syngeneic or allogeneic EVs. Mice were left untreated or injected once with control or low-dose clodronate liposomes (footpad and intravenous) 5 days before EV injection. Dots represent individual mice. In (B), (D), and (F), each dot represents pLNs pooled from one mouse. In (A) to (G), an equivalent of 55 × 108 EVs (85 ± 39 nm in size) or syngeneic EVs (109 ± 49 nm in size) in 30 μl of PBS was injected per footpad. Results were analyzed by one-way ANOVA, followed by Tukey-Kramer multiple comparison test. Error bars denote means ± SD. **P < 0.01 and ***P < 0.001.
Fig. 7.
Fig. 7.. Effect of inhibition of small EVs biogenesis on donor MHC cross-dressing, allograft survival, and serum DSA concentrations.
(A) Kaplan-Meier analysis of survival of B6 cardiac allografts in mice treated short or long term via intraperitoneal (i.p.) injection of GW4869 or vehicle (DMSO). Number of recipients and graft survival days are in parenthesis. (B) Representative analysis by ImageStream of recipient splenic APCs cross-dressed with donor H2Kb and H2Db, 2 days after transplantation of B6 CD45.1 cardiac allografts. CD63 colocalized in areas containing H2Kb H2Db. Magnification, X60, 40,000 cells. (C) Assessment by ImageStream of recipient total leukocytes and APCs cross-dressed with donor H2Kb and H2Db in splenocytes of BALB/c mice grafted with B6 CD45.1 hearts and treated with GW4869 or vehicle. Splenocytes of naïve BALB/c mice were included to set background (BKGD) staining (dotted lines). Each dot represents a mouse or graft recipient. No Tx, no transplant. (D) Flow cytometry analysis of division (CFSE dilution) and activation (CD44High) of CFSE-labeled T cell receptor transgenic 4C CD4 T cells, specific for IAd, in response to ex vivo stimulation with recipient (YFPPos) DCs FACS-sorted from spleens of CD11c-YFP B6 mice untreated (negative control) or grafted 3 days prior with BALB/c (H2d) hearts and treated with GW4869 or DMSO. Plots are representative of four transplants per group. (E) Effect of administration GW4869 or DMSO on DSA titers in serum of BALB/c mice grafted with B6 hearts. Each dot represents a mouse. Results in (C) and (E) were analyzed by one-way ANOVA, followed by Tukey-Kramer multiple comparison test. Error bars denote means ± SD. *P < 0.05, **P < 0.01, ***P < 0.001, and ****P < 0.0001.
Fig. 8.
Fig. 8.. Human grafts release EVs captured by human SCS macrophages in graft-dLNs.
(A) Dot plots indicate percentages of human leukocyte chimerism in huMice (spleen) analyzed by flow cytometry. (B) Detection by microscopy of donor HLA-A2 in human SCS CD169 macrophages (insets) in LNs of HLA-A2Neg huMice draining human HLA-A2Pos skin grafts on POD 3. X200, X400. Images representative of six recipients. (C) IEM images of ultrathin cryosections of LNs of HLA-A2Neg huMice, draining human HLA-A2 skin grafts isolated on POD 3 depicting donor (HLA-A2Pos) EVs (red arrows, insets) in the SCS, next to, or internalized by SCS macrophages of human origin (white arrows indicate human CD169 expression). Images representative of four graft-dLNs. h, human. Magnification, X80,000, X200,000. (D) ImageStream of recipient human APCs cross-dressed with donor HLA-A2 from LNs of HLA-A2Neg huMice draining HLA-A2 human skin grafts isolated on POD 3. X60, 40,000 cells. (E) ImageStream quantification of human APCs cross-dressed with donor HLA-A2 in HLA-A2Neg huMice transplanted with HLA-A2Pos or HLA-A2Neg (control) human skin. Irrel, irrelevant. Each dot represents a LN from a different huMice. Results in (A) and (E) were analyzed by two-tailed Student’s t test and one-way ANOVA, followed by Tukey-Kramer multiple comparison test, respectively. Error bars denote means ± SD. **P < 0.01.

References

    1. Loupy A, Lefaucheur C, Antibody-mediated rejection of solid-organ allografts. N. Engl. J.Med 379, 1150–1160 (2018). - PubMed
    1. Valenzuela NM, Reed EF, Antibody-mediated rejection across solid organ transplants: Manifestations, mechanisms, and therapies. J. Clin. Invest 127, 2492–2504 (2017). - PMC - PubMed
    1. Zeng Q, Ng YH, Singh T, Jiang K, Sheriff KA, Ippolito R, Zahalka S, Li Q, Randhawa P, Hoffman RA, Ramaswami B, Lund FE, Chalasani G, B cells mediate chronic allograft rejection independently of antibody production. J. Clin. Invest 124, 1052–1056 (2014). - PMC - PubMed
    1. Worthington JE, Martin S, Al-Husseini DM, Dyer PA, Johnson RWG, Posttransplantation production of donor HLA-specific antibodies as a predictor of renal transplant outcome. Transplantation 75, 1034–1040 (2003). - PubMed
    1. Hourmant M, Cesbron-Gautier A, Terasaki PI, Mizutani K, Moreau A, Meurette A, Dantal J, Giral M, Blancho G, Cantarovich D, Karam G, Follea G, Soulillou JP, Bignon JD, Frequency and clinical implications of development of donor-specific and non-donor-specific HLA antibodies after kidney transplantation. J. Am. Soc. Nephrol 16, 2804–2812 (2005). - PubMed

Publication types