. 2021 Mar 17;13(585):eaaz0316.
doi: 10.1126/scitranslmed.aaz0316.

RNA-seq of human T cells after hematopoietic stem cell transplantation identifies Linc00402 as a regulator of T cell alloimmunity

Affiliations

RNA-seq of human T cells after hematopoietic stem cell transplantation identifies Linc00402 as a regulator of T cell alloimmunity

Daniel Peltier et al. Sci Transl Med. .

Abstract

Mechanisms governing allogeneic T cell responses after solid organ and allogeneic hematopoietic stem cell transplantation (HSCT) are incompletely understood. To identify lncRNAs that regulate human donor T cells after clinical HSCT, we performed RNA sequencing on T cells from healthy individuals and donor T cells from three different groups of HSCT recipients that differed in their degree of major histocompatibility complex (MHC) mismatch. We found that lncRNA differential expression was greatest in T cells after MHC-mismatched HSCT relative to T cells after either MHC-matched or autologous HSCT. Differential expression was validated in an independent patient cohort and in mixed lymphocyte reactions using ex vivo healthy human T cells. We identified Linc00402, an uncharacterized lncRNA, among the lncRNAs differentially expressed between the mismatched unrelated and matched unrelated donor T cells. We found that Linc00402 was conserved and exhibited an 88-fold increase in human T cells relative to all other samples in the FANTOM5 database. Linc00402 was also increased in donor T cells from patients who underwent allogeneic cardiac transplantation and in murine T cells. Linc00402 was reduced in patients who subsequently developed acute graft-versus-host disease. Linc00402 enhanced the activity of ERK1 and ERK2, increased FOS nuclear accumulation, and augmented expression of interleukin-2 and Egr-1 after T cell receptor engagement. Functionally, Linc00402 augmented the T cell proliferative response to an allogeneic stimulus but not to a nominal ovalbumin peptide antigen or polyclonal anti-CD3/CD28 stimulus. Thus, our studies identified Linc00402 as a regulator of allogeneic T cell function.


Conflict of interest statement

Competing Interests

A.R. is member of Voxel Analytics, LLC. The remaining authors declare that the research was conducted in the absence of any commercial or financial relationships that could be construed as a potential conflict of interest.

Figures
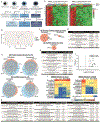
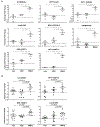
Figure 1:
Figure 1:. RNA-seq analysis after HSCT identifies differentially expressed lncRNAs in human allogeneic T cells.
Total RNA sequencing was performed on healthy control CD3+ cells or CD3+ cells 30 days after either autologous (Auto), MUD, or MMUD HSCT. (A) Experimental and analysis schema. (B) Principal component analysis. (C) Differentially expressed (padj < 0.1) protein-encoding (top) and lncRNA-encoding (bottom) genes relative to healthy controls. (D) The top 10 enriched gene ontology (GO) terms for the differentially expressed (padj < 0.05) protein-encoding genes in the autologous (Auto), MUD, and MMUD groups relative to healthy controls. A full list of enriched GO terms is shown in tables S4 – S6. (E) Hierarchical clustering heatmaps of differentially expressed genes (padj < 0.05) identified by comparing MMUD and Auto groups and MMUD and MUD groups. Only the groups that underwent HSCT are shown. (F) Differentially expressed protein-coding (top) and lncRNA-coding (bottom) genes (padj < 0.1) relative to Auto are shown. (G, H) Enriched GO terms for differentially expressed protein-encoding genes (padj < 0.05) in the MMUD group relative to the Auto (G) and MUD groups (H). A full list of enriched GO terms is shown in tables S9 and S10. (I) Volcano plot of differentially expressed (padj < 0.1) lncRNAs in the MMUD group relative to either Auto or MUD controls. (J) Heat maps showing FPKMs for differentially expressed lncRNAs (padj < 0.1) in the MMUD group with Auto or MUD HSCT recipients are shown. Underlined lncRNAs were differentially expressed relative to both Auto and MUD HSCT recipients.
Figure 2:
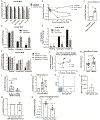
Figure 2:. Expression of lncRNAs in the RNA-seq patient cohort and their validation in an independent patient cohort.
A. qRT-PCR was performed on total RNA derived from CD3+ peripheral blood T cells from the RNA-seq patient cohort (Table 1) and the expression of the indicated transcripts was measured relative to β-actin. B. qRT-PCR was performed on cryogenically preserved CD3+ peripheral blood T cells from the independent validation patient cohort (Table 2). Relative expression of the indicated transcripts is shown relative to β-actin. Values are mean +/− SEM. *p < 0.05. p-values were calculated using original FDR method of Benjamini and Hochberg following a one-way ANOVA in which p < 0.1 (See tables S15 and S16 for details).
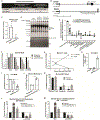
Figure 3:
Figure 3:. Linc00402 expression is enriched in human T cells and is present in both the nucleus and cytoplasm.
(A) LncRNA fold enrichment in human T cells was queried using the publicly available FANTOM CAT database. (B) The protein-encoding potential of the indicated lncRNAs was queried using multiple in silico algorithms using the publicly available database FANTOM CAT. (C) qRT-PCR for the indicated transcripts was performed on cytosolic and nuclear fractions from naïve or activated (anti-CD3/CD28) T cells from healthy donors. β-actin and snRNA U2 were included as positive cytosolic and nuclear controls, respectively (n = 2 – 4 per group from 2 – 4 independent trials, *p < 0.05,two-tailed t-test). (D) Representative pseudocolored image of a human T cell RNA-FISH stained with DAPI (blue), probes against GAPDH mRNA (green), and probes against Linc00402 lncRNA (red). Nuclear (cyan) and cell (magenta) boundaries are also represented. Scale bar, 2 μm. (E-F) Box plots of RNA-FISH spots/cell and percent nuclear localization per cell. The central line, box edges and bars represent the median, 25th and 75th quartiles, and data range, respectively Data are representative of at least 100 cells from 2 independent biologic replicates with N=2 technical replicates from each biologic replicate. (G) qRT-PCR analysis comparing the expression of the indicated lncRNA in CD4+CD8 versus CD4CD8+ enriched T cells from healthy donors (*p < 0.05,two-tailed t-test). (H) FANTOM CAT expression of Linc00402 for the indicated T-cell subsets (*p < 0.05,two-tailed t-test).
Figure 4:
Figure 4:. Linc00402 is differentially expressed in ex vivo allostimulated human T cells and expression is affected by tacrolimus-mediated inhibition of T cell activation.
(A) Human T cells were incubated with irradiated (30 Gy) autologous or allogeneic monocytes for 6 days or anti-CD3/CD28 DynaBeads for 2 days. The T cells were then re-isolated with negative magnetic selection and subject to qRT-PCR (*p < 0.05, one-way ANOVA with original FDR method of Benjamini and Hochberg, n = 3 – 6 independent trials per group). B. Human T cells from healthy donors were activated with anti-CD3/CD28 DynaBeads for the indicated times and then the expression of the indicated transcripts was assessed by qRT-PCR ( n = 2 – 4 independent trials per group). Values are mean +/− SEM. C-D. Human T cells were pre-incubated with tacrolimus (30 ng/mL) or placebo for 1 hour prior to mixing them with irradiated (30 Gy) autologous or allogeneic monocytes or placebo. Seven days later, T cells were negatively magnetically isolated and subjected to qRT-PCR analysis of Linc00402 with fold changes set relative to autologous placebo-treated controls (n = 2 – 3 independent trials per condition, *p < 0.05, one-sample t-test). E. Proliferation was assessed by uptake of tritiated thymidine relative to autologous placebo control uptake (n = 3 independent trials per condition; values are mean +/− SEM). F. Human T cells were pre-incubated with the indicated concentrations of rapamycin or DMSO for 1 hour prior to mixing them with irradiated autologous or allogeneic monocytes or PBS. Seven days later, T cells were negatively magnetically isolated and subjected to qRT-PCR analysis of Linc00402 with fold changes set relative to autologous DMSO-treated controls. (n = 3 independent trials per condition; values are mean +/− SEM). G. The correlation between Linc00402 abundance (log2 fold change from autologous controls) in MUD and MMUD HSCT recipient T cells and their day plus 30 tacrolimus trough concentration (p-value calculated using simple linear regression). H. Average day +30 tacrolimus trough concentrations from MUD and MMUD HSCT recipients (values are mean +/− SEM; two-tailed t-test). I. Average day +30 Linc00402 abundance (fold change from autologous controls) in T cells from MUD and MMUD HSCT recipients who did or did not develop grade II-IV GVHD within 3 weeks of their day +30 Linc00402 measurement (Welch’s t-test). J. CD3+ T cells from a third cohort of age- and sex-matched patients approximately 30 days post HSCT (table S19) were subjected to qRT-PCR analysis for the fold change of Linc00402 relative to matched autologous HSCT control patients (* p<0.05, ANOVA with Tukey’s multiple comparisons test). K. A representative fluorescence activated cell sorting (FACS) plot (gated on live CD8+CD4 cells) shows CMV-specific and non-specific cytotoxic T cell fractions. L. The absolute number of sorted CMV-specific CTLs (pp65 dextramer+ Live CD8+ CD4) is shown for the four patients described in table S20 (values are mean +/− SEM). M. qRT-PCR analysis measuring the fold change of Linc00402 in CMV-specific and non-specific CTL fractions (values are mean +/− SEM). N. Linc00402 fold change assessed via qRT-PCR in CD3+ T cells isolated from peripheral blood from patients awaiting cardiac transplantation or patients 4 weeks post-cardiac transplantation (values are mean +/− SEM; Welch’s t-test).
Figure 5:
Figure 5:. Linc00402 is differentially expressed in murine T cells.
(A) LncRNA conservation was queried using the FANTCOM-CAT database. B. Depiction of the Linc00402 loci on chromosome 13 (chr13) in human and 14 (chr14) in mouse. Downward arrows indicate the approximate primer positions used to detect mouse Linc00402 in panel C. C. qRT-PCR was performed on murine T cells using primers for regions predicted by the Ensembl genome browser and Transmap as orthologous to the indicated human lncRNA exonic region. Data depict the subtraction of qRT-PCR threshold cycles from threshold cycles obtained from negative reverse transcriptase controls (*p < 0.05, two-tailed t-test, data are representative of 2 – 4 independent trials per group). D. Ten μg of total RNA from resting mouse T cells or mouse T cells stimulated for 48 hours with anti-CD3/CD28 Dynabeads was analyzed by northern blot using probes specific for murine Linc00402 and mRNA encoding β-actin. Total RNA from HeLa cells was used as a negative control. Triplicate biologic replicates are shown. The arrow points to a 2.5 kb band that is similar in size to human Linc00402, absent in HeLa cells, and decreases in mouse T cells following anti-CD3/CD28 stimulation. E. The relative abundance of Linc00402 compared to non-template controls was assessed in C57BL/6 primary cells (DC: dendritic cell, LSK: Lin Sca-I+ c-Kit+ bone marrow cells, *p <0.05,two-tailed one sample t-test with a null hypothesis of 0; 2 – 7 independent trials were performed per group). F.C57BL/6 splenic T cells were incubated with irradiated (30 Gy) syngeneic or allogeneic (BALB/c) splenocytes or anti-CD3/CD28 Dynabeads. T cells were then re-isolated and subjected to qRT-PCR (*p < 0.05, one-way ANOVA, original FDR method of Benjamini and Hochberg, data are representative of 2–7 independent trials per group). G. Mouse T cells were activated with anti-CD3/CD28 Dynabeads for the indicated times and then the expression of the indicated transcripts was assessed by qRT-PCR (data are representative of 2 – 4 independent trials per group, error bars represent the mean +/− the SEM). H. The proliferation (measured as H3 thymidine incorporation) of OT-I T cells following mock stimulation or stimulation with placebo or SIINFEKL-pulsed dendritic cells for 48 hours is shown (*p <0.05 via a one-way ANOVA with Tukey’s multiple comparison test, values are mean +/− SEM, data are from 3 independent trials). I. Linc00402 fold change (relative to resting T cells) from OT-I T cells harvested following the incubation described in H are shown (*p < 0.05, ratio paired t-test, values are mean +/− SEM, data are from 3 independent trials). J and K. Mouse T cells were pre-incubated with tacrolimus (90 ng/mL) or placebo for 1 hour prior to mixing them with irradiated (30 Gy) syngeneic or allogeneic splenic monocytes or placebo. Seven days later, T cells were negatively magnetically isolated and subjected to qRT-PCR analysis of Linc00402 with fold changes set relative to syngeneic placebo-treated controls (data are from 3 independent trials per condition, *p<0.05 using a two-tailed t-test). L and M. The differential expression of selected transcripts from allogeneic splenic donor T cells was assessed by qRT-PCR on days +7 and +14 from mHA-disparate (L) and multiple miHA-disparate (M) recipients (*p < 0.05, one-way ANOVA, original FDR method of Benjamini and Hochberg, data are from 3–4 independent trials per group). Values are mean +/− SEM.
Figure 6:
Figure 6:. Linc00402 augments an ERK/FOS pathway following TCR stimulation and promotes allogeneic T-cell proliferation.
(A, B) Human or mouse T cells were incubated with the indicated GapmeRs (see figures S12D and S12E). MLRs were then performed as described in Figures 4 and 5, respectively. T cell proliferation was then assessed by tritiated thymidine incorporation (*p < 0.05, one-way ANOVA with original FDR method of Benjamini and Hochberg, data are from 3 – 7 independent trials per group). Error bars represent the mean +/− the SEM. C. Transcript abundance for Linc00402, RP11-348F1.3, and KLF12 was assessed by qRT-PCR in human T cells 72 hours after electroporation of Linc00402-targeting or non-targeting control CRISPR-Cas9 RNPs (*p < 0.05, 2-way ANOVA with Sidak’s multiple comparison test, data are from 3 – 4 independent trials per group). Values are mean +/− the SEM. D. Human T cells were electroporated with non-targeting control or Linc00402-targeting CRISPR-Cas9 RNPs and then stimulated with Dynabeads or the indicated concentrations of soluble anti-CD3/CD28 antibodies for 48 hours. Alternatively, electroporated cells were stimulated with irradiated autologous or allogeneic monocytes and incubated for 14 days. Proliferation was measured by tritiated thymidine incorporation (*p < 0.05, one-way ANOVA and original FDR method of Benjamini and Hochberg, data are from 2 – 3 independent trials per group). Values are mean +/− SEM. E. OT-I cells were transduced with vector control or human Linc000402-overexpression lentiviruses. Transduced sorted OT-I T cells were then rested for 3 – 4 days followed by incubation alone, with negative control dendritic cells, or with SIINFEKL-presenting dendritic cells for 48 hours. Proliferation was measured by tritiated thymidine uptake (data are from 2 independent experiments with 3 biologic replicates in total; error bars show the mean +/− SEM). F-H. Stable, polyclonal vector control or Linc00402-overexpressing Jurkat cells were stimulated with 1 μg/mL of anti-CD3/CD28 antibodies for the indicated times after which IL2 mRNA change was measured by qRT-PCR and presented as fold change over unstimulated vector control (F), secreted IL-2 was measured by ELISA (G), and percent of cells positive for CD25 was determined by flow cytometry (H) (*p < 0.05, paired t-test for F and G and a 2-way ANOVA with Tukey’s multiple comparison test for H, values are mean +/− SEM, data are from 3 independent trials). I-K. Stable, polyclonal vector control or Linc00402-overexpressing Jurkat cells were either unstimulated or stimulated with α-CD3/CD28 (1 μg/mL) for 30 (I) or 15 minutes (J and K). The cells were then stained for activated ERK1/2 (phosphorylation of T202/Y204) (I), p38 (phosphorylation ofT180/Y182) (J), or p65 NF-κB (phosphorylation of S529) (K) (*p < 0.05 using a t-test, error bars show the mean +/− the SEM, data are from 2 – 3 independent trials). L and M. Abundance of FOS (L) and EGR1 (M) mRNA in stable, polyclonal vector control or Linc00402-overexpressing Jurkat cells was measured by qRT-PCR (*p < 0.05, paired t-test, values are mean +/− SEM, data are from 3 independent trials). N, O. Stable, polyclonal vector control or Linc00402-overexpressing Jurkat cells were either unstimulated or stimulated with α-CD3/CD28 (1 μg/mL) for the times indicated followed by isolation of nuclear lysates. Western blots were then performed, and the abundance of FOS, JUN, and NFAT1 was quantified. (*p < 0.05, one-sample t-test. Values are mean +/− SEM, data are from 3 – 6 independent trials per group).

Similar articles

Cited by

References

    1. Atianand MK, Caffrey DR, Fitzgerald KA, Immunobiology of Long Noncoding RNAs. Annual review of immunology 35, 177–198 (2017). - PMC - PubMed
    1. Ulitsky I, Bartel DP, lincRNAs: genomics, evolution, and mechanisms. Cell 154, 26–46 (2013). - PMC - PubMed
    1. Chen YG, Satpathy AT, Chang HY, Gene regulation in the immune system by long noncoding RNAs. Nature immunology 18, 962–972 (2017). - PMC - PubMed
    1. Kopp F, Mendell JT, Functional Classification and Experimental Dissection of Long Noncoding RNAs. Cell 172, 393–407 (2018). - PMC - PubMed
    1. Hu G, Tang Q, Sharma S, Yu F, Escobar TM, Muljo SA, Zhu J, Zhao K, Expression and regulation of intergenic long noncoding RNAs during T cell development and differentiation. Nature immunology 14, 1190–1198 (2013). - PMC - PubMed

Publication types

Substances