

Patterns and trends in causes of child and adolescent mortality 2000-2016: setting the scene for child health redesign
- PMID: 33731440
- PMCID: PMC7978083
- DOI: 10.1136/bmjgh-2020-004760
Patterns and trends in causes of child and adolescent mortality 2000-2016: setting the scene for child health redesign
Abstract
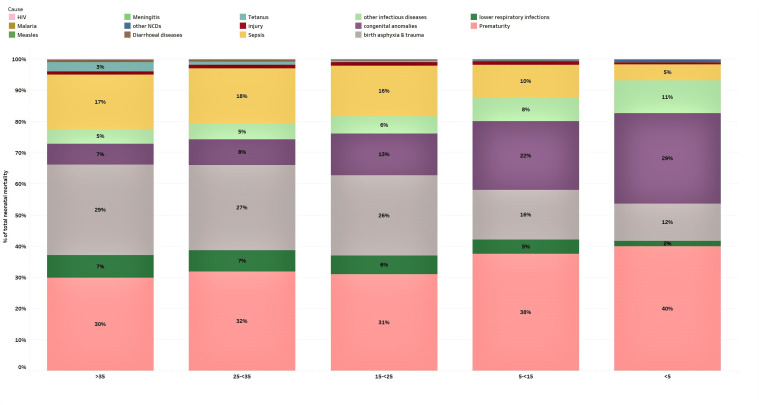
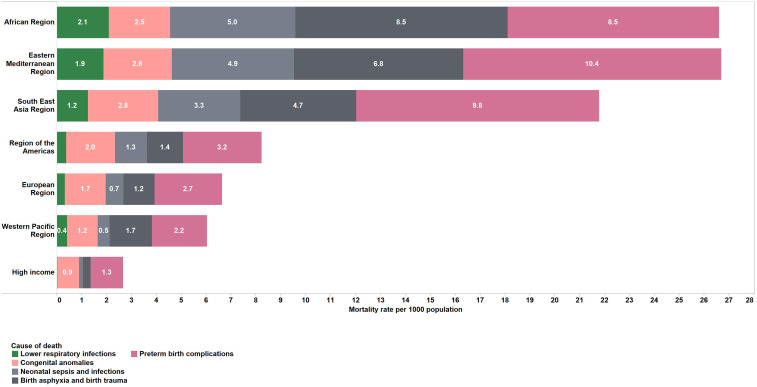
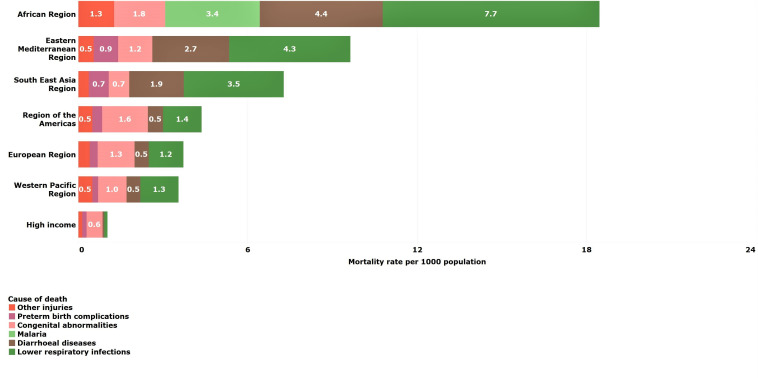
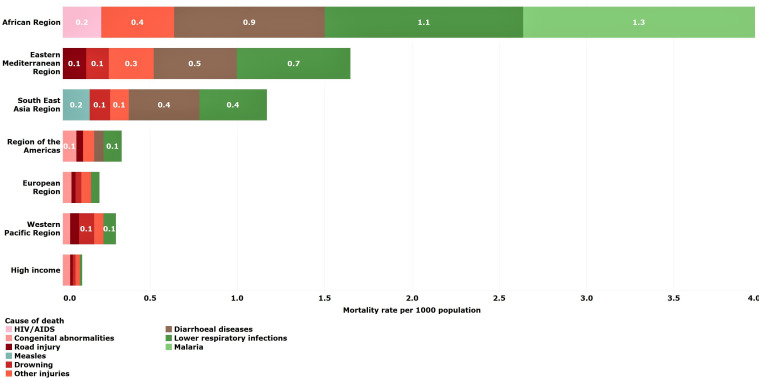
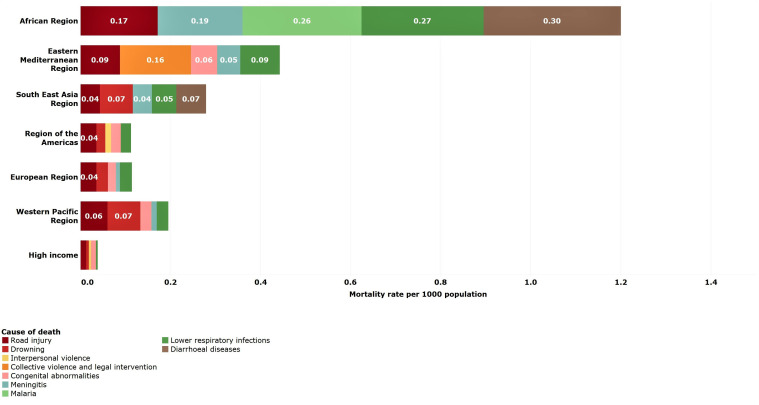
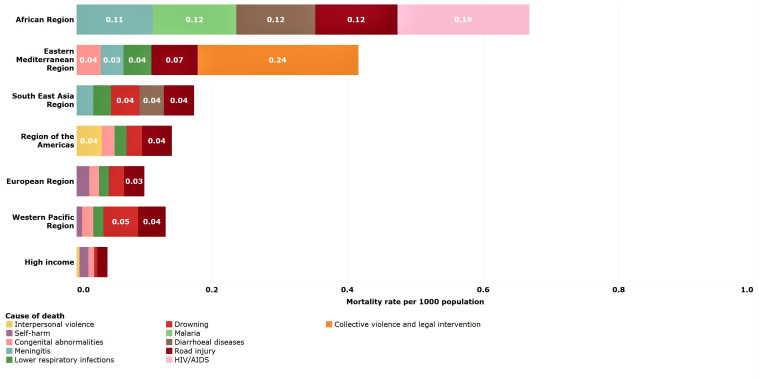
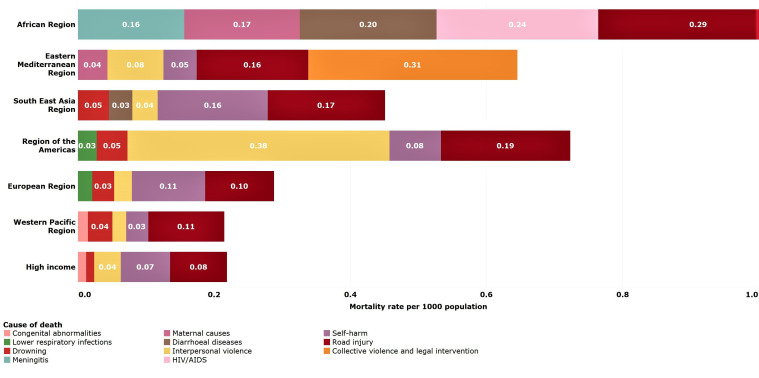
The under-5 mortality rate has declined from 93 deaths per 1000 live births in 1990 to 39 per 1000 live births in 2018. This improvement in child survival warrants an examination of age-specific trends and causes of death over time and across regions and an extension of the survival focus to older children and adolescents. We examine patterns and trends in mortality for neonates, postneonatal infants, young children, older children, young adolescents and older adolescents from 2000 to 2016. Levels and trends in causes of death for children and adolescents under 20 years of age are based on United Nations Inter-agency Group for Child Mortality Estimation for all-cause mortality, the Maternal and Child Epidemiology Estimation group for cause of death among children under-5 and WHO Global Health Estimates for 5-19 year-olds. From 2000 to 2016, the proportion of deaths in young children aged 1-4 years declined in most regions while neonatal deaths became over 25% of all deaths under 20 years in all regions and over 50% of all under-5 deaths in all regions except for sub-Saharan Africa which remains the region with the highest under-5 mortality in the world. Although these estimates have great variability at the country level, the overall regional patterns show that mortality in children under the age of 5 is increasingly concentrated in the neonatal period and in some regions, in older adolescents. The leading causes of disease for children under-5 remain preterm birth and infectious diseases, pneumonia, diarrhoea and malaria. For older children and adolescents, injuries become important causes of death as do interpersonal violence and self-harm. Causes of death vary by region.
Keywords: child health; epidemiology; public health.
© Author(s) (or their employer(s)) 2021. Re-use permitted under CC BY. Published by BMJ.
Conflict of interest statement
Competing interests: None declared.
Figures
References
-
- United Nations . Transforming our world: the 2030 agenda for sustainable development. New York: United Nations, 2015.
-
- WHO, UNICEF, UNFPA . Tracking progress towards universal coverage for women’s, children’s and adolescents’ health: the 2017 Report. Washington DC: WHO, UNICEF, UNFPA, 2017.
-
- UNICEF . Un Interagency group on child mortality estimation (UN-IGME). levels and trends in child mortality, report 2019. New York, USA, 2019.
-
- UNICEF . Un Interagency group on child mortality estimation. levels and trends in child mortality report 2019: estimates developed by the un Interagency group for child mortality estimation. NY, USA, 2020.
Publication types
MeSH terms
Grants and funding
LinkOut - more resources
Full Text Sources
Other Literature Sources
Medical