. 2021 May 5;41(18):4141-4157.
doi: 10.1523/JNEUROSCI.2124-20.2021. Epub 2021 Mar 17.

Mechanism of Pacemaker Activity in Zebrafish DC2/4 Dopaminergic Neurons

Affiliations

Mechanism of Pacemaker Activity in Zebrafish DC2/4 Dopaminergic Neurons

Vladimir A Ilin et al. J Neurosci. .

Abstract

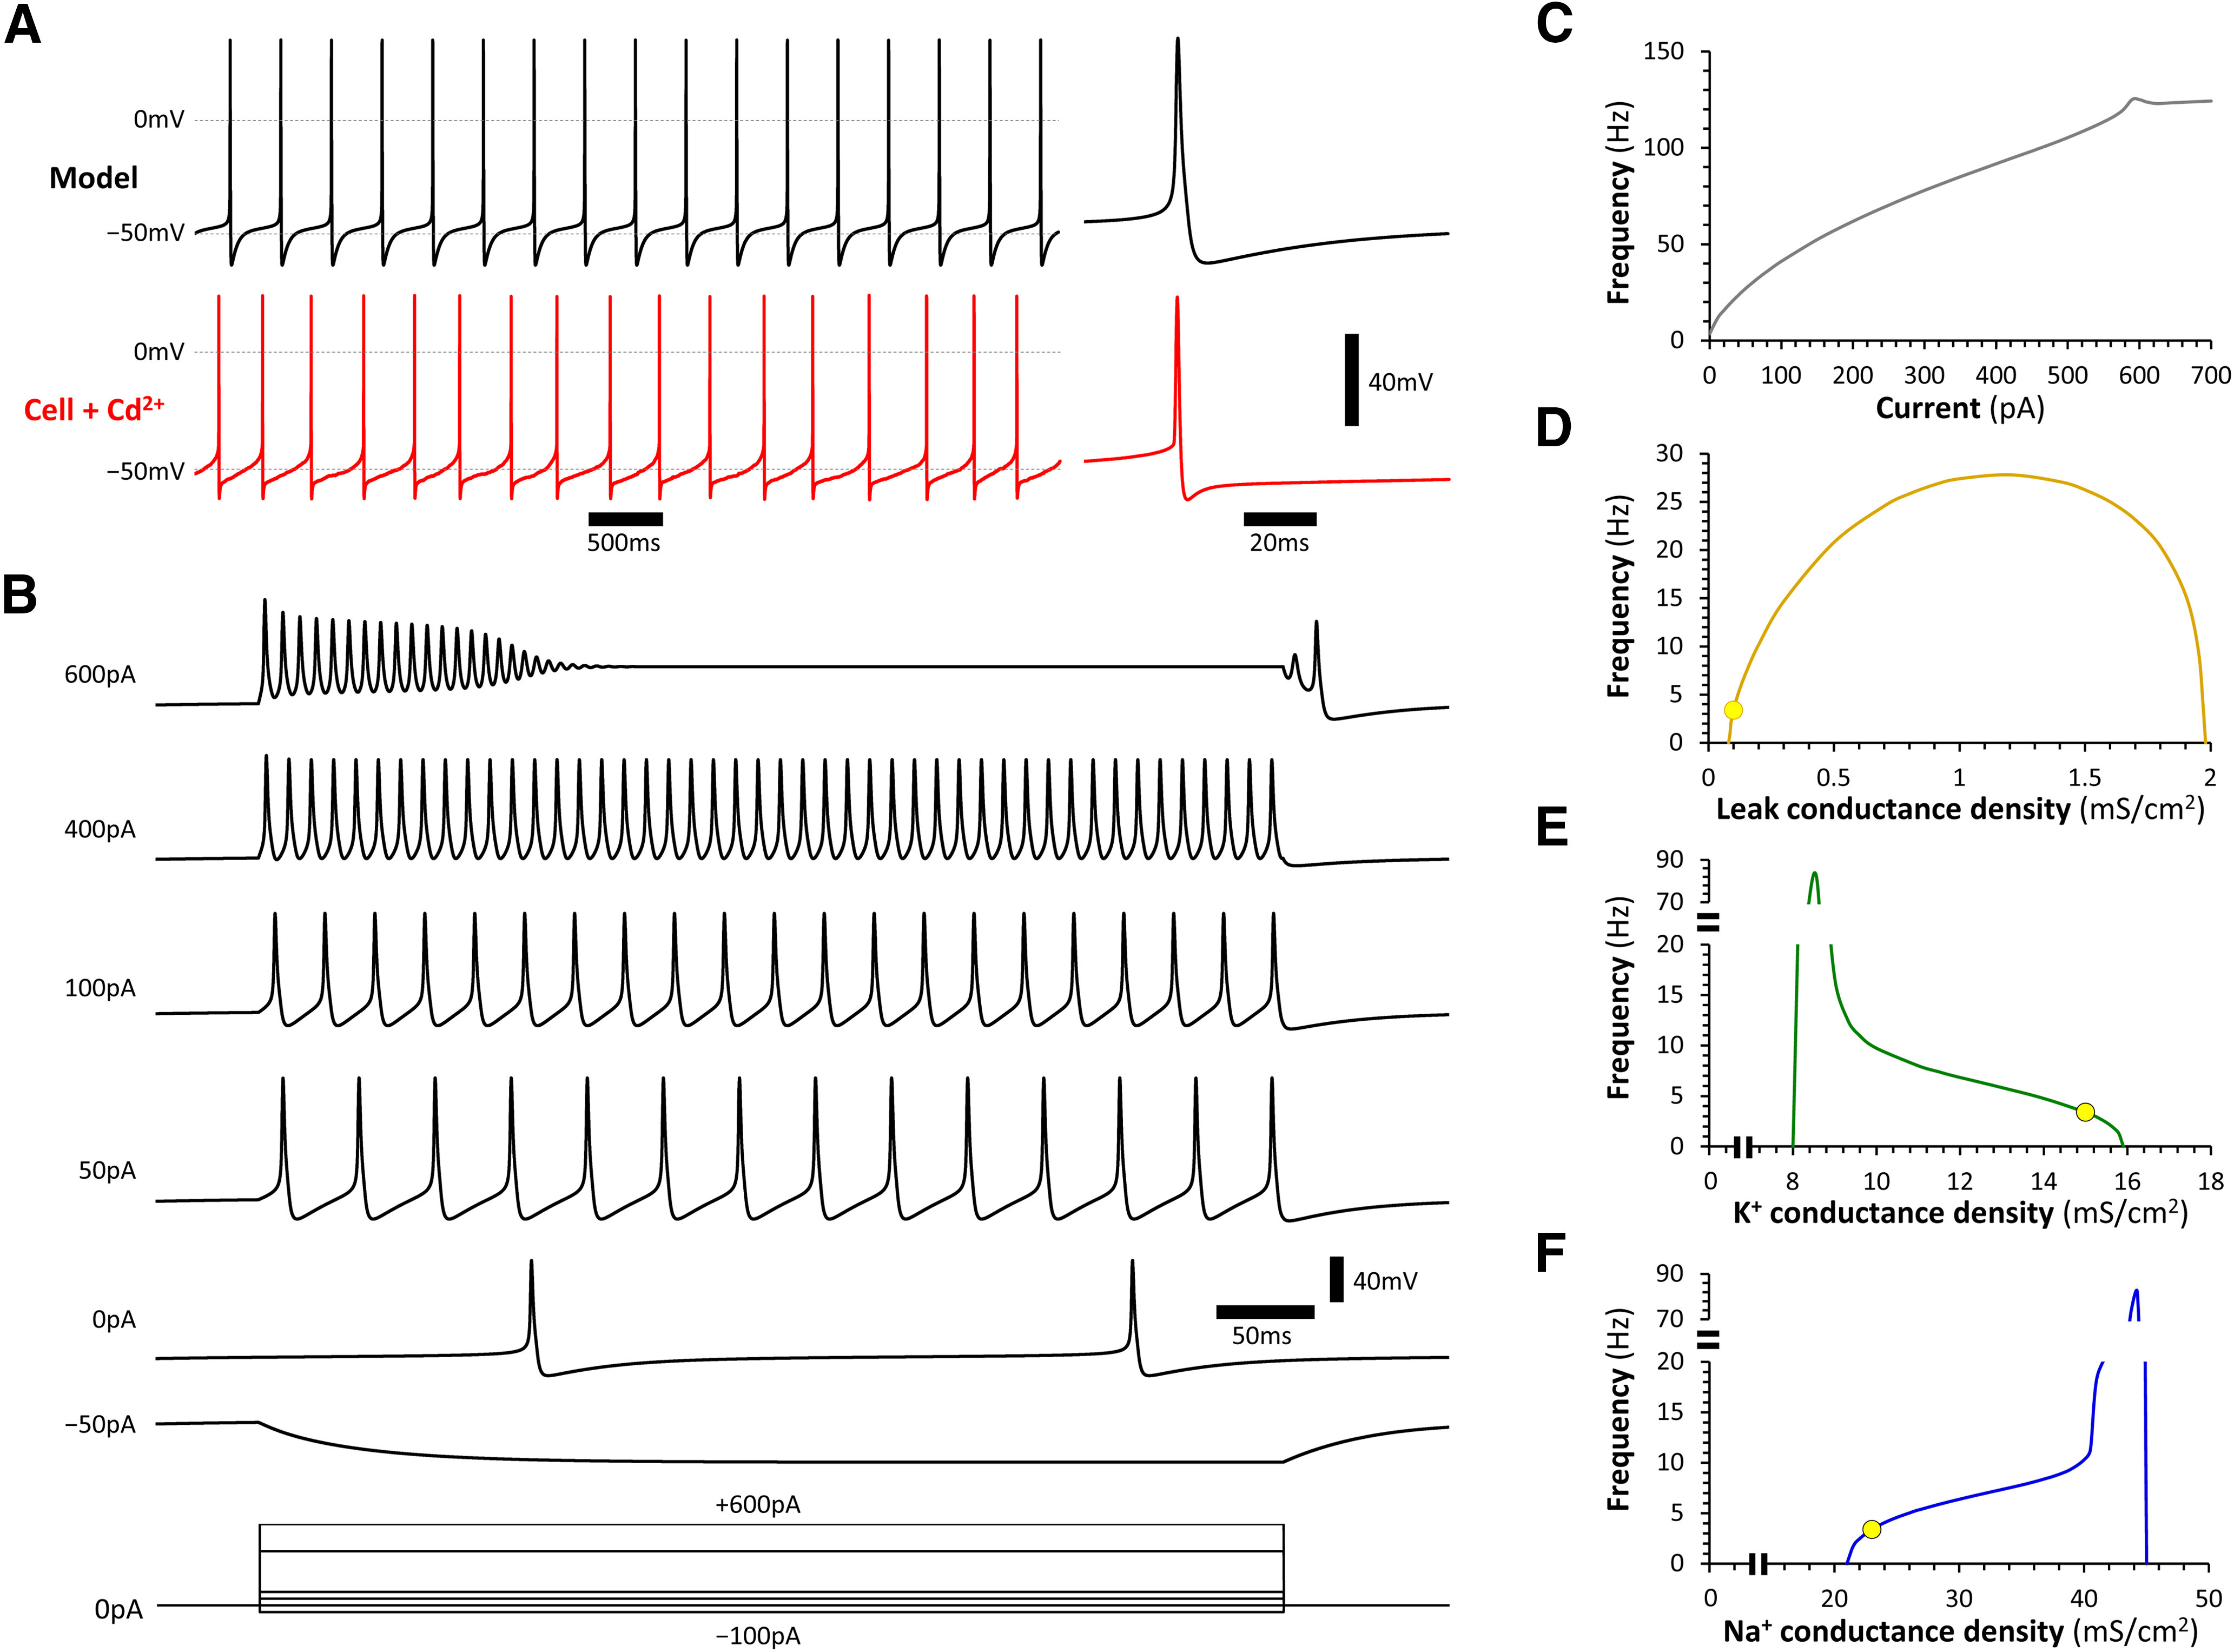
Zebrafish models are used increasingly to study the molecular pathogenesis of Parkinson's disease (PD), owing to the extensive array of techniques available for their experimental manipulation and analysis. The ascending dopaminergic projection from the posterior tuberculum (TPp; diencephalic populations DC2 and DC4) to the subpallium is considered the zebrafish correlate of the mammalian nigrostriatal projection, but little is known about the neurophysiology of zebrafish DC2/4 neurons. This is an important knowledge gap, because autonomous activity in mammalian substantia nigra (SNc) dopaminergic neurons contributes to their vulnerability in PD models. Using a new transgenic zebrafish line to label living dopaminergic neurons, and a novel brain slice preparation, we conducted whole-cell patch clamp recordings of DC2/4 neurons from adult zebrafish of both sexes. Zebrafish DC2/4 neurons share many physiological properties with mammalian dopaminergic neurons, including the cell-autonomous generation of action potentials. However, in contrast to mammalian dopaminergic neurons, the pacemaker driving intrinsic rhythmic activity in zebrafish DC2/4 neurons does not involve calcium conductances, hyperpolarization-activated cyclic nucleotide-gated (HCN) channels, or sodium leak currents. Instead, voltage clamp recordings and computational models show that interactions between three components - a small, predominantly potassium, leak conductance, voltage-gated sodium channels, and voltage-gated potassium channels - are sufficient for pacemaker activity in zebrafish DC2/4 neurons. These results contribute to understanding the comparative physiology of the dopaminergic system and provide a conceptual basis for interpreting data derived from zebrafish PD models. The findings further suggest new experimental opportunities to address the role of dopaminergic pacemaker activity in the pathogenesis of PD.SIGNIFICANCE STATEMENT Posterior tuberculum (TPp) DC2/4 dopaminergic neurons are considered the zebrafish correlate of mammalian substantia nigra (SNc) neurons, whose degeneration causes the motor signs of Parkinson's disease (PD). Our study shows that DC2/4 and SNc neurons share a number of electrophysiological properties, including depolarized membrane potential, high input resistance, and continual, cell-autonomous pacemaker activity, that strengthen the basis for the increasing use of zebrafish models to study the molecular pathogenesis of PD. The mechanisms driving pacemaker activity differ between DC2/4 and SNc neurons, providing: (1) experimental opportunities to dissociate the contributions of intrinsic activity and underlying pacemaker currents to pathogenesis; and (2) essential information for the design and interpretation of studies using zebrafish PD models.

Keywords: Parkinson's disease; computational; dopamine; electrophysiology; pacemaker; zebrafish.


Figures

Figure 1.
Figure 1.
Acute brain slice preparation from a novel transgenic line reveals robust pacemaker activity in zebrafish DC2/4 dopaminergic neurons. A, Confocal z-plane projection of an axial section from an adult Tg(th:gal4); Tg(UAS:egfp) zebrafish brain, labeled by immunofluorescence for TH (red) and GFP (green), with a nuclear counterlabel (DAPI; blue). The images show the TPp adjacent to the diencephalic ventricle (*). To the left, individual channels are shown separately for the boxed region in the main panel, illustrating the extensive colocalization between the GFP marker and endogenous TH. B, Zebrafish brains were embedded in low melting temperature agarose and 200-µm axial (transverse) sections were made. The planes (upper right) and appearances (lower) of the slices containing dopaminergic neurons are shown. The approximate locations of DC2 and DC4 neurons are indicated. C, Infrared DIC micrograph showing a dopaminergic neuron (white box) in an acute brain slice. The neuron is readily identified by its morphology and position adjacent to the diencephalic ventricle (*) and by its strong expression of the GFP transgene, visible by epifluorescence microscopy (inset). D, A subset of neurons was filled with biocytin during recording and imaged by confocal microscopy following incubation with Alexa Fluor 555-streptavidin. Example confocal z-plane projections illustrate the characteristic morphology of DC2 (left) and DC4 (right) dopaminergic neurons. E, Membrane potential traces showing sustained pacemaker activity in a dopaminergic neuron at times between 0 and 163 min after establishing a whole-cell patch clamp recording. F, The AP amplitude and interspike membrane potential (black traces, left axis), AP frequency (red) and coefficient of variation of the interspike intervals (blue; right axes) are shown over time for the cell from panel E.
Figure 2.
Figure 2.
Electrophysiological properties of zebrafish DC2/4 dopaminergic neurons. A, An averaged AP from a dopaminergic neuron is shown on the left; arrows indicate how amplitude and width at half amplitude were measured. Two consecutive APs are shown on the right. Arrows indicate how interspike membrane potential (ISMP; ①), AP threshold (②), AP peak (③) and AHP (④) were measured. B, Scatter plots showing values for each of these parameters from a sample of n = 130 DC2/4 neurons. Data points show values from individual neurons, lines and bars show mean ± SD. C–H, x/y scatter plots showing the relationship between: (C) cell diameter and membrane capacitance, (D) cell diameter and input resistance, (E) cell diameter and AP frequency, (F) AP frequency and coefficient of variation of the interspike interval, (G) AP frequency and membrane potential during interspike intervals, and (H) AP frequency and AHP. Data points show values from individual neurons (n = 130), lines were derived by linear regression (*p < 0.05, **p < 0.01, ***p < 0.001, ns, not significant).
Figure 3.
Figure 3.
The pacemaker in zebrafish DC2/4 dopaminergic neurons is voltage-dependent but does not involve HCN channels. A, Membrane potential/time traces showing the responses of a dopaminergic neuron to hyperpolarizing and depolarizing current steps between −200 and +800 pA, as indicated below. B, Relationship between the amplitude of depolarizing current steps and instantaneous frequency (reciprocal of the first interspike interval; blue) or mean frequency (black); markers show mean ± SE for n = 16 neurons. C, Relationship between the amplitude of injected hyperpolarizing current and membrane potential (markers show mean ± SE for n = 16 neurons). The best fit line (green) was derived by linear regression; its extrapolation to the y-axis was used to estimate resting membrane potential. D, E, Effect of ZD7288, an antagonist of HCN channels, on pacemaker activity in DC2/4 dopaminergic neurons. D, Example membrane potential traces of a neuron under control conditions (above; black) and after bath application of ZD7288 at a final concentration of 50 μm (below; red). E, Spontaneous discharge frequency of neurons under control conditions (black) and following application of 50 μm ZD7288 (red). Data points show individual neurons, bars shown mean ± SE (n = 12 neurons). ns, not significant. F, The membrane potential traces show the responses of the same cell shown in D to injection of a hyperpolarizing current step (−100 pA, timing is shown below the membrane potential trace) both under control conditions (black) and after application of ZD7288 (red).
Figure 4.
Figure 4.
Progressive loss of autonomous pacemaker activity in zebrafish DC2/4 dopaminergic neurons during blockade of voltage-gated sodium channels. A, Membrane potential traces from a dopaminergic neuron, showing spontaneous pacemaker activity without current injection, and responses to injection of hyperpolarizing and depolarizing current steps (−25, −50, and +80 pA), under control conditions (black) and during TTX wash-in (increasing red). The lower trace shows the timing and amplitude of the injected current. B, Traces of spontaneous APs from panel A, during control conditions and TTX wash-in, are superimposed. Insets show the boxed regions of the traces at a larger scale, to illustrate the effects of TTX on the slope and variability of the interspike membrane potential. C, The rate of membrane potential depolarization in the 20-ms window before onset of the AP [defined by (peak − 23 ms) to (peak − 3 ms)], under control conditions and during TTX wash-in. Bars show mean ± SE of n = 17–35 interspike intervals; **p < 0.01, ****p < 0.0001 compared with control, one-way ANOVA with Dunnett's post hoc test. D, Responses of the neuron shown in panel A to current steps before (black) and after (red) TTX are superimposed for comparison. The responses to hyperpolarizing steps are unchanged by TTX; the membrane depolarization in response to a depolarizing step is increased following TTX. E, The membrane potential during hyperpolarizing current steps of −25 pA (left) or −50 pA (right) is shown for n = 15 different dopaminergic neurons, under control conditions (black) and after application of TTX (red). Small circular markers show values for individual neurons, with control and post-TTX values connected by lines; large square markers show mean ± SE for all 15 neurons (ns, not significant; control vs TTX, two-tailed paired t test). F, For each neuron from panel C, the change in membrane potential during hyperpolarizing steps (−25 pA, left or −50 pA, right) after TTX application was calculated. Gray data points show 15 individual dopaminergic neurons, bars show mean difference ± SE for n = 15 neurons.
Figure 5.
Figure 5.
Role of Na+, K+, and Ca2+ ions in the resting membrane potential and autonomous pacemaker activity of zebrafish DC2/4 dopaminergic neurons. A, Membrane potential trace from a dopaminergic neuron under control conditions (black; AP threshold is indicated by a dashed line) and after application of TTX (red). B, Scatterplot showing membrane potential during interspike intervals (ISMP) and AP threshold under control conditions (n = 23), membrane potential after TTX application (n = 23), and membrane potential after TTX application followed by perfusion with Na+-free (n = 7) or Ca2+-free (n = 3) extracellular solution. The final group shows membrane potential in extracellular solution with TTX and TEA, in cells recorded with a cesium-based intracellular solution (n = 4). Data points show values for individual neurons, lines show mean ± SE; ***p < 0.001 (one-way ANOVA with Tukey's multiple comparisons test). C, Membrane potential trace showing pacemaker activity of a dopaminergic neuron under control conditions (black), in Ca2+-free extracellular solution (red), and after restoration of control conditions (blue). D, Averaged APs from the traces in panel C are superimposed (the color key is identical). The inset panel shows the boxed area in the main figure at a larger scale, to illustrate how threshold potential and AHP change in the absence of Ca2+ and recover on replacement of Ca2+. E–G, Scatterplots showing (E) AP frequency, (F) threshold potential, and (G) AHP, under control conditions (black), Ca2+-free extracellular solution (red) and following return to control conditions (blue). Data points show individual neurons (n = 11); lines show mean ± SE; ***p < 0.001 (repeated measures one-way ANOVA with Tukey's multiple comparisons test). ns, not significant.
Figure 6.
Figure 6.
Role of calcium in modulating pacemaker activity in zebrafish DC2/4 dopaminergic neurons. Pacemaker activity in dopaminergic neurons was recorded in control solution (control; black) and after addition of: (A–C) Cd2+ (voltage-gated calcium channel blocker; final bath concentration 50 μm; n = 8 cells; red), (D–F) apamin (SK channel blocker; final bath concentration 100 nm; n = 10 cells; blue), or (G–I) isradipine (L-type calcium channel blocker; final bath concentration 9 μm; n = 9 cells; green). A, D, G, Membrane potential traces showing pacemaker activity under control conditions and following addition of each inhibitor. In each case, averaged APs are shown to the right of the trace; the inset panels show the AHP using a larger scale to illustrate differences. B, E, H, Scatter plots showing discharge frequency of spontaneous pacemaker activity under control conditions and after addition of each inhibitor. Points show data from individual cells, bars show mean ± SE; *p < 0.05 (two-tailed paired t test). C, F, I, Scatter plots showing the amplitude of the slow AHP under control conditions and after addition of each inhibitor. Points show data from individual cells, bars show mean ± SE; *p < 0.05, ***p < 0.001 (two-tailed paired t test). ns, not significant.
Figure 7.
Figure 7.
Activation and inactivation of sodium and potassium currents in zebrafish DC2/4 dopaminergic neurons. A, The traces show a family of potassium currents evoked in a dopaminergic neuron by holding potential steps between −68 and 112 mV in 10-mV increments as indicated below. Whole-cell voltage clamp recordings were made in the presence of TTX (1 μm) to block sodium channels. B, Activation curve for voltage-gated potassium channels. C, Dependence of time constant of activation of voltage gated potassium channels on membrane potential. D, The traces show a family of sodium currents evoked in a dopaminergic neuron by holding potential steps between −47 and −7 mV in 5-mV increments, following a prepulse protocol (sequential steps to −77, −32, and −52 mV as shown in the lower tracing), to measure sodium channel activation. The prepulse protocol and addition of low-concentration TTX (30 nm) were necessary to ensure space clamp during whole-cell recording. Potassium channels were blocked by adding TEA (20 mm) and 4-AP (2 mm) to the extracellular solution, and replacing potassium with cesium in the recording electrode. E, The traces show a family of sodium currents evoked by a holding potential step to −7 mV from holding potentials between −62 and −12 mV in 5-mV increments, to measure sodium channel inactivation. Data are from the same cell as in panel D, recorded under identical experimental conditions. F, Activation (red) and inactivation (blue) curves for voltage-gated sodium channels. G, Dependence of time constant of activation (red) and inactivation (blue) of voltage gated sodium channels on membrane potential. In panels B, C, F, G, colored data points show measurements from individual cells (potassium currents n = 5 cells, 5 slices from 3 brains; sodium currents, n = 7 cells, 7 slices from 5 brains), and the thin black line shows the averaged experimental data. The superimposed colored lines show functions derived from fitting Hodgkin–Huxley model equations to the experimental data (see Materials and Methods; Eqs. 6–29).
Figure 8.
Figure 8.
Computational model of a zebrafish DC2/4 dopaminergic neuron replicates autonomous pacemaker activity. A, Autonomous pacemaker activity (left) and average AP (right) for a computational simulation of a dopaminergic neuron (upper trace; black) compared with an electrophysiological recording from a zebrafish dopaminergic neuron in extracellular solution with 50 μm cadmium to block calcium channels (lower trace; red). B, Membrane potential responses of the model neuron to injection of current steps with amplitude from –50 to +600 pA, as indicated in the lower traces. C, Dependence of the firing frequency of the model neuron on the amplitude of the injected current steps. D, Relationship between the autonomous firing frequency of the model neuron and the leak conductance density. E, Relationship between the autonomous firing frequency of the model neuron and the voltage-gated potassium conductance density. F, Relationship between the autonomous firing frequency of the model neuron and the voltage-gated sodium conductance density. In panels DF, the experimentally-determined values used in the simulations shown in panels A–C are marked with yellow symbols.
Figure 9.
Figure 9.
Ionic currents underlying pacemaker activity in a computational model of a zebrafish DC2/4 dopaminergic neuron. The upper panel shows the membrane potential of the model cell, from the start of one AP to the conclusion of the next. The slow depolarization phase of the interspike interval is indicated and shaded for clarity. The lower panel shows currents mediated by voltage-gated sodium channels (red), voltage gated potassium channels (blue) and leak conductance (green), along with the net current (black). The inset panel shows the period immediately before the AP, with expanded time scale and compressed current scale to illustrate the large and rapidly increasing current mediated by voltage-gated sodium channels as the leak current reversal potential (circled) is passed.

References

    1. Armstrong CM, Cota G (1991) Calcium-ion as a cofactor in Na channel gating. Proc Natl Acad Sci USA 88:6528–6531. 10.1073/pnas.88.15.6528 - DOI - PMC - PubMed
    1. Bai Q, Parris RS, Burton EA (2014) Different mechanisms regulate expression of zebrafish myelin protein zero (P0) in myelinating oligodendrocytes and its induction following axonal injury. J Biol Chem 289:24114–24128. 10.1074/jbc.M113.545426 - DOI - PMC - PubMed
    1. Banerjee K, Sinha M, Pham CLL, Jana S, Chanda D, Cappai R, Chakrabarti S (2010) Alpha-synuclein induced membrane depolarization and loss of phosphorylation capacity of isolated rat brain mitochondria: implications in Parkinson's disease. FEBS Lett 584:1571–1576. 10.1016/j.febslet.2010.03.012 - DOI - PubMed
    1. Baranauskas G (2007) Ionic channel function in action potential generation: current perspective. Mol Neurobiol 35:129–150. 10.1007/s12035-007-8001-0 - DOI - PubMed
    1. Bartel WP, Van Laar VS, Burton EA (2020) Parkinson's disease. In: Behavioral and neural genetics of zebrafish (Gerlai RT, ed), pp 377–412. San Diego: Elsevier.

Publication types

MeSH terms

Substances

LinkOut - more resources