. 2021 Mar 17;6(2):e00920-20.
doi: 10.1128/mSphere.00920-20.

Machine Learning Prediction and Experimental Validation of Antigenic Drift in H3 Influenza A Viruses in Swine

Affiliations

Machine Learning Prediction and Experimental Validation of Antigenic Drift in H3 Influenza A Viruses in Swine

Michael A Zeller et al. mSphere. .

Abstract

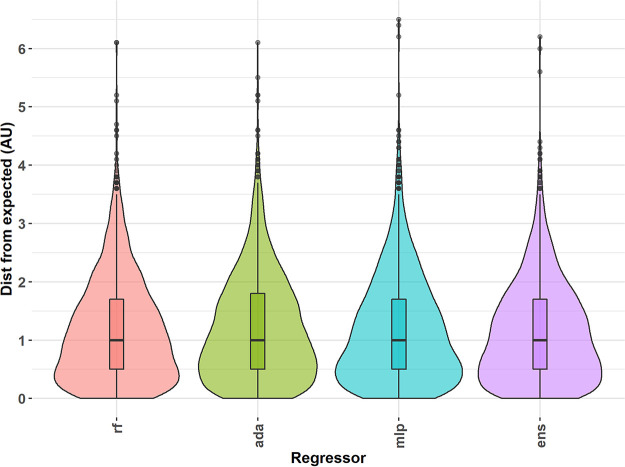
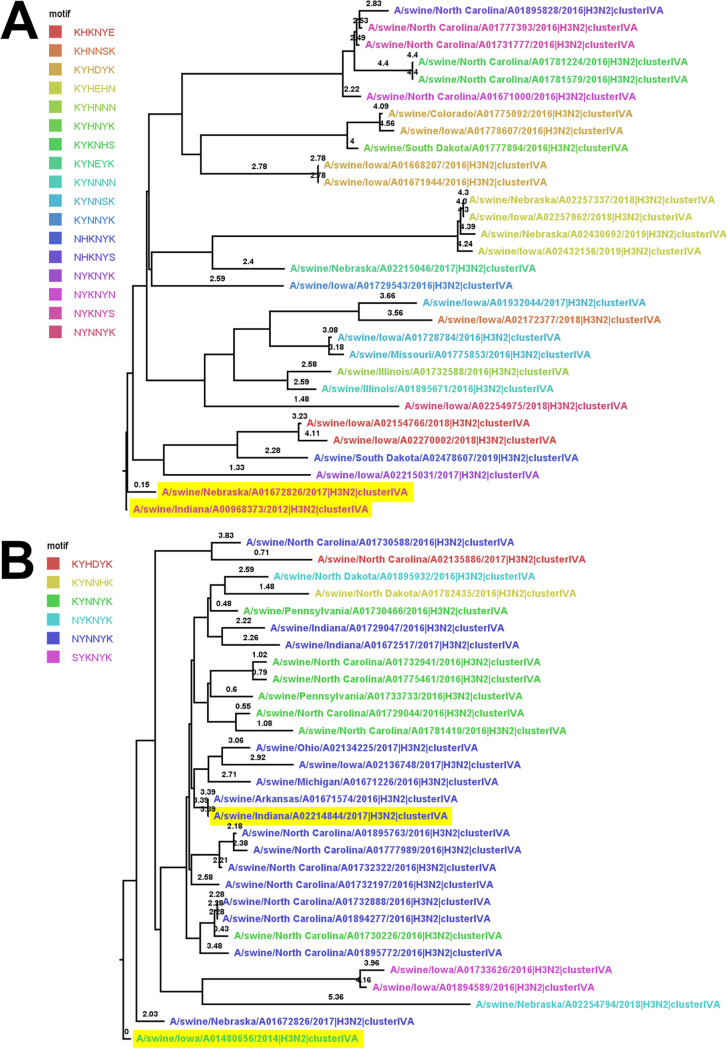
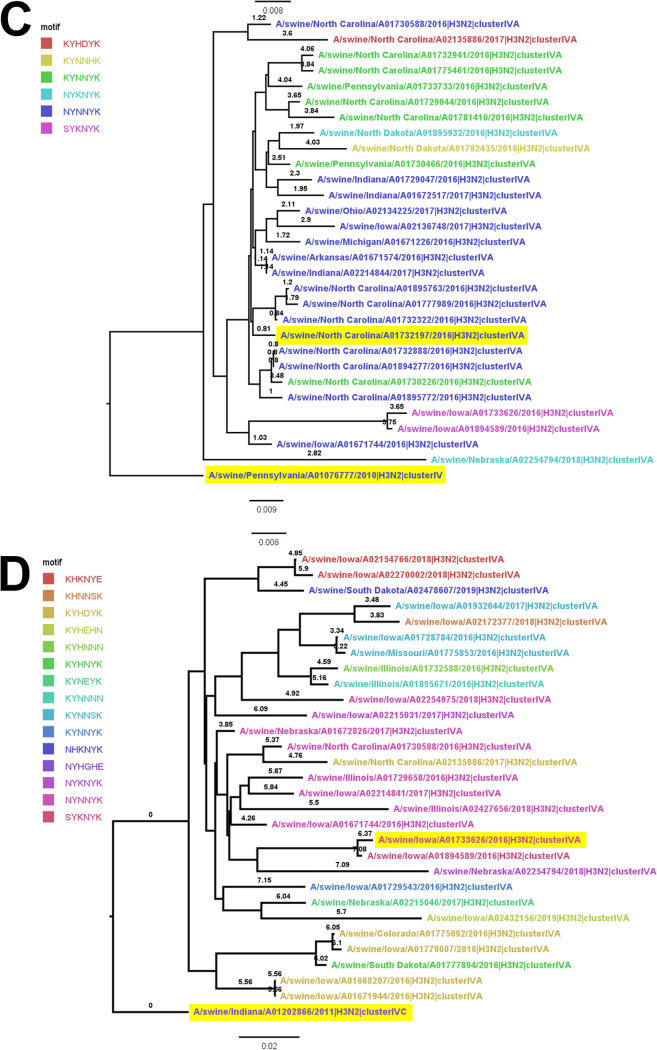
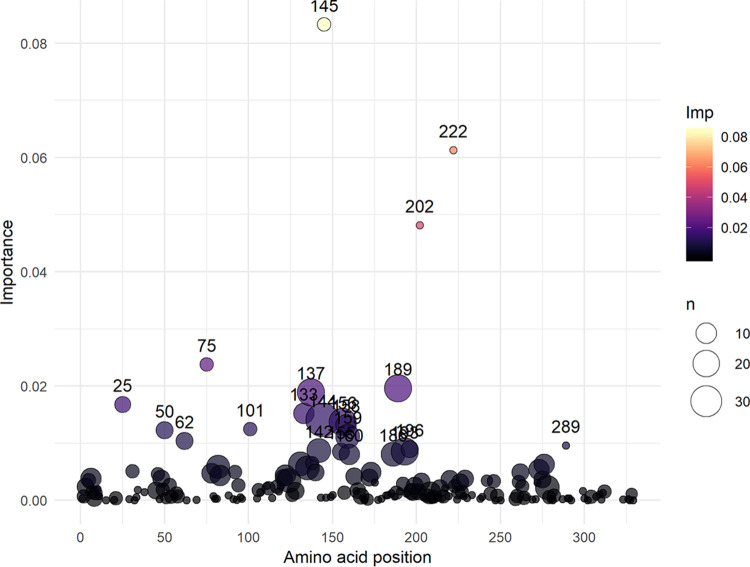
The antigenic diversity of influenza A viruses (IAV) circulating in swine challenges the development of effective vaccines, increasing zoonotic threat and pandemic potential. High-throughput sequencing technologies can quantify IAV genetic diversity, but there are no accurate approaches to adequately describe antigenic phenotypes. This study evaluated an ensemble of nonlinear regression models to estimate virus phenotype from genotype. Regression models were trained with a phenotypic data set of pairwise hemagglutination inhibition (HI) assays, using genetic sequence identity and pairwise amino acid mutations as predictor features. The model identified amino acid identity, ranked the relative importance of mutations in the hemagglutinin (HA) protein, and demonstrated good prediction accuracy. Four previously untested IAV strains were selected to experimentally validate model predictions by HI assays. Errors between predicted and measured distances of uncharacterized strains were 0.35, 0.61, 1.69, and 0.13 antigenic units. These empirically trained regression models can be used to estimate antigenic distances between different strains of IAV in swine by using sequence data. By ranking the importance of mutations in the HA, we provide criteria for identifying antigenically advanced IAV strains that may not be controlled by existing vaccines and can inform strain updates to vaccines to better control this pathogen.IMPORTANCE Influenza A viruses (IAV) in swine constitute a major economic burden to an important global agricultural sector, impact food security, and are a public health threat. Despite significant improvement in surveillance for IAV in swine over the past 10 years, sequence data have not been integrated into a systematic vaccine strain selection process for predicting antigenic phenotype and identifying determinants of antigenic drift. To overcome this, we developed nonlinear regression models that predict antigenic phenotype from genetic sequence data by training the model on hemagglutination inhibition assay results. We used these models to predict antigenic phenotype for previously uncharacterized IAV, ranked the importance of genetic features for antigenic phenotype, and experimentally validated our predictions. Our model predicted virus antigenic characteristics from genetic sequence data and provides a rapid and accurate method linking genetic sequence data to antigenic characteristics. This approach also provides support for public health by identifying viruses that are antigenically advanced from strains used as pandemic preparedness candidate vaccine viruses.

Keywords: antigenic drift; influenza A; machine learning; molecular epidemiology; swine; viral evolution.


Figures

FIG 1
FIG 1
Distribution of errors calculated for the predicted antigenic distance compared to actual antigenic distance as predicted by machine learning models and hemagglutination inhibition assays, respectively. Three regression models were used to predict distances from empirically determined antigens using hemagglutination inhibition titers in a leave-one-out approach: random forest regression (rf), AdaBoost decision tree regression (ada), and multilayer perceptron (mlp) regression. All three predictions were combined into an ensemble (ens) to prevent overfitting and to minimize errant predictions by averaging across predictions from all models. Approximately 25% of the data have 0.5 antigenic units (AU) of error or less, and 50% of the data have 1 AU of error or less, with 75% of the data having less than 2 AU of error. Maximum error for outliers exceeded 6 AU.
FIG 2
FIG 2
Phylogenetic trees of test antigens rooted to their reference strain. (A) Phylogenetic tree of test antigen A/swine/Nebraska/A01672826/2017 and reference strain A/swine/Indiana/A00968373/2012, representing a near predicted antigenic distance prediction (0.15 AU) for two strains of near amino acid identity (99.4%). (B) Phylogenetic tree of test antigen A/swine/Indiana/A02214844/2017 and reference strain A/swine/Iowa/A01480656/2014, representing a far predicted antigenic distance prediction (3.39) for two strains of near amino acid identity (98.5%). (C) Phylogenetic tree of test antigen A/swine/North Carolina/A01732197/2016 and reference strain A/swine/Pennsylvania/A01076777/2010, representing a near predicted antigenic distance prediction (0.81) for two strains of far amino acid identity (94.2%). (D) Phylogenetic tree of test antigen A/swine/Iowa/A01733626/2016 and reference strain A/swine/Indiana/A01202866/2011, representing a far predicted antigenic distance prediction (6.37) for two strains of far amino acid identity (91.2%). Branches of the phylogenetic tree were annotated with the predicted antigenic distance from the ensemble regression model (both test antigen and reference strain are highlighted). Each tree is pruned to 30 sequences. Influenza virus strains are colored by the antigenic motif formed by amino acid positions 145, 155, 156, 158, 159, and 189; these positions, located near the ligand binding site of the hemagglutinin protein, have been noted to affect the antigenic interactions of the protein.
FIG 2
FIG 2
Phylogenetic trees of test antigens rooted to their reference strain. (A) Phylogenetic tree of test antigen A/swine/Nebraska/A01672826/2017 and reference strain A/swine/Indiana/A00968373/2012, representing a near predicted antigenic distance prediction (0.15 AU) for two strains of near amino acid identity (99.4%). (B) Phylogenetic tree of test antigen A/swine/Indiana/A02214844/2017 and reference strain A/swine/Iowa/A01480656/2014, representing a far predicted antigenic distance prediction (3.39) for two strains of near amino acid identity (98.5%). (C) Phylogenetic tree of test antigen A/swine/North Carolina/A01732197/2016 and reference strain A/swine/Pennsylvania/A01076777/2010, representing a near predicted antigenic distance prediction (0.81) for two strains of far amino acid identity (94.2%). (D) Phylogenetic tree of test antigen A/swine/Iowa/A01733626/2016 and reference strain A/swine/Indiana/A01202866/2011, representing a far predicted antigenic distance prediction (6.37) for two strains of far amino acid identity (91.2%). Branches of the phylogenetic tree were annotated with the predicted antigenic distance from the ensemble regression model (both test antigen and reference strain are highlighted). Each tree is pruned to 30 sequences. Influenza virus strains are colored by the antigenic motif formed by amino acid positions 145, 155, 156, 158, 159, and 189; these positions, located near the ligand binding site of the hemagglutinin protein, have been noted to affect the antigenic interactions of the protein.
FIG 3
FIG 3
Rank of amino acid location importance by the cumulative summation of importance per site mutation as determined by random forest regression. Amino acid position using H3 numbering is reported on the x axis. The importance for each site-specific mutation is summed per site and displayed on the y axis using a color scale. The sum of importance is scaled to 1 and is unitless. The size of the circle is relative to the number of mutations observed in the training set per site. Identity was the highest-ranking feature, with an importance of 0.312, but is not displayed on the graph. The top 10 amino acid transition features in order of importance are K145N, I202V, R222W, H75Q, R137Y, D101Y, E62K, I25L, P289S, and D133N. The top 10 amino acid sites in order of cumulative importance are 145, 202, 222, 75, 189, 137, 144, 133, 156, and 101.
FIG 4
FIG 4
Projection of feature importance on a monomer of the A/Victoria/361/2011 hemagglutinin (HA) protein (RCSB 4O5N). The importance for each site-specific mutation is summed per site and projected onto the hemagglutinin protein model of the human H3. Higher color intensity represents a larger calculated importance. Positions with no data are colored gray.

Similar articles

Cited by

References

    1. Dykhuis- Haden C, Painter T, Fangman T, Holtkamp D. 2012. Assessing production parameters and economic impact of swine influenza, PRRS and Mycoplasma hyopneumoniae on finishing pigs in a large production system. Abstr Am Assoc Swine Veterinarians, Denver, CO.
    1. Saitou N, Nei M. 1986. Polymorphism and evolution of influenza A virus genes. Mol Biol Evol 3:57–74. doi:10.1093/oxfordjournals.molbev.a040381. - DOI - PubMed
    1. Sandbulte MR, Spickler AR, Zaabel PK, Roth JA. 2015. Optimal use of vaccines for control of influenza A virus in swine. Vaccines (Basel) 3:22–73. doi:10.3390/vaccines3010022. - DOI - PMC - PubMed
    1. Vincent AL, Ciacci-Zanella JR, Lorusso A, Gauger PC, Zanella EL, Kehrli ME, Jr, Janke BH, Lager KM. 2010. Efficacy of inactivated swine influenza virus vaccines against the 2009 A/H1N1 influenza virus in pigs. Vaccine 28:2782–2787. doi:10.1016/j.vaccine.2010.01.049. - DOI - PubMed
    1. Van Reeth K, Labarque G, De Clercq S, Pensaert M. 2001. Efficacy of vaccination of pigs with different H1N1 swine influenza viruses using a recent challenge strain and different parameters of protection. Vaccine 19:4479–4486. doi:10.1016/S0264-410X(01)00206-7. - DOI - PubMed

Publication types

MeSH terms

Substances

LinkOut - more resources