. 2021 Mar 17;9(1):19.
doi: 10.1038/s41413-021-00140-6.

Chondrogenesis mediates progression of ankylosing spondylitis through heterotopic ossification

Affiliations

Chondrogenesis mediates progression of ankylosing spondylitis through heterotopic ossification

Tao Yu et al. Bone Res. .

Abstract

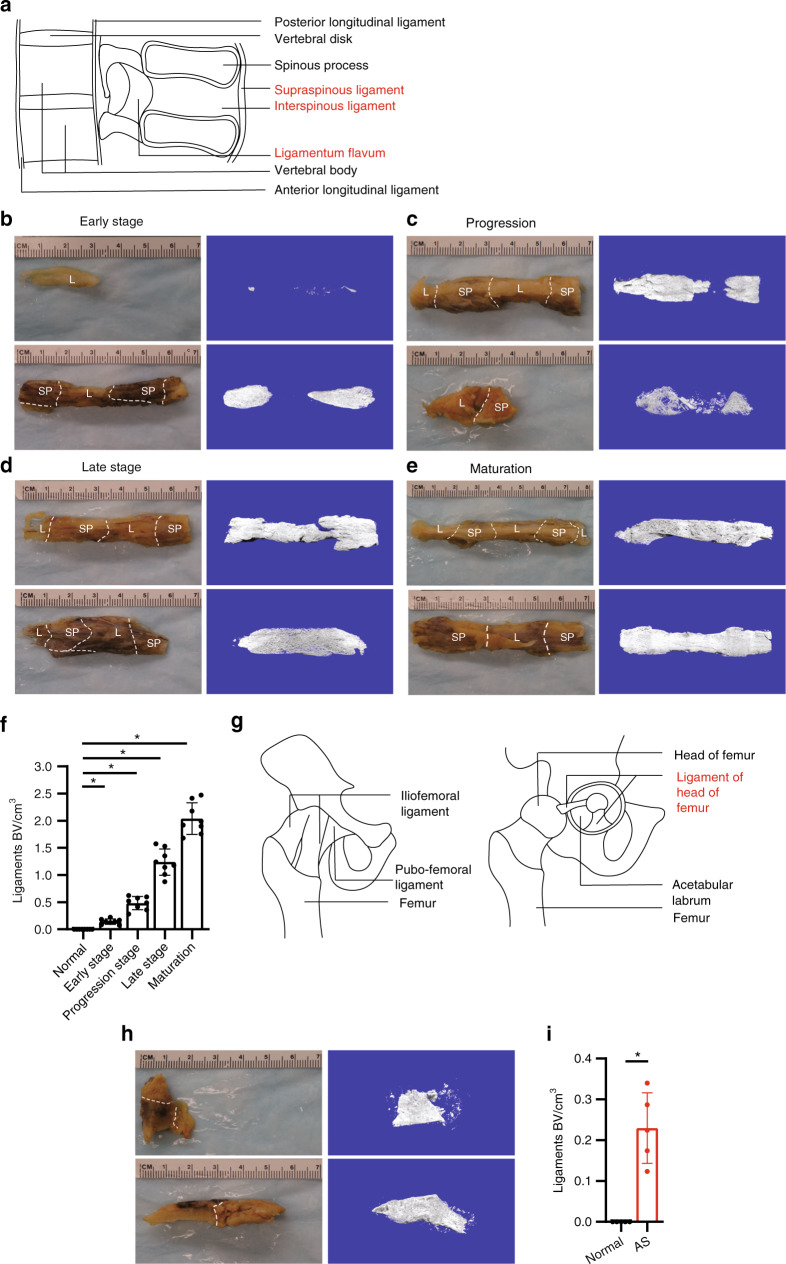
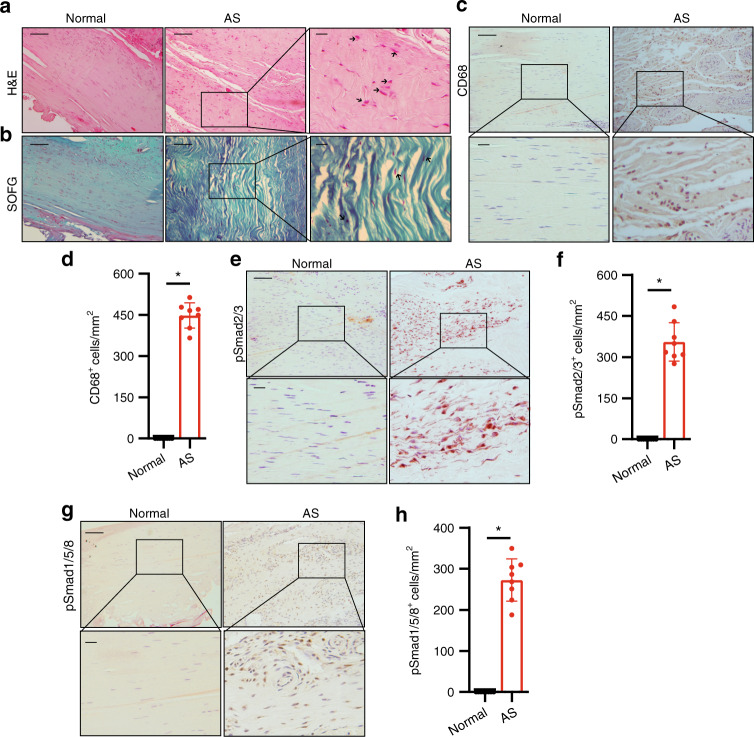
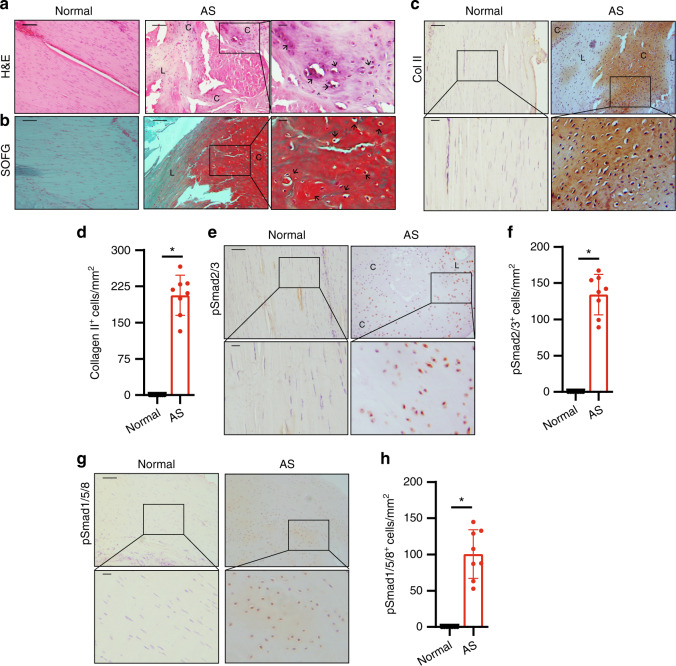
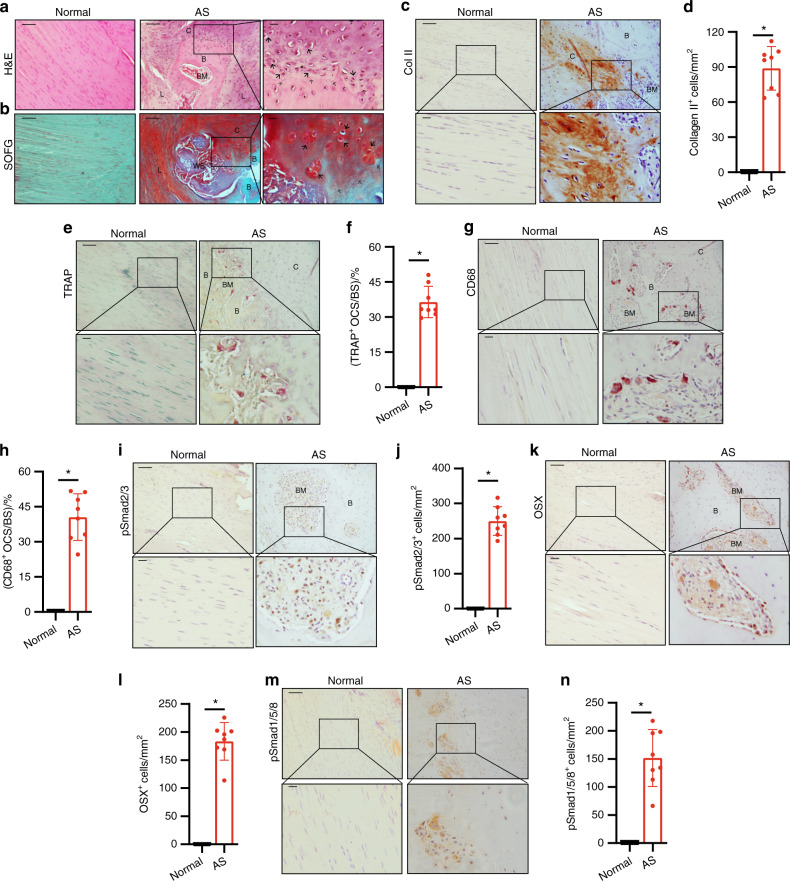
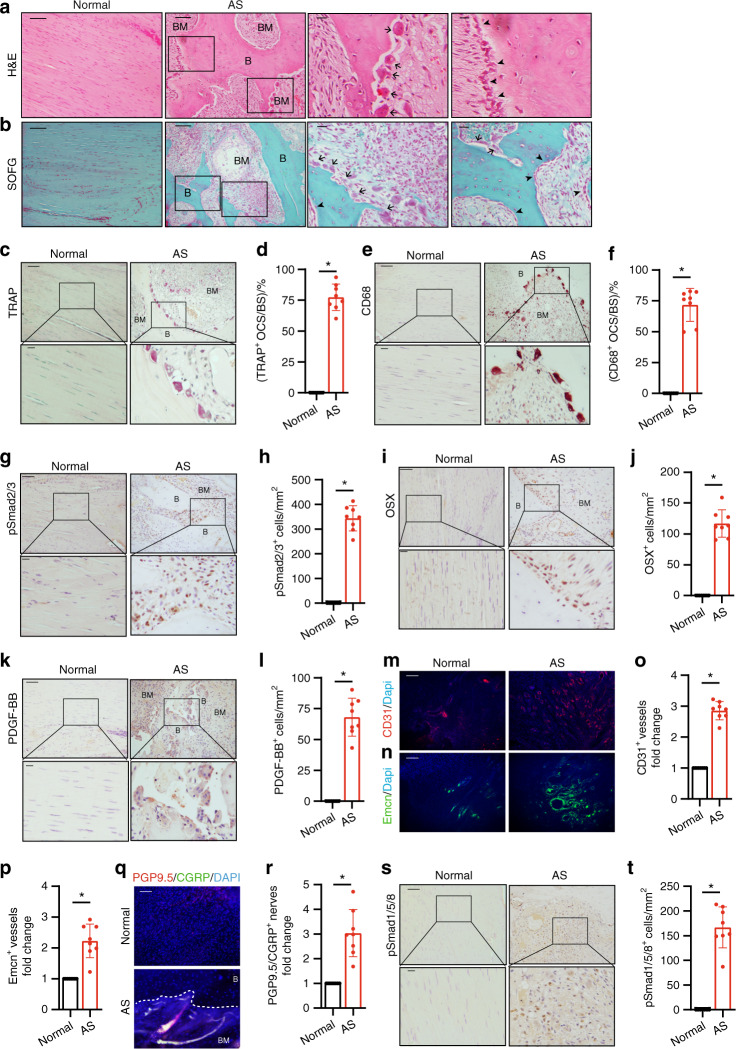
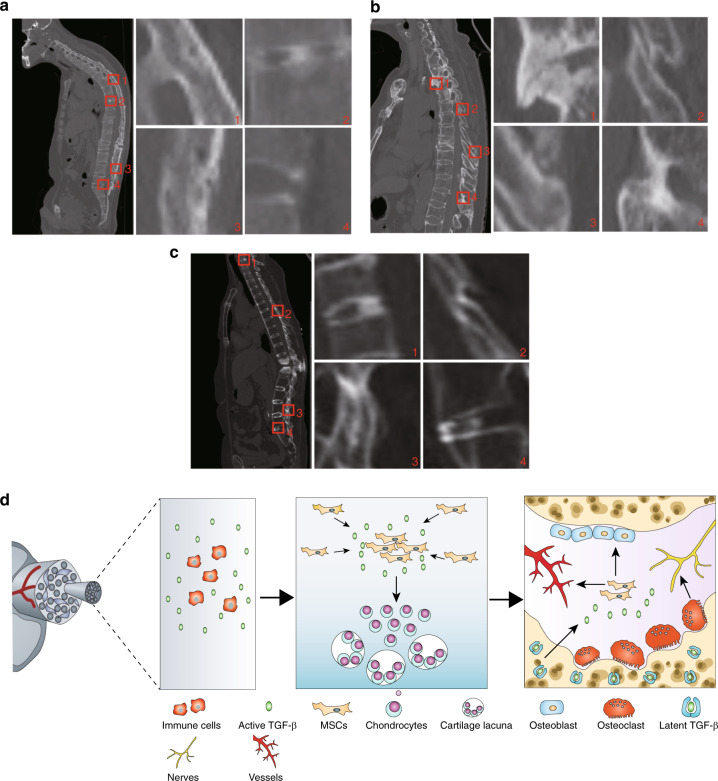
Ankylosing spondylitis (AS) is chronic inflammatory arthritis with a progressive fusion of axial joints. Anti-inflammatory treatments such as anti-TNF-α antibody therapy suppress inflammation but do not effectively halt the progression of spine fusion in AS patients. Here we report that the autoimmune inflammation of AS generates a microenvironment that promotes chondrogenesis in spine ligaments as the process of spine fusion. Chondrocyte differentiation was observed in the ligaments of patients with early-stage AS, and cartilage formation was followed by calcification. Moreover, a large number of giant osteoclasts were found in the inflammatory environment of ligaments and on bony surfaces of calcified cartilage. Resorption activity by these giant osteoclasts generated marrow with high levels of active TGF-β, which induced new bone formation in the ligaments. Notably, no Osterix+ osteoprogenitors were found in osteoclast resorption areas, indicating uncoupled bone resorption and formation. Even at the late and maturation stages, the uncoupled osteoclast resorption in bony interspinous ligament activates TGF-β to induce the progression of ossification in AS patients. Osteoclast resorption of calcified cartilage-initiated ossification in the progression of AS is a similar pathologic process of acquired heterotopic ossification (HO). Our finding of cartilage formation in the ligaments of AS patients revealed that the pathogenesis of spinal fusion is a process of HO and explained why anti-inflammatory treatments do not slow ankylosing once there is new bone formation in spinal soft tissues. Thus, inhibition of HO formation, such as osteoclast activity, cartilage formation, or TGF-β activity could be a potential therapy for AS.


Conflict of interest statement

The authors declare no competing interests.

Figures

Fig. 1
Fig. 1
μCT scan of calcified ligaments in AS patients. a Illustration of spinal ligaments. Unaided views of spinous process specimens (interspinous ligament with supraspinous ligament and/or ligamentum flavum) and their μCT scans showing b limited calcification, c partial calcification, d complete calcification of ligaments, and e mature bony ligaments. f Quantification of heterotopic bone volume (BV) in ligaments of the spinous process. g Illustration of hip joint ligaments. h Unaided view of calcified ligaments of a hip joint specimen and its μCT scan. i Quantification of heterotopic bone volume in ligaments of the hip joint in normal and ankylosing spondylitis (AS) specimens. L, ligament; SP, spinous process; AL, acetabular labrum; FH, femoral head
Fig. 2
Fig. 2
Elevated TGF-β levels in the early inflammatory stage of AS. a Hematoxylin and eosin (H&E) staining and b Safranin O–Fast Green (SOFG) staining of normal and inflamed interspinous ligaments. In the AS group, the right panels show magnified views of the boxed area in the left panels. Scale bar: 100 μm (two panels on the right); 25 μm (left panel). c Immunostaining and d quantitative analysis of CD68-positive cells (brown) in the normal and inflamed interspinous ligaments (sagittal view). The bottom panels show magnified views of the boxed area in the top panels. Scale bar: 100 μm (top panels); 25 μm (bottom panels). e Immunostaining and f quantitative analysis of pSmad2/3-positive cells (brown) in the normal and inflamed interspinous ligaments (sagittal view) in normal ligaments and inflammatory ligaments. The bottom panels show magnified views of the boxed area in the top panels. Scale bar: 100 μm (top panels); 25 μm (bottom panels). g Immunostaining and h quantitative analysis of pSmad1/5/8-positive cells (brown) in the normal and inflamed interspinous ligaments (sagittal view). The bottom panels show magnified views of the boxed area in the top panels. Scale bar: 100 μm (top panels); 25 μm (bottom panels)
Fig. 3
Fig. 3
Chondrocyte differentiation and cartilage formation in interspinous ligaments of AS patients before calcification. a Hematoxylin and eosin (H&E) staining and b Safranin O–Fast Green (SOFG) staining of normal and chondrogenic interspinous ligaments. In the AS group, the right panels show magnified views of the boxed area in the left panels. Scale bar: 100 μm (two panels on the right side); 25 μm (left panel). c Immunostaining and d quantitative analysis of collagen II-positive cells (brown) in the normal and chondrogenic interspinous ligaments (sagittal view). The bottom panels show a magnified view of the boxed area in the top panels. Scale bar: 100 μm (top panel); 25 μm (bottom panel). e Immunostaining and f quantitative analysis of pSmad2/3-positive cells (brown) in the normal and chondrogenic interspinous ligaments (sagittal view). The bottom panels show magnified views of the boxed area in the top panels. Scale bar: 100 μm (top panel); 25 μm (bottom panel). g Immunostaining and h quantitative analysis of pSmad1/5/8-positive cells (brown) in the normal and inflammatory interspinous ligaments (sagittal view). The bottom panels show magnified views of the boxed area in the top panels. Scale bar: 100 μm (top panels); 25 μm (bottom panels). C, cartilage; L, ligament
Fig. 4
Fig. 4
Progression of endochondral heterotopic ossification in AS patients. a Hematoxylin and eosin (H&E) staining and b Safranin O–Fast Green (SOFG) staining of normal interspinous ligaments and endochondral-ossified interspinous ligaments. In the AS group, the right panels show magnified views of the boxed area in the left panels. Scale bar: 100 μm (two panels on the right side); 25 μm (left panel). c Immunostaining and d quantitative analysis of collagen II-positive cells (brown) in the normal and chondrogenic interspinous ligaments (sagittal view). The bottom panels show magnified views of the boxed area in the top panels. Scale bar: 100 μm (top panels); 25 μm (bottom panels). e Tartrate-resistant acid phosphatase (TRAP)-positive cells (red) and f quantitative analysis of TRAP-positive osteoclast (red) surface (OCS) per bone surface (BS). The bottom panels show magnified views of the boxed area in the top panels. Scale bar: 100 μm (top panel); 25 μm (bottom panel). g Immunostaining and h quantitative analysis of the number of CD68-positive osteoclast (brown) surface (OCS) per bone surface (BS). The bottom panels show magnified views of the boxed area in the top panels. Scale bar: 100 μm (top panel); 25 μm (bottom panel). i Immunostaining and j quantitative analysis of pSmad2/3-positive cells (brown) in the normal ligaments and endochondral-ossified interspinous ligaments (sagittal view). The bottom panels show magnified views of the boxed area in the top panels. Scale bar: 100 μm (top panel); 25 μm (bottom panel). k Immunostaining and l quantitative analysis of Osterix-positive cells (brown) in the normal and endochondral-ossified interspinous ligaments (sagittal view). The bottom panels show magnified views of the boxed area in the top panels. Scale bar: 100 μm (top panel); 25 μm (bottom panel). m Immunostaining and n quantitative analysis of pSmad1/5/8-positive cells (brown) in the normal and inflammatory interspinous ligaments (sagittal view). The bottom panels show magnified views of the boxed area in the top panels. Scale bar: 100 μm (top panels); 25 μm (bottom panels). B, bone; BM, bone marrow; C, cartilage
Fig. 5
Fig. 5
Osteoclast resorption of bony interspinous ligaments releases active TGF-β to drive the progression of ossification in AS patients. a Hematoxylin and eosin (H&E) staining and b Safranin O–Fast Green staining of normal and HO-formed interspinous ligaments. In the AS group, the right panels show magnified views of the boxed area in the left panels. Scale bar: 100 μm (two panels on the right); 25 μm (two panels on the left). c Tartrate-resistant acid phosphatase (TRAP)-positive cells (red) and d quantitative analysis of the TRAP-positive osteoclast surface (OCS) per bone surface. The bottom panels show magnified views of the boxed area in the top panels. Scale bar: 100 μm (top panel); 25 μm (bottom panel). e Immunostaining and f quantitative analysis of CD68-positive cells (brown) in the normal and HO-formed interspinous ligaments (sagittal view). The bottom panels show magnified views of the boxed area in the top panels. Scale bar: 100 μm (top panel); 25 μm (bottom panel). g Immunostaining and h quantitative analysis of pSmad2/3-positive cells in the normal and HO-formed interspinous ligaments (sagittal view). The bottom panels show magnified views of the boxed area in the top panels. Scale bar: 100 μm (top panel); 25 μm (bottom panel). i Immunostaining and j quantitative analysis of Osterix-positive cells (brown) in the normal and HO-formed interspinous ligaments (sagittal view). The bottom panels show magnified views of the boxed area in the top panels. Scale bar: 100 μm (top panel); 25 μm (bottom panel). k Immunostaining and l quantitative analysis of PDGF-BB-positive cells in the normal and HO-formed interspinous ligaments (sagittal view). The bottom panels show magnified views of the boxed area in the top panels. Scale bar: 100 μm (top panels); 25 μm (bottom panels). m CD31-positive (red) cells, n EMCN-positive (green) cells and quantification of the fold change of o CD31-positive vessels, p EMCN-positive vessels in the normal and HO-formed interspinous ligaments (sagittal view). q PGP9.5-positive (red) cells and CGRP-positive (green) cells and quantification of the fold change of r PGP9.5 and CGRP double positive nerves in the normal and HO-formed interspinous ligaments (sagittal view). s Immunostaining and t quantitative analysis of pSmad1/5/8-positive cells (brown) in the normal and inflammatory interspinous ligaments (sagittal view). The bottom panels show magnified views of the boxed area in the top panels. Scale bar: 100 μm (top panels); 25 μm (bottom panels)
Fig. 6
Fig. 6
Ossification in spine soft tissues by CT in AS patients. a Male, aged 45 years. 1 Supraspinous ligament and Interspinous ligament. 2 Vertebral disk. 3 Supraspinous ligaments. 4 Posterior longitudinal ligaments. b Male, aged 37 years. 1 Anterior longitudinal ligament. 2 Interspinous ligament. 3 Interspinous ligament and supraspinous ligament. 4 Interspinous ligament and ligamentum flavum. c Female, aged 33 years. 1 Vertebral disk. 2 Interspinous ligament and Ligamentum flavum. 3 Interspinous ligament. 4 Anterior longitudinal ligaments. The right four panels show magnified views of the red boxed area in the left panels. d Hypothetical diagram of pathological progression of AS. Excessive TGF-β is produced by abundant immune cells due to autoimmune disease, then TGF-β recruits MSCs results in chondrocytes proliferation, hypertrophy, and calcification. Numbers of giant osteoclasts keep resorbing calcified cartilage and freeing TGF-β from lap, continuous high level of TGF-β recruits MSCs for vessels formation and osteoblasts differentiation, osteoclasts also induce the innervation process

Similar articles

Cited by

References

    1. Dean LE, et al. Global prevalence of ankylosing spondylitis. Rheumatology (Oxford) 2014;53:650–657. doi: 10.1093/rheumatology/ket387. - DOI - PubMed
    1. Zhu W, et al. Ankylosing spondylitis: etiology, pathogenesis, and treatments. Bone Res. 2019;7:22. doi: 10.1038/s41413-019-0057-8. - DOI - PMC - PubMed
    1. Brewerton DA, et al. Ankylosing spondylitis and HL-A 27. Lancet. 1973;1:904–907. doi: 10.1016/S0140-6736(73)91360-3. - DOI - PubMed
    1. Lories RJ. Advances in understanding the pathophysiology of spondyloarthritis. Best. Pr. Res Clin. Rheumatol. 2018;32:331–341. doi: 10.1016/j.berh.2018.12.001. - DOI - PubMed
    1. Sieper J, et al. Persistent reduction of spinal inflammation as assessed by magnetic resonance imaging in patients with ankylosing spondylitis after 2 years of treatment with the anti-tumour necrosis factor agent infliximab. Rheumatology (Oxford) 2005;44:1525–1530. doi: 10.1093/rheumatology/kei046. - DOI - PubMed