. 2021 Mar 17;12(4):285.
doi: 10.1038/s41419-021-03537-7.

RNA decay in processing bodies is indispensable for adipogenesis

Affiliations

RNA decay in processing bodies is indispensable for adipogenesis

Ryotaro Maeda et al. Cell Death Dis. .

Abstract

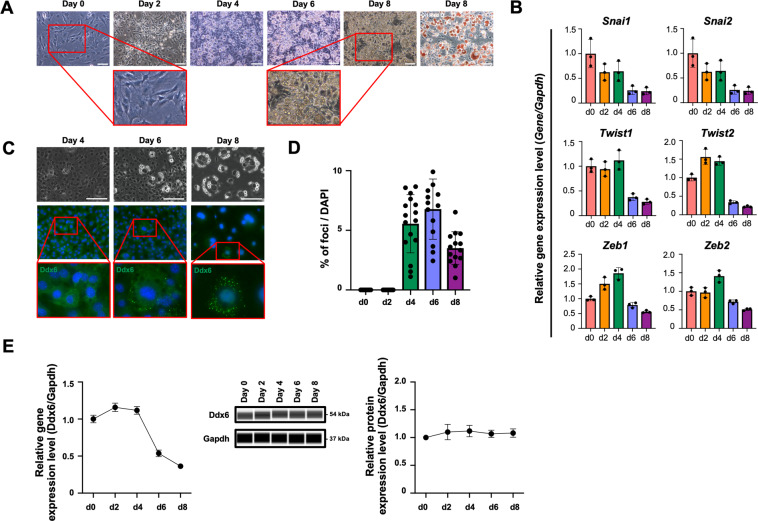
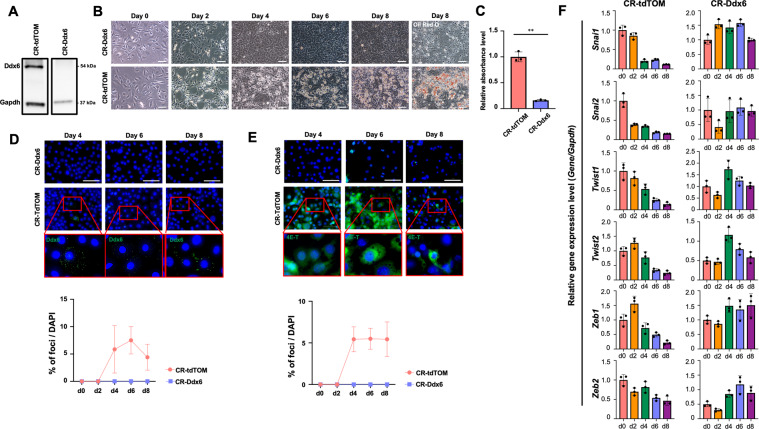
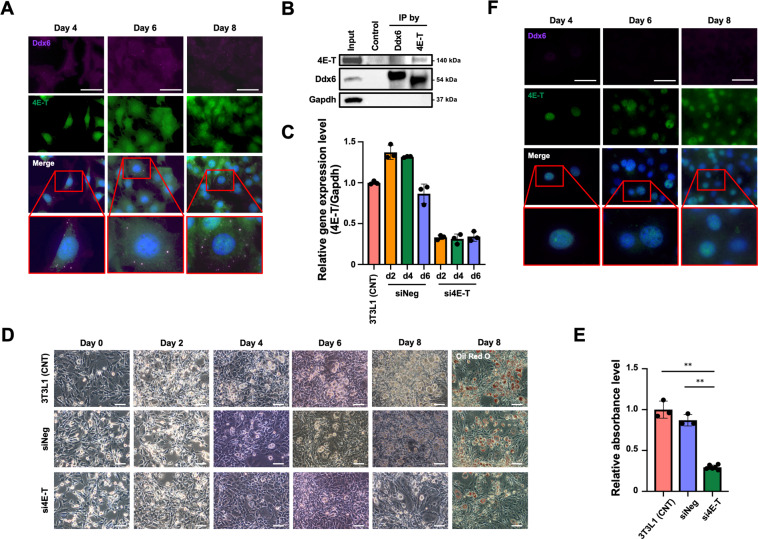
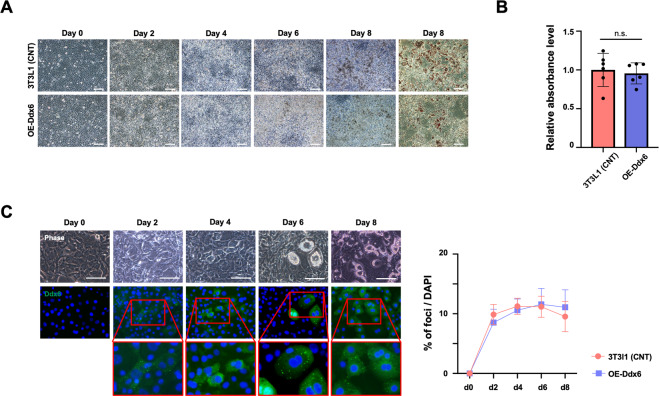
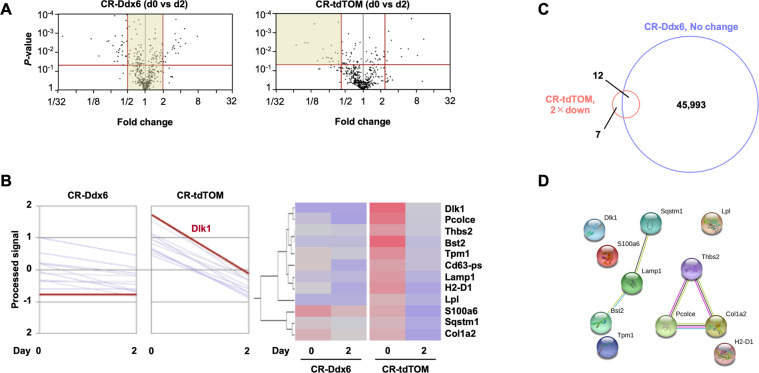
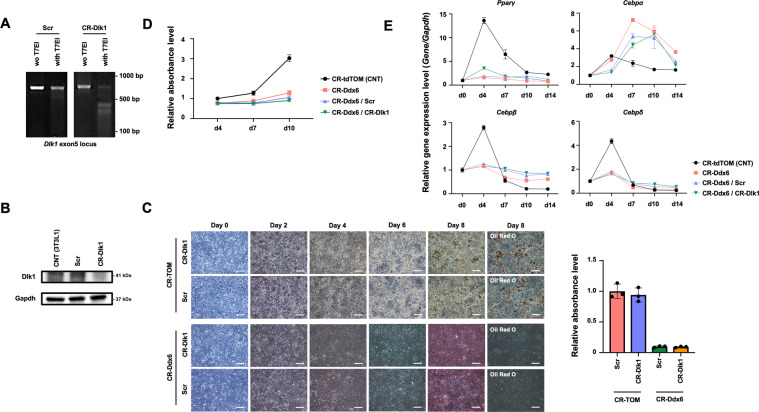
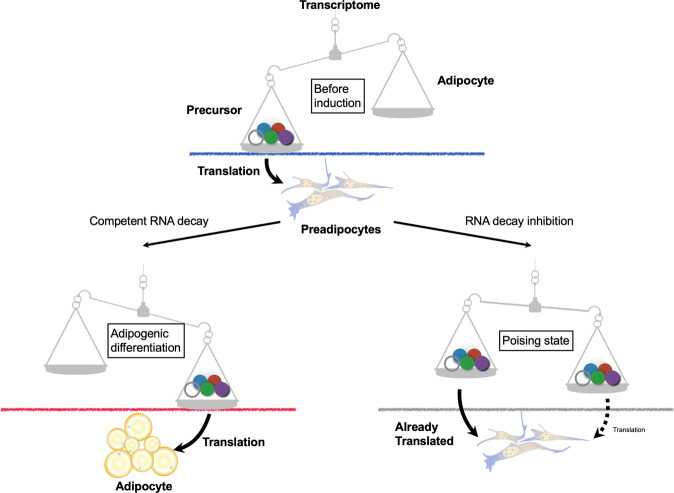
The RNA decay pathway plays key regulatory roles in cell identities and differentiation processes. Although adipogenesis is transcriptionally and epigenetically regulated and has been thoroughly investigated, how RNA metabolism that contributes to the stability of phenotype-shaping transcriptomes participates in differentiation remains elusive. In this study, we investigated Ddx6, an essential component of processing bodies (PBs) that executes RNA decay and translational repression in the cytoplasm and participates in the cellular transition of reprogramming. Upon adipogenic induction, Ddx6 dynamically accumulated to form PBs with a binding partner, 4E-T, at the early phase prior to emergence of intracellular lipid droplets. In contrast, preadipocytes with Ddx6 knockout (KO) or 4E-T knockdown (KD) failed to generate PBs, resulting in significant suppression of adipogenesis. Transcription factors related to preadipocytes and negative regulators of adipogenesis that were not expressed under adipogenic stimulation were maintained in Ddx6-KO and 4E-T-KD preadipocytes under adipogenic induction. Elimination of Dlk1, a major negative regulator of adipogenesis, in 3T3L1 Ddx6-KO cells did not restore adipogenic differentiation capacity to any extent. Similar to murine cells, human primary mesenchymal stem cells, which can differentiate into adipocytes upon stimulation with adipogenic cocktails, required DDX6 to maturate into adipocytes. Therefore, RNA decay of the entire parental transcriptome, rather than removal of a strong negative regulator, could be indispensable for adipogenesis.


Conflict of interest statement

The authors declare no competing interests.

Figures

Fig. 1
Fig. 1. Adipogenic differentiation of 3T3L1 preadipocytes.
A Phase-contrast microscopy images during adipogenesis. 3T3L1 preadipocytes were differentiated into adipocytes using an adipogenic differentiation cocktail containing dexamethasone, IBMX, and insulin. On day 8, the cells were fixed and stained with oil red O. The scale bar is 100 μm. B RT-qPCR analysis of gene expression in 3T3L1 preadipocytes during adipogenesis. Individual RNA expression levels were normalized to Gapdh expression levels. The error bars indicate the SDs (n = 3). C Immunocytochemistry images during adipogenesis. Formation of Ddx6 foci was observed. The scale bar is 50 μm. Nuclei were stained with DAPI. D Ratio of the number of cells with Ddx6 foci to the number of DAPI-positive cells each day following adipogenic induction analyzed in three sessions. Independent researchers chose 7–5 microscopic fields in a session at random. E Protein (n = 4) and gene (n = 6) expression analysis of Ddx6 during adipogenesis. The error bars indicate the SDs.
Fig. 2
Fig. 2. Adipogenic differentiation of 3T3L1 Ddx6-KO preadipocytes.
A Western blotting of 3T3L1 Ddx6-KO preadipocytes. B Phase-contrast microscopic images during adipogenesis. On day 8, cells were fixed and stained with oil red O. The scale bar is 100 μm. C Relative absorbance of oil red O. The error bars indicate the SDs (n = 3). Double asterisks (**) indicate significance (P < 0.01). D Immunocytochemistry of Ddx6 foci and the proportion of cells with foci during adipogenesis. The scale bar is 50 μm. The error bars indicate the SDs (n = 6). E Immunocytochemistry of 4E-T foci and the proportion of cells with foci during adipogenesis. The scale bar is 50 μm. The error bars indicate the SDs (n = 6). F RT-qPCR analysis of gene expression during adipogenesis. Individual RNA expression levels were normalized to Gapdh expression levels. The error bars indicate the SDs (n = 3).
Fig. 3
Fig. 3. Adipogenic differentiation of 3T3L1 4E-T-KD preadipocytes.
A Immunocytochemistry of 3T3L1 preadipocytes during adipogenesis. Foci of Ddx6 and 4E-T proteins were merged. The scale bar is 50 μm. Nuclei were stained with DAPI. B Immunoprecipitates bound by Ddx6 or 4E-T antibodies were analyzed by western blotting with anti-Ddx6 and anti-4E-T antibodies. C RT-qPCR analysis of 4E-T expression on each day. Individual RNA expression levels were normalized to Gapdh expression levels. The error bars indicate the SDs (n = 3). D Phase-contrast microscopy images during adipogenesis. On day 8, the cells were fixed and stained with oil red O. The scale bar is 100 μm. E Relative absorbance of oil red O. The error bars indicate the SDs (n = 3). Double asterisks (**) indicate signific ance (P < 0.01). F Immunocytochemistry of 3T3L1 4E-T-KD preadipocytes during adipogenesis. The scale bar is 50 μm. The nuclei were stained with DAPI.
Fig. 4
Fig. 4. Adipogenic differentiation of Ddx6-O/E 3T3L1 preadipocytes.
A Phase-contrast microscopic images during adipogenesis. On day 8, the cells were fixed and stained with oil red O. The scale bar is 100 μm. B Relative absorbance of oil red O. The error bars indicate the SDs (n = 6). C Fluorescence microscopy images and the proportion of cells with foci during adipogenesis are shown. The scale bar is 100 μm. The error bars indicate the SDs (n = 6). The nuclei were stained with Hoechst 33342.
Fig. 5
Fig. 5. Expression profiling of mRNA changes during the early phase of adipogenic differentiation.
A Volcano plots at the early phase of adipogenesis in TOM-transfected and 3T3L1 Ddx6-KD preadipocytes. B Heatmap of 12 selected genes whose expression was reduced twofold in 3T3L1 TOM cells but not in 3T3L1 Ddx6-KD cells. C Venn diagram showing the number of mRNAs relevant to each segment. D Protein–protein interaction network of 12 intersecting genes predicted by STRING analysis.
Fig. 6
Fig. 6. Adipogenic differentiation of 3T3L1 Dlk1-KO preadipocytes.
A T7EI mismatch detection assay for assessment of the efficiency of the CRISPR-Cas9 system. B Western blot verification of Dlk1 KO by the CRISPR-Cas9 system. C Phase-contrast microscopy images during adipogenesis and the relative absorbance of oil red O on day 8. The scale bar is 100 μm. The error bars indicate the SDs (n = 3). D Relative absorbance of oil red O on each day. The error bars indicate the SDs (n = 3). E RT-qPCR analysis of the expression of each gene during adipogenesis. Individual RNA expression levels were normalized to Gapdh expression levels. The error bars indicate the SDs (n = 3).
Fig. 7
Fig. 7
Model of adipogenic differentiation relevant to RNA metabolism.

Similar articles

Cited by

References

    1. Chua BA, Van Der Werf I, Jamieson C, Signer RAJ. Post-transcriptional regulation of homeostatic, stressed, and malignant stem cells. Cell Stem Cell. 2020;26:138–159. doi: 10.1016/j.stem.2020.01.005. - DOI - PMC - PubMed
    1. Fraga de Andrade I, Mehta C, Bresnick EH. Post-transcriptional control of cellular differentiation by the RNA exosome complex. Nucleic Acids Res. 2020;48:11913–11928. doi: 10.1093/nar/gkaa883. - DOI - PMC - PubMed
    1. Vogel C, Marcotte EM. Insights into the regulation of protein abundance from proteomic and transcriptomic analyses. Nat. Rev. Genet. 2012;13:227–232. doi: 10.1038/nrg3185. - DOI - PMC - PubMed
    1. Labno A, Tomecki R, Dziembowski A. Cytoplasmic RNA decay pathways—enzymes and mechanisms. Biochim. Biophys. Acta. 2016;1863:3125–3147. doi: 10.1016/j.bbamcr.2016.09.023. - DOI - PubMed
    1. Chen CYA, Ezzeddine N, Shyu AB. Chapter 17 messenger RNA half‐life measurements in mammalian cells. Methods Enzymol. 2008;448:335–357. doi: 10.1016/S0076-6879(08)02617-7. - DOI - PMC - PubMed

Publication types