. 2021 Mar 17;7(1):56.
doi: 10.1038/s41420-021-00441-z.

Islet neogenesis associated protein (INGAP) protects pancreatic β cells from IL-1β and IFNγ-induced apoptosis

Affiliations

Islet neogenesis associated protein (INGAP) protects pancreatic β cells from IL-1β and IFNγ-induced apoptosis

Eni Nano et al. Cell Death Discov. .

Abstract

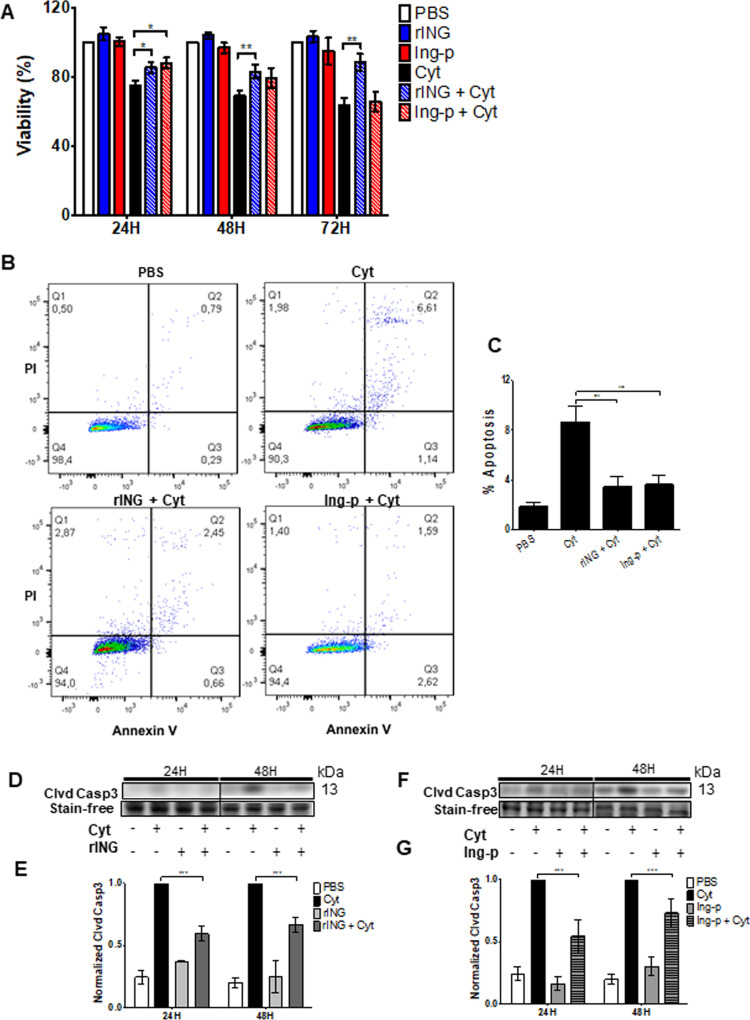
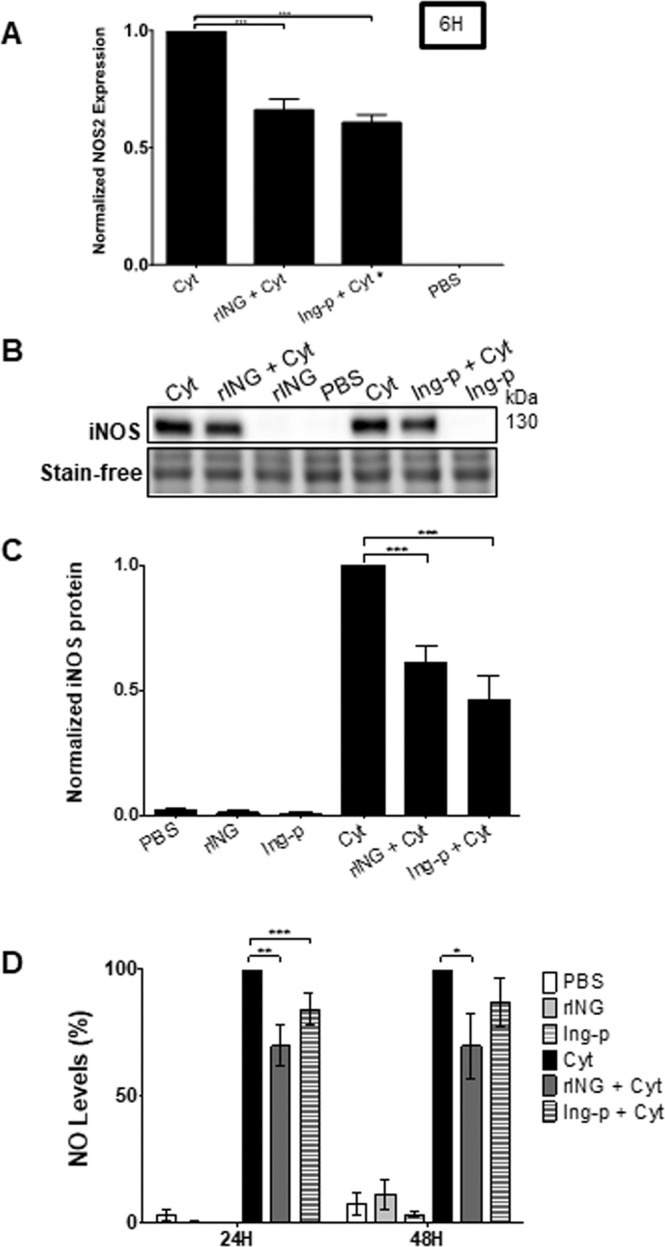
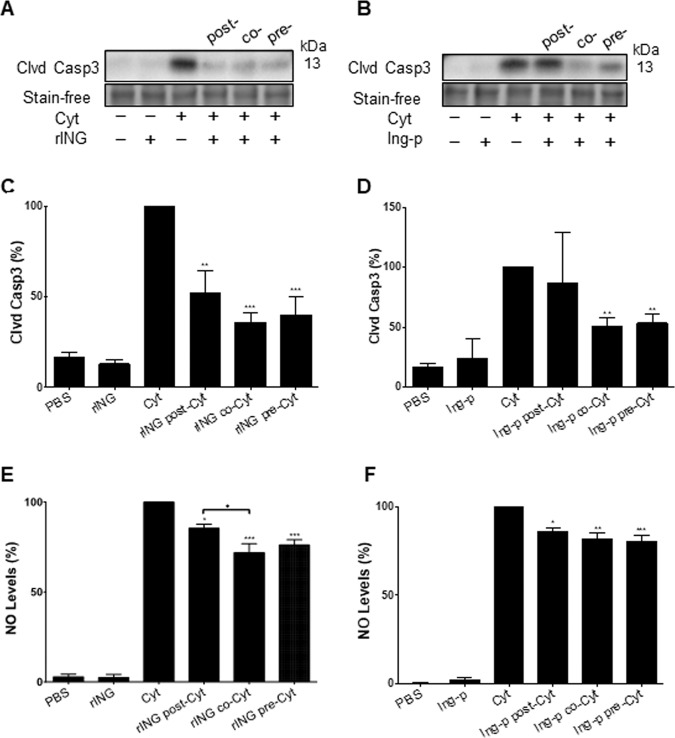
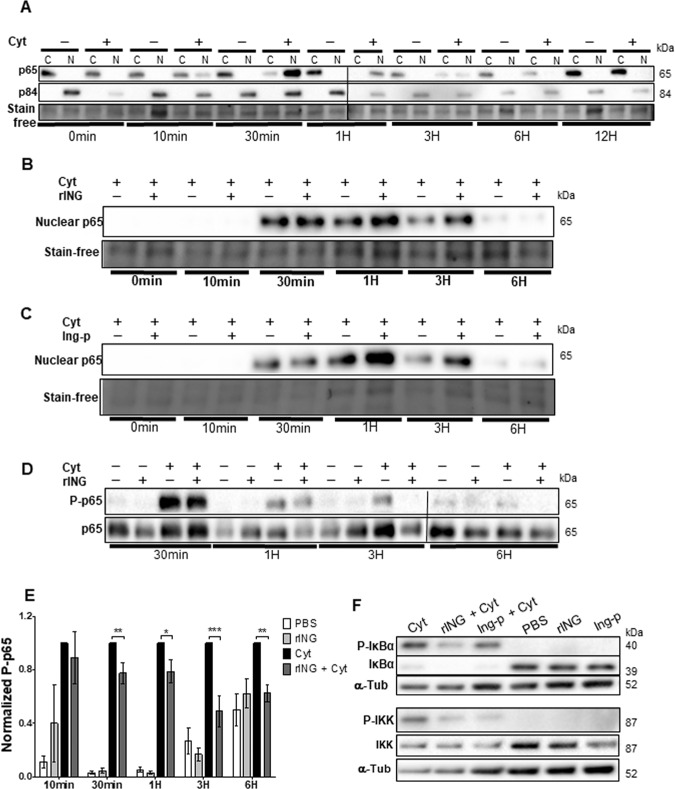
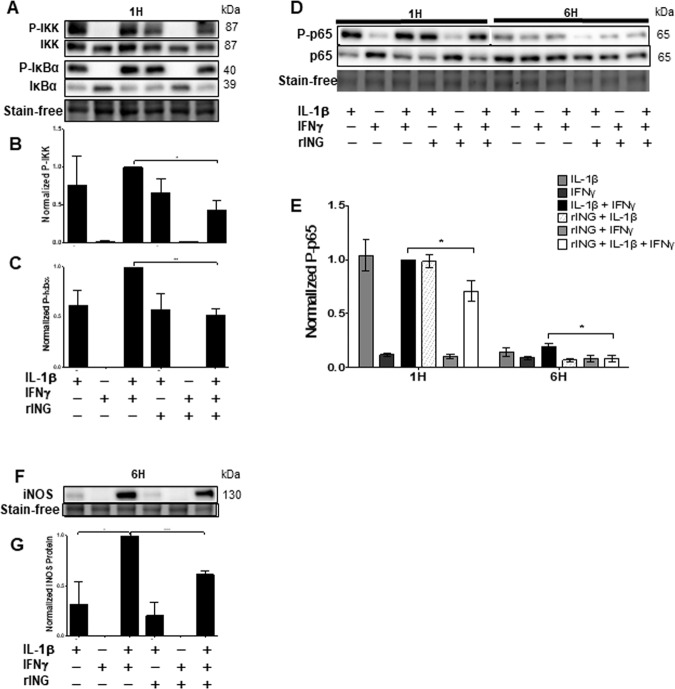
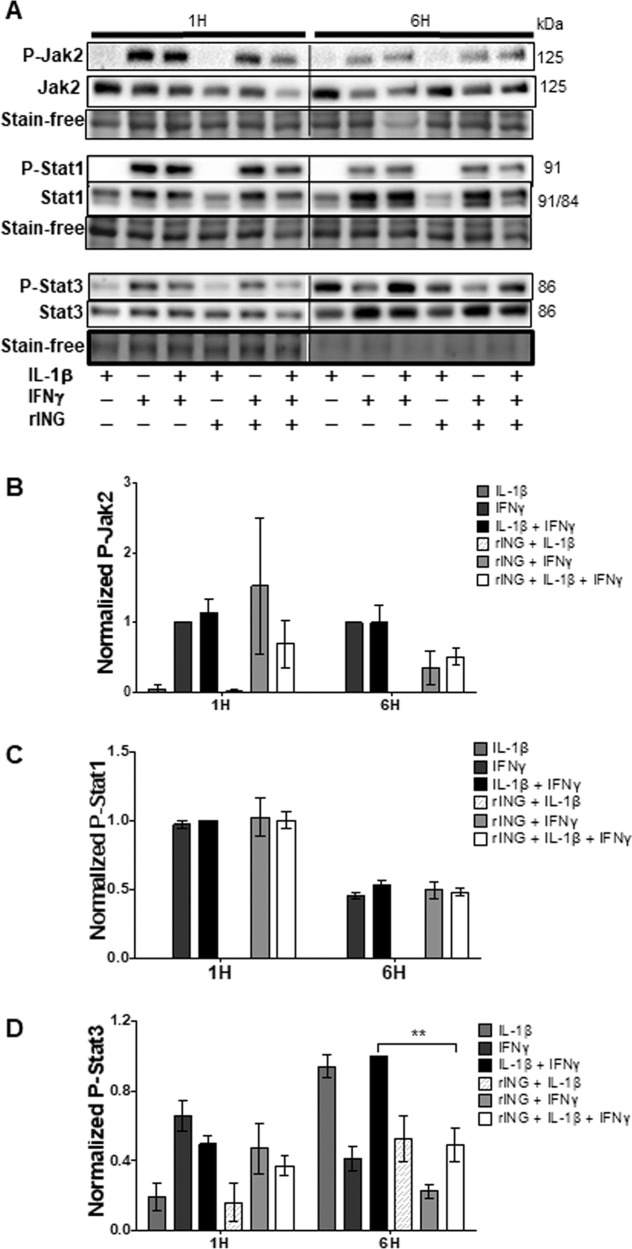
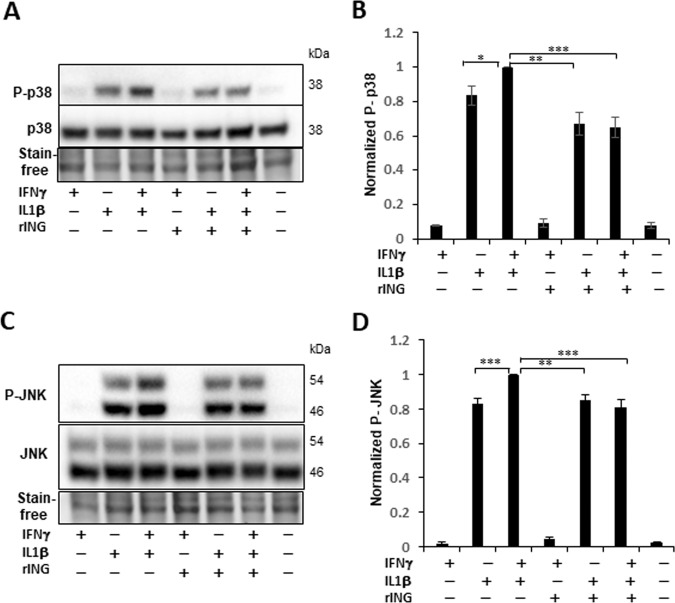
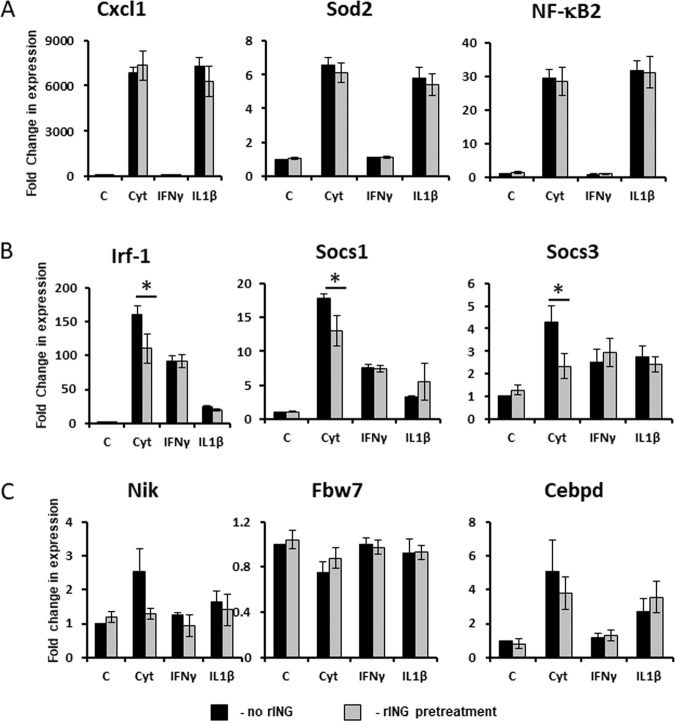
The goal of this study was to determine whether recombinant Islet NeoGenesis Associated Protein (rINGAP) and its active core, a pentadecapeptide INGAP104-118 (Ingap-p), protect β cells against cytokine-induced death. INGAP has been shown to induce islet neogenesis in diabetic animals, to stimulate β-cell proliferation and differentiation, and to improve islet survival and function. Importantly, Ingap-p has shown promising results in clinical trials for diabetes (phase I/II). However, the full potential of INGAP and its mechanisms of action remain poorly understood. Using rat insulinoma cells RINm5F and INS-1 treated with interleukin-1β (IL-1β) and interferon-gamma (IFN-γ), we demonstrate here that both rINGAP and Ingap-p inhibit apoptosis, Caspase-3 activation, inducible nitric oxide synthase (iNOS) expression and nitric oxide (NO) production, and explore the related signaling pathways. As expected, IL-1β induced nuclear factor kappa B (NF-κB), p38, and JNK signaling, whereas interferon-gamma (IFN-γ) activated the JAK2/STAT1 pathway and potentiated the IL-1β effects. Both rINGAP and Ingap-p decreased phosphorylation of IKKα/β, IkBα, and p65, although p65 nuclear translocation was not inhibited. rINGAP, used for further analysis, also inhibited STAT3, p38, and JNK activation. Interestingly, all inhibitory effects of rINGAP were observed for the cytokine cocktail, not IL-1β alone, and were roughly equal to reversing the potentiating effects of INFγ. Furthermore, rINGAP had no effect on IL-1β/NF-κB-induced gene expression (e.g., Ccl2, Sod2) but downregulated several IFNγ-stimulated (Irf1, Socs1, Socs3) or IFNγ-potentiated (Nos2) genes. This, however, was observed again only for the cytokine cocktail, not IFNγ alone, and rINGAP did not inhibit the IFNγ-induced JAK2/STAT1 activation. Together, these intriguing results suggest that INGAP does not target either IL-1β or IFNγ individually but rather inhibits the signaling crosstalk between the two, the exact mechanism of which remains to be investigated. In summary, our study characterizes the anti-inflammatory effects of INGAP, both protein and peptide, and suggests a new therapeutic utility for INGAP in the treatment of diabetes.


Conflict of interest statement

The authors declare no competing interests.

Figures

Fig. 1
Fig. 1. INGAP pre-treatment partially inhibits cytokine cytotoxicity in RINm5F β cells.
Cells were pre-treated for 2 h with 1 nM rINGAP or 1.67 μM Ingap-p and exposed to cytokines 100 pg/mL IL-1β and 1 ng/mL IFNγ. A Metabolic activity was assessed by MTT assay after 24, 48, and 72 h of cytokine treatment. Values were normalized to vehicle control (PBS) and expressed as fold change. All data represent the mean of at least three independent experiments ± SEM *p < 0.05 and **p < 0.01 vs. time-matched treatment with cytokine alone; multiple t test comparisons corrected by the Sidak–Bonferroni method. Here and thereafter rINGAP and Ingap-p are shortened to rING and Ing-p, respectively. B, C Assessment of apoptosis by Annexin-V/PI staining after 48 h of cytokine treatment. B Representative dot plots of FITC-fluorescence (x axis) versus PI-fluorescence (y axis) are shown. Quadrant representation: lower left, live cells; lower right, early apoptotic cells; upper left, necrotic cells; upper right, late apoptotic and necrotic cells. C Percentage of total apoptotic cells was determined by summation of lower and upper right quadrants and represented as bar graphs. ***P < 0.001 vs. treatment with cytokine alone; one-way ANOVA with Bonferroni corrected multiple comparisons. DG Level of caspase-3 assessed by Western blot. D, F Representative stain-free blots of cell lysates after 24 and 48 h cytokine treatment. E, G Densitometric analysis presented as relative quantities of cleaved caspase-3 normalized to total lane protein and expressed as fold change. All data represent the mean of at least three independent experiments ± SEM *p < 0.05 and ***p < 0.001 vs. time-matched treatment with cytokines only; multiple t test comparisons corrected by the Sidak–Bonferroni method.
Fig. 2
Fig. 2. INGAP pre-treatment decreases cytokine-induced Nos2 expression and NO production in RINm5F cells.
RINm5F cells were pre-treated with 1 nM rINGAP or 1.67 μM Ingap-p for 2 h prior to exposure to cytokines for 6 h. A Nos2 mRNA was assessed by qRT-PCR using the ΔΔCt method and normalized to cytokines only (=1). B, C Assessment of iNOS protein by Western blot: B Representative stain-free blots of cell lysates after 6 h cytokine exposure; C densitometric analysis presented as relative quantities of iNOS normalized to total lane protein and expressed as fold change. D NO levels in culture medium were assessed by Griess assay after 24 and 48 h. Data were normalized to cytokines only treatment and expressed as a percentage. *P < 0.05, **p < 0.01, ***p < 0.001 vs. treatment with cytokines only; A, C one-way ANOVA with Bonferroni corrected multiple comparisons; D two-way ANOVA with Bonferroni corrected multiple comparisons. Data represent the mean of at least three independent experiments ± SEM.
Fig. 3
Fig. 3. Effects of INGAP administration timing on cytokine-induced β-cell death.
1 nM rINGAP or 1.67 μM Ingap-p were administered: 2 h pre- or post-cytokines, or simultaneously with cytokines (co-treatment); AD levels of cytokine-induced cleaved caspase-3 as a measure of apoptosis were determined by Western blot. A, B Shown are representative stain-free blots of cell lysates treated with rINGAP and Ingap-p, respectively, and C, D densitometric analysis presented as relative quantities of cleaved caspase-3 normalized to total lane protein and expressed as a percentage. *P < 0.05, **p < 0.01, and ***p < 0.001 vs. treatment with cytokines only; one-way ANOVA with Bonferroni corrected multiple comparisons and multiple t test comparisons corrected by the Sidak–Bonferroni method. E, F Levels of nitric oxide production were measured by Griess assay in RINm5F cells after 48 h cytokine exposure when E timing of 1 nM rINGAP or F timing of Ingap-p was varied. Values were normalized to cytokines only and expressed as a percentage. **P < 0.01 and ***p < 0.001 vs. treatment with cytokine alone; & ♦p < 0.05 vs. treatment with rINGAP post cytokines; one-way ANOVA with Bonferroni corrected multiple comparisons and multiple t test comparisons corrected by the Sidak–Bonferroni method. All data represent the mean of at least three independent experiments ± SEM.
Fig. 4
Fig. 4. Effect of INGAP pre-treatment on cytokine-induced p65 nuclear translocation and phosphorylation.
RINm5F cells were treated with cytokines ± INGAP in the time-course experiments followed by extraction of cytoplasmic (C) and nuclear (N) proteins AC or total proteins DF and analyzed by Western blot. Shown are representative stain-free blots of subcellular lysates from cells treated with cytokines compared with A PBS; B rINGAP; and C Ingap-p. p84 was included as a loading control for nuclear fractions and total protein was used as a loading control for all samples. D p65 phosphorylation (P-p65) in cell lysates during time-course treatment of 6 h. E Densitometric analysis of each time point; values presented as P-p65 normalized to total lane protein and expressed as fold change over cytokines only. Data expressed as means ± SEM *P < 0.05, **p < 0.01, ***p < 0.001 vs time-matched cytokine cocktail; multiple t test comparisons corrected by the Sidak–Bonferroni method. F Analysis of IKK and IκBα phosphorylation after 1 h exposure to cytokines. Tubulin was used as a loading control. All data are representations from three independent experiments.
Fig. 5
Fig. 5. rINGAP pre-treatment inhibits NF-κB signaling when IL-1β and IFNγ used together but not individually.
RINm5F cells were pre-treated with 1 nM rINGAP for 2 h and then exposed to 100 pg/mL IL-1β, 1 ng/mL IFNγ, or a cocktail of both. Equal amounts of protein were resolved on stain-free SDS-PAGE and analyzed by Western blot to assess changes in: A phospho(P)-IKK, and phospho(P)-IκBα, with densitometric analysis shown in B and C, respectively; D, E phospo(P)-p65 and F, G iNOS. Shown are representative blots from three independent experiments. Densitometric data in B, C and E are presented as relative quantities of phosphorylated/total protein ratio normalized to total lane protein and expressed as fold change of cytokine cocktail. G Values for iNOS were normalized by total lane protein and are shown as fold change of cytokines. Data expressed as means ± SEM *P < 0.05, **p < 0.01, ***p < 0.001 vs time-matched cytokine cocktail; multiple t test comparisons corrected by the Sidak–Bonferroni method.
Fig. 6
Fig. 6. Effects of rINGAP on Jak2/Stat1/Stat3 phosphorylation in RINm5F treated with cytokines IL-1β, IFNγ individually, and in combination.
RINm5F cells were pre-treated with 1 nM rINGAP for 2 h and then exposed to 100 pg/mL IL-1β, 1 ng/mL IFNγ, or a cocktail of both for 1 or 6 h. Equal amounts of protein were resolved on stain-free SDS-PAGE and Western blot analysis was used to assess changes in phosphorylation of Jak2, Stat1, and Stat3. A Shown are representative blots from three independent experiments and B–D densitometric analysis presented as relative quantities of phosphorylated/total protein ratio normalized to total lane protein and expressed as fold change of cytokines only. Values expressed as means ± SEM **P < 0.01 vs time-matched cytokine cocktail; multiple t test comparisons corrected by the Sidak–Bonferroni method.
Fig. 7
Fig. 7. rINGAP pre-treatment inhibits p38 and JNK activation when IL-1β used with IFNγ but not alone.
RINm5F cells were pre-treated with 1 nM rINGAP for 2 h and exposed to cytokines for 30 min. Lysates were resolved on stain-free SDS-PAGE and probed for: A, B P-(phospho)-p38 and C, D P-JNK followed by pan- p38 and JNK antibodies. A, C Shown are representative blots of eight experiments and B, D the results of densitometric analysis shown as a ratio of phospho/total protein relative to the cytokine cocktail. *P < 0.05, **p < 0.005, ***p < 0.001 (t test).
Fig. 8
Fig. 8. Effect of rINGAP on the expression of cytokine-stimulated genes.
Rinm5F cells were pre-treated with 1 nM rINGAP for 2 h and treated with cytokines, individually or in combination for 3 h and processed for RNA extraction and qRT-PCR. Experiments were repeated five times. Fold change in gene expression over control (PBS) was calculated with the CFX Manager Software 3.1 using three reference genes (Gapdh, β-actin, and α-tubulin). Target stability was within the range M < 0.5, CV < 0.25. *P < 0.05 vs PBS control: t test one-tailed, two-sample equal variance.

Similar articles

Cited by

References

    1. Atkinson M. A. The pathogenesis and natural history of type 1 diabetes. Cold Spring Harb. Perspect. Med.2, a007641 (2012). - PMC - PubMed
    1. Rhodes CJ. Type 2 diabetes-a matter of ß-cell life and death? Science. 2005;307:380–384. doi: 10.1126/science.1104345. - DOI - PubMed
    1. Imai Y, Dobrian AD, Morris MA, Nadler JL. Islet inflammation: a unifying target for diabetes treatment? Trends Endocrinol. Metab. 2013;24:351–360. doi: 10.1016/j.tem.2013.01.007. - DOI - PMC - PubMed
    1. Donath MY, Størling J, Maedler K, Mandrup-Poulsen T. Inflammatory mediators and islet β-cell failure: a link between type 1 and type 2 diabetes. J. Mol. Med. 2003;81:455–470. doi: 10.1007/s00109-003-0450-y. - DOI - PubMed
    1. de Luca C, Olefsky JM. Inflammation and insulin resistance. FEBS Lett. 2008;582:97–105. doi: 10.1016/j.febslet.2007.11.057. - DOI - PMC - PubMed