. 2021 Mar 17;12(1):1714.
doi: 10.1038/s41467-021-21976-w.

Acetylation of KLF5 maintains EMT and tumorigenicity to cause chemoresistant bone metastasis in prostate cancer

Affiliations

Acetylation of KLF5 maintains EMT and tumorigenicity to cause chemoresistant bone metastasis in prostate cancer

Baotong Zhang et al. Nat Commun. .

Abstract

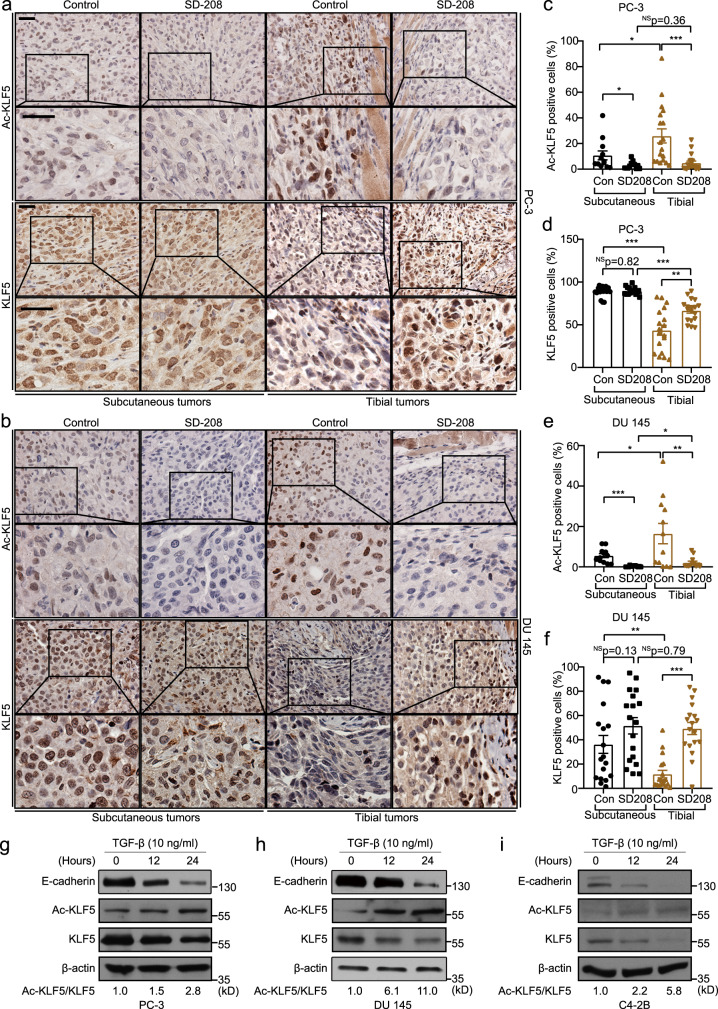
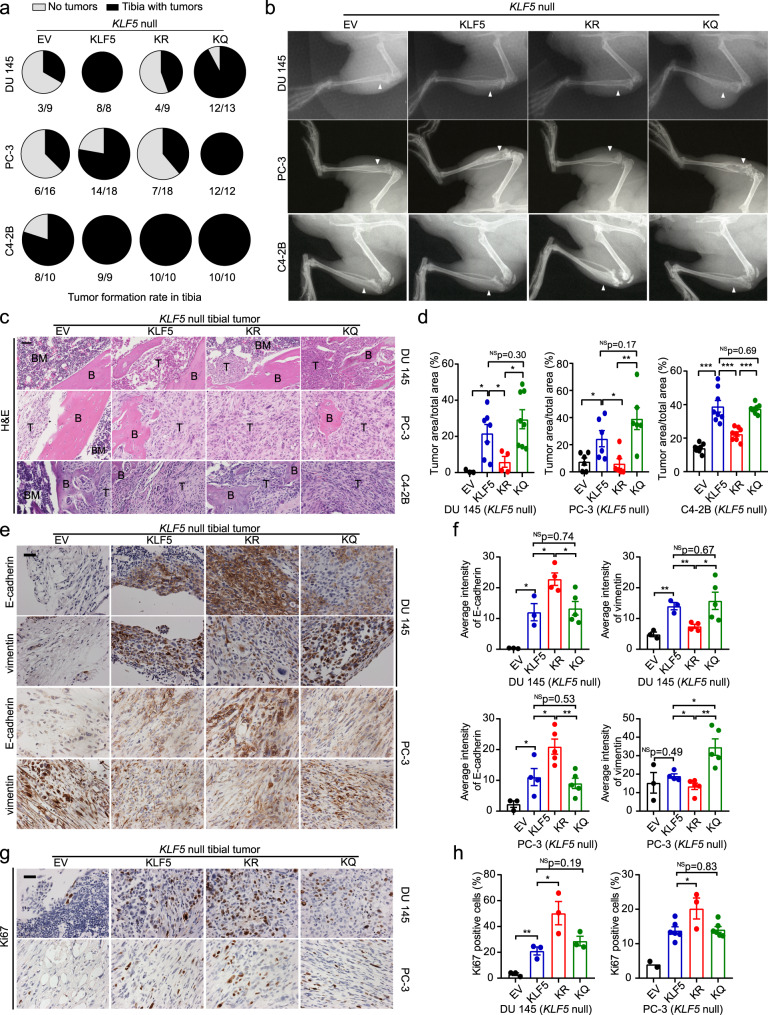
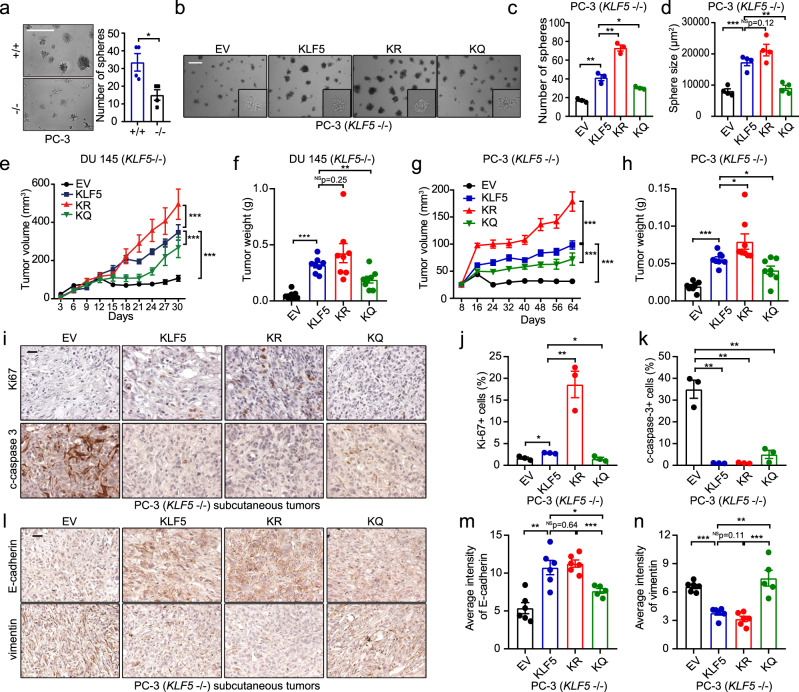
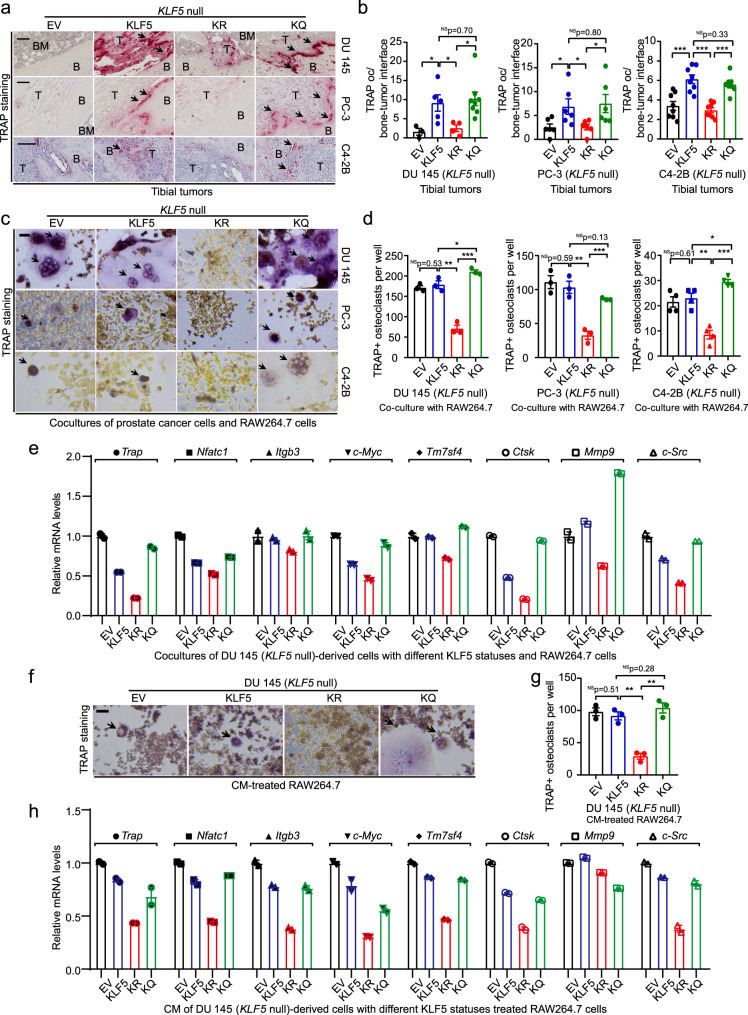
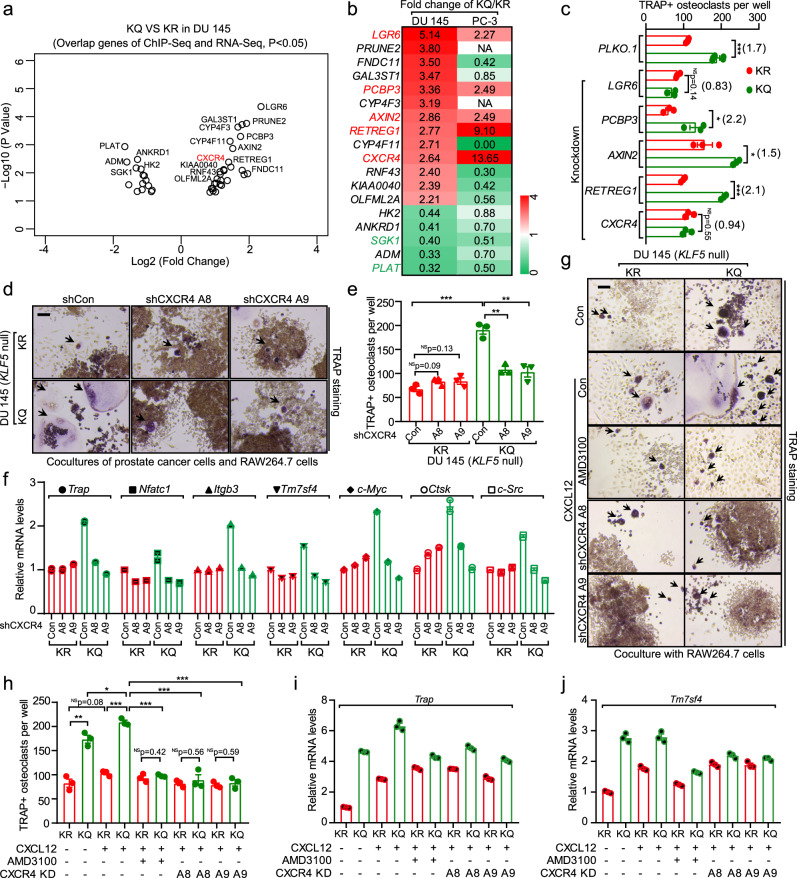
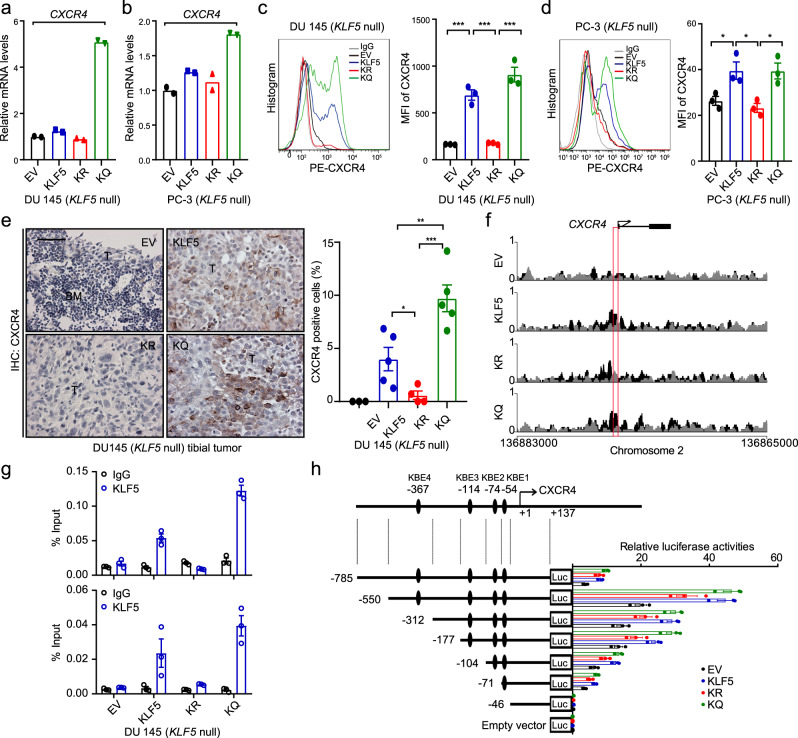
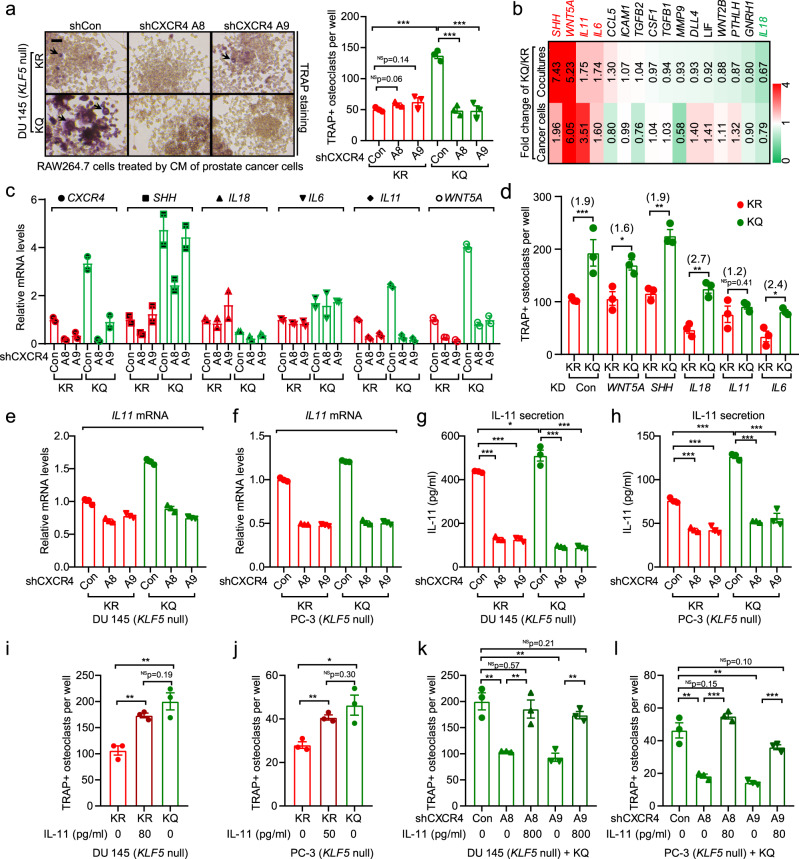
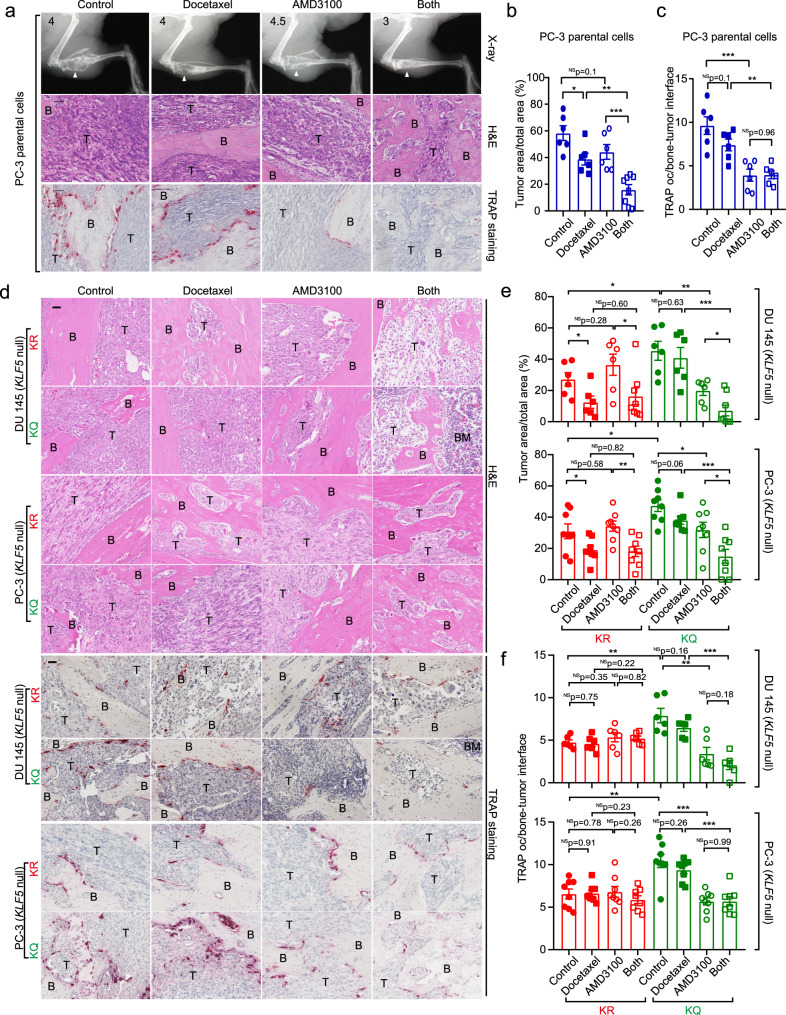
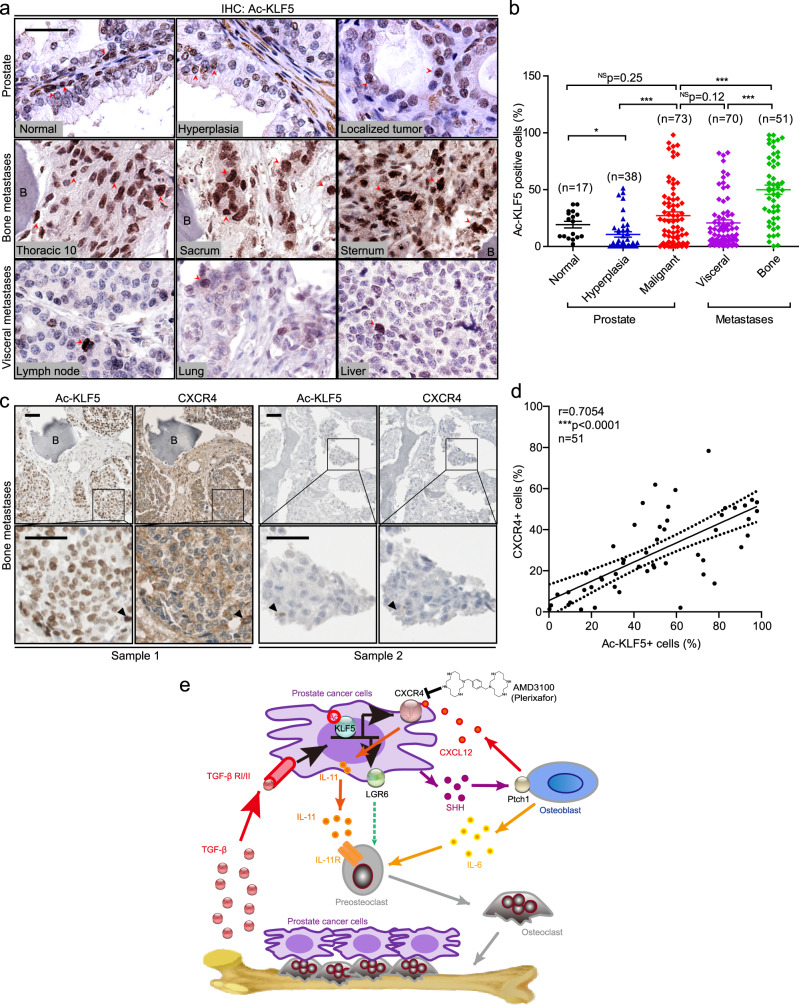
Advanced prostate cancer (PCa) often develops bone metastasis, for which therapies are very limited and the underlying mechanisms are poorly understood. We report that bone-borne TGF-β induces the acetylation of transcription factor KLF5 in PCa bone metastases, and acetylated KLF5 (Ac-KLF5) causes osteoclastogenesis and bone metastatic lesions by activating CXCR4, which leads to IL-11 secretion, and stimulating SHH/IL-6 paracrine signaling. While essential for maintaining the mesenchymal phenotype and tumorigenicity, Ac-KLF5 also causes resistance to docetaxel in tumors and bone metastases, which is overcome by targeting CXCR4 with FDA-approved plerixafor. Establishing a mechanism for bone metastasis and chemoresistance in PCa, these findings provide a rationale for treating chemoresistant bone metastasis of PCa with inhibitors of Ac-KLF5/CXCR4 signaling.


Conflict of interest statement

The authors declare no competing interests.

Figures

Fig. 1
Fig. 1. TGF-β enriched in the bone induces acetylation of KLF5 at K369.
a, b IHC staining of Ac-KLF5 and KLF5 in subcutaneous and tibial tumors of PC-3 cells (a) and DU 145 cells (b) from mice treated with the SD-208 TGF-β inhibitor (50 mg/kg/day). Scale bars, 50 μm. cf Statistical analysis of the IHC images in a and b by calculating the percentages of Ac-KLF5 (c, e) or KLF5 (d, f) positive cells in subcutaneous and tibial tumors of PC-3 (c, d) or DU 145 (e, f) cells, as counted by Fiji software. For each condition in cf, three tumors from three mice were used, and n = 18 different images from the three tumors were analyzed, except for Ac-KLF5 in subcutaneous PC-3 and DU 145 tumors and tibial DU 145 tumors, where n = 12 different images were used. Scatter bars in black indicate subcutaneous tumors and those in brown indicate tibial tumors. gi Detection of indicated proteins by western blotting in whole cell lysates of TGF-β treated PC-3 (g), DU 145 (h), and C4-2B (i) cells in in vitro two-dimentional culture. The ratio of Ac-KLF5 to total KLF5 is indicated below the blots. Western blotting assays were repeated at least twice and consistent results were achieved as shown in Supplementary Fig. 1j. In panels cf, data are shown in mean ± S.E.M. *p < 0.05; **p < 0.01; ***p < 0.001; NS not significant (two-tailed Student’s t test). Source data are provided as a Source Data file.
Fig. 2
Fig. 2. Acetylation of KLF5 promotes cancer cell-induced bone metastatic lesions while maintaining the mesenchymal phenotype of cancer cells.
a, b Bone metastatic growth of PCa cells (DU 145, PC-3, and C4-2B) expressing different forms of KLF5, including tumor formation rate (a) and radiographs (b) at 5 weeks (DU 145 and PC-3) or 12 weeks (C4-2B) after tibial inoculation of cells. PCa cells with KLF5 knockout (KLF5 null) were infected with lentiviruses to express empty vector (EV), wild-type KLF5 (KLF5), KLF5K369R (KR), and KLF5K369Q (KQ). White arrows point to bone lesion areas. c H&E staining of tibial tumor samples from PCa cells with indicated forms of KLF5. B trabecular bone regions, BM bone marrow regions, T tumor regions. d Statistical analysis of the images in c by calculating the ratio of tumor area to total sample area of DU 145 (left), PC-3 (middle), and C4-2B (right) cells with different forms of KLF5 in bone. For DU 145 cells, n = 3, 7, 4, and 8 tumors for EV, KLF5, KR, and KQ respectively. For PC-3 cells, n = 6 tumors for each group. For C4-2B cells, n = 8 tumors for each group. e, f IHC staining (e) and intensity quantification (f) of epithelial marker E-cadherin and mesenchymal marker vimentin in tibial tumors of DU 145 and PC-3 cells with different forms of KLF5. For DU 145 cells, n = 3, 3, 4, and 5 tumors for EV, KLF5, KR, and KQ respectively. For PC-3 cells, n = 3, 4, 5, and 5 tumors for EV, KLF5, KR, and KQ respectively. g, h IHC staining (g) and signal intensity quantification (h) of proliferation marker Ki67 in tibial tumors of DU 145 (Left) and PC-3 (right) cells. n = 3 tumors for each group of PC-3 cells. For DU 145 cells, n = 2, 6, 3, and 6 tumors for EV, KLF5, KR, and KQ respectively. One representative field per tumor was used for statistical analysis in eh. Scale bar, 50 μm. In panels d, f, and h, data are shown in mean ± S.E.M. NS not significant; *p < 0.05; **p < 0.01 (two-tailed Student’s t test). The Fiji software was used to quantify staining signal intensities in panels f and h. Source data are provided as a Source Data file.
Fig. 3
Fig. 3. KLF5 is essential for subcutaneous tumor growth, but KLF5KQ is weaker while KLF5KR is stronger than KLF5 in their tumorigenic activities.
a Deletion of KLF5 inhibited sphere formation in PC-3 cells. +/+, KLF5 wildtype; −/−, KLF5 null. Numbers of spheres in four different wells were analyzed. bd Expression of wild-type KLF5 (KLF5), KLF5KR (KR), or KLF5KQ (KQ) rescued sphere formation but with different efficiencies, as indicated by representative images (b), numbers (c), and sizes (d) of spheres. EV empty vector. Scale bars in a and b, 500 μm. Three different wells were analyzed for sphere numbers in c, and four randomly selected spheres were used for analyzing size in d for each condition. eh Subcutaneous tumor growth of DU 145 (e, f) and PC-3 (g, h) cells with different forms of KLF5, as indicated by tumor volumes at different times (e, g) and tumor weights at excision (f, h). Each group had eight tumors. ik Detection of Ki67 and cleaved caspase 3 by IHC staining (i) and quantitative analyses of Ki67 (j) and cleaved caspase 3 (c-caspase-3) (k) positive rates in tumor xenografts of PC-3 cells. n = 3 tumors for each group. ln IHC staining (l) and quantification of average staining intensities (m, n) of epithelial markers E-cadherin and mesenchymal marker vimentin in PC-3 tumor xenografts. n = 6 tumors for EV, KLF5, and KR groups and n = 5 tumors for the KQ group. IHC staining intensities were quantified with the Fiji software. Scale bars in i and l, 50 μm. In panels c, d, f, h, j, k, m, n, data are shown in mean ± S.E.M. NS not significant; *p < 0.05; **p < 0.01; ***p < 0.001 (two-tailed Student’s t test). In panels e and g, ***p < 0.001 (two-way ANOVA tests). Source data are provided as a Source Data file.
Fig. 4
Fig. 4. Acetylation of KLF5 in PCa cells promotes osteoclast differentiation.
a, b Staining of TRAP (a) and TRAP occurrence rates at the bone-tumor interface of bone samples bearing DU 145 (b, left), PC-3 (b, middle), and C4-2B (b, right) cancer cells with different acetylation statuses of KLF5. Black arrows in panel a indicate TRAP occurrence at the interface of bone and tumor areas (marked by B and T respectively). Scale bar in a, 100 μm. For DU 145 tibial tumors, EV, KLF5, KLF5KR (KR), and KLF5KQ (KQ) had 3, 5, 4, and 8  tumors respectively. For PC-3 tibial tumors, each group had six tumors. For C4-2B cells, n = 8 tumors for each group. c, d Differentiation of preosteoclast RAW264.7 cells into TRAP-positive osteoclasts after co-culturing with DU 145 (d, left), PC-3 (d, middle), and C4-2B (d, right) cells with different statuses of KLF5 acetylation, as indicated by TRAP staining (c, TRAP + multinucleated osteoclasts are marked by black arrows) and statistical analyses of TRAP + osteoclasts per well (d). n = 3 wells for each group in DU 145 and PC-3 cells. n = 4 wells for each group in C4-2B cells. e Expression of markers for osteoclast differentiation, including Trap, Nfatc1, Itgb3, c-Myc, Tm7sf4, Ctsk, Mmp9, and c-Src, by real-time qPCR using mouse-specific primers in the co-cultures of RAW264.7 mouse pre-osteoclasts and DU 145 cells with different forms of KLF5. f, g Staining of TRAP (f) and statistical analysis of TRAP + osteoclasts per well (g) in RAW264.7 pre-osteoclasts treated with CM from DU 145 cells with different forms of KLF5 for 6 days. Black arrows in f indicate TRAP + multinucleated osteoclast cells, and n = 3 wells for each group in g. h Detection of osteoclast differentiation markers in CM-treated RAW264.7 pre-osteoclasts by real-time qPCR. For both co-culture and CM treatment experiments, Rankl (20 ng/ml) was added to maintain a basal level of osteoclastogenesis. Scale bars in c and f, 50 μm. In panels b, d and g, data are shown in mean ± S.E.M. NS not significant; *p < 0.05; **p < 0.01; ***p < 0.001 (two-tailed Student’s t test). Source data are provided as a Source Data file.
Fig. 5
Fig. 5. Identification of CXCR4 as a functional effector of acetylated KLF5 in the induction of osteoclast differentiation.
a Differentially expressed genes between KLF5KQ- expressing (KQ) and KLF5KR-expressing (KR) DU 145 cells, as identified by ChIP-Seq and RNA-Seq analyses and illustrated by a volcano diagram according to their p-values and fold changes in RNA-Seq. Circles indicate genes whose promoter regions (−2500 to +500) had binding peaks in the ChIP-Seq assay. Details are available in Supplementary data 7. b Heatmap of genes in panel a with fold changes between KQ and KR in both DU 145 and PC-3 cells, as revealed by RNA-Seq analysis. Each rectangle is colored and the intensity is defined by the fold change of the gene expression levels in KQ versus KR cells. Red and green indicate upregulation and downregulation, respectively. Gene names in red and green indicate genes that are upregulated and downregulated, respectively, by KQ in both cell lines. c Functional screening for genes that mediate osteoclast differentiation induced by KLF5KQ (KQ)-expressing cells. Each of the KQ-upregulated genes from panel b was knocked down by a mixture of 2 or 3 shRNAs, each of which was confirmed to efficiently knock down its target gene, in both KQ and KR cells, and then co-cultured with RAW264.7 pre-osteoclasts. TRAP was stained to measure osteoclast differentiation. Numbers in parentheses indicate fold changes of TRAP + osteoclast numbers between KQ and KR. n = 5 wells for control shRNA PLKO.1 and n = 3 wells for other shRNAs. d, e TRAP staining (d) and statistical analyses of TRAP + osteoclasts (e) in co-cultures of KR- or KQ-expressing DU 145 cells with RAW264.7 pre-osteoclasts in the presence of 20 ng/ml Rankl for 6 days. Black arrows indicate TRAP + multinucleated osteoclasts. A8 and A9 are two different CXCR4 shRNAs. n = 3 wells per group in e. f Knockdown of CXCR4 selectively suppresses the expression of markers for osteoclast differentiation in KQ cells, as detected by real-time qPCR. g, h TRAP staining (g) and statistical analyses of TRAP + osteoclasts (h) in co-cultures of RAW264.7 and KR- or KQ-expressing DU 145 cells with inhibition of CXCR4 by either the AMD3100 inhibitor (500 ng/ml) or shRNAs (A8 and A9). The CXCR4 agonist ligand CXCL12 (100 ng/ml) was added as indicated. n = 3 wells per group in h. i, j Expression of osteoclast differentiation markers Trap (i) and Tm7sf4 (j) was detected by real-time qPCR in co-cultures from panel g. Scale bar, 100 μm. In panels c, e and h, data are shown in mean ± S.E.M. NS not significant; *p < 0.05; **p < 0.01; ***p < 0.001 (two-tailed Student’s t test). Source data are provided as a Source Data file.
Fig. 6
Fig. 6. Acetylation of KLF5 activates the transcription of CXCR4 in PCa cells.
ad Expression of CXCR4, as detected by real-time qPCR (a, b) and flow cytometry (c, d), in DU 145 cells (a, c) and PC-3 cells (b, d) expressing different forms of KLF5 in in vitro 2-dimentiomal cultures. MFI mean fluorescent intensity. Experiments were performed in duplicate for real-time qPCR (a, b) and in triplicate for flow cytometry (c, d). See more details of panels c and d in Supplementary Fig. 8a. e IHC staining of CXCR4 in tumor-bearing bone samples. Rates of CXCR4-positive cells are shown at the right. BM bone marrow region, T tumor region. Scale bar, 50 μm. n = 3, 5, 4, and 5 tumors for EV, KLF5, KR, and KQ groups respectively. f, g A region in the CXCR4 promoter, indicated by a red box, is specifically bound by KLF5KQ (KQ) but not by KLF5KR (KR), as demonstrated by ChIP-Seq analysis (f) and validated by ChIP-PCR with two different pairs of primers targeting the region (g). ChIP-PCR was performed in triplicate using in vitro two-dimentiomal cultures. h KQ is more potent than KR in the activation of CXCR4 promoter, as revealed by promoter-luciferase reporter assay of different CXCR4 promoter regions. Black ellipse, putative KLF5 binding motifs (KB) predicted by the oPROF web-based software. +1, transcription start site. Promoter-luciferase reporter assay was performed in triplicate. In panels ce, data are shown in mean ± S.E.M. *p < 0.05; **p < 0.01; ***p < 0.001 (two-tailed Student’s t test). Source data are provided as a Source Data file.
Fig. 7
Fig. 7. Acetylation of KLF5 activates CXCR4 to promote osteoclastogenesis by increasing IL-11 secretion.
a Knockdown of CXCR4 attenuates KLF5KQ-induced osteoclastogenesis via paracrine signaling. Preosteoclast RAW264.7 cells were treated with CM from KLF5KR (KR)- or KLF5KQ (KQ)-expressing DU 145 cells with or without CXCR4 knockdown, and TRAP was stained to indicate osteoclast differentiation. A8 and A9 are two different CXCR4 shRNAs. Scale bar, 100 μm. Black arrows indicate TRAP + multinucleated osteoclasts. n = 3 wells for statistical analysis. b Screening for paracrine factors upregulated by KQ but not by KR using real-time qPCR in either KQ/KR-expressing DU 145 cells or their co-cultures with RAW264.7 cells. Each rectangle is colored and the intensity is defined by the fold change of the gene expression levels in KQ versus KR cells. Red and green indicate upregulation and downregulation, respectively. c Expression changes of IL11 but not the other 4 KQ-regulated cytokines, including SHH, IL18, IL6, and Wnt5A respond to CXCR4 knockdown, as revealed by real-time qPCR in co-cultures of KQ- or KR-expressing DU 145 cells with RAW264.7 pre-osteoclasts. d Knockdown of IL11 but not the other four KQ-upregulated cytokines attenuated osteoclastogenesis promoted by KQ, as indicated by TRAP staining in co-cultures of RAW264.7 cells and KQ- or KR-expressing PCa cells with the knockdown of different cytokines. PLKO.1 is the empty vector control for knockdown. Numbers in parentheses indicate fold changes in TRAP + osteoclasts between KQ and KR groups. n = 3 wells per group for statistical analysis. eh Detection of IL-11 expression by real-time qPCR (e, f) and ELISA (g, h) in KR- or KQ-expressing DU 145 (e, g) and PC-3 (f, h) cells with or without CXCR4 knockdown. Experiments were performed in triplicate. i, j Addition of IL-11 rescued the decrease in osteoclast differentiation of RAW264.7 cells by the CM from DU 145 (i) and PC-3 (j) cells that express KR. k, l Addition of IL-11 rescued the decrease in osteoclast differentiation of RAW264.7 cells by the CM from DU 145 (k) and PC-3 (l) cells that express KQ with the knockdown of CXCR4. n = 3 wells for statistical analysis. In panels a, d, gl, data are shown in mean ± S.E.M. NS not significant; *p < 0.05; **p < 0.01; ***p < 0.001 (two-tailed Student’s t test). Source data are provided as a Source Data file.
Fig. 8
Fig. 8. Inhibition of CXCR4 enhances the therapeutic effect of docetaxel on Ac-KLF5-induced bone metastatic lesions.
a X-ray radiographs (up), H&E staining (middle), and TRAP staining (down) of tibias at 40 days after inoculation of PC-3 parental cells into the tibias. White arrows point to areas of bone lesions. Numbers at the top-left corner of X-ray radiographs are the Average Bone Lesion Score (ABLS) based on the degree of osteolysis. b The ratio of tumor area to total sample area of PC-3 parental cells in tibias under docetaxel and/or AMD3100 treatment. n = 6 tumors for the control or single treatment group and n = 8 tumors for the combined treatment group. c Statistical analyses of TRAP occurrence (oc) at the bone-tumor interface in bone samples bearing PC-3 parental cells treated with docetaxel and/or AMD3100. n = 6 tumors per group. d H&E staining (upper) and TRAP staining (lower) of tibias at 38 days (DU 145) or 43 days (PC-3) after inoculation of cells expressing KLF5KR (KR) or KLF5KQ (KQ). e The ratio of tumor area to total sample area of DU 145 (upper) and PC-3 (lower) cells expressing KLF5KR (KR) or KLF5KQ (KQ) in tibias under the treatments of docetaxel and/or AMD3100. For DU 145, n = 6 tumors for the control or single treatment group and n = 8 tumors for the combined treatment group. For PC-3, n = 8 tumors for each group. f Statistical analyses of TRAP occurrence (oc) at the bone-tumor interface in bone samples bearing DU 145 (up) and PC-3 (down) cells expressing different forms of KLF5 treated with docetaxel and/or AMD3100. For DU 145, n = 6 tumors per group. For PC-3, n = 8 tumors per group. B trabecular bone region, BM bone marrow region, T tumor region. Scale bar, 50 μm. Treatments with docetaxel (10 mg/kg twice a week via i.p.) and/or AMD3100 (3.5 mg/kg/day via i.p.) started at day 11 after tumor inoculation. Representative images shown in a and d are statistically analyzed in b, c and e, f, respectively. In panels b, c, e and f, data are shown in mean ± S.E.M. NS not significant; *p < 0.05; **p < 0.01; ***p < 0.001 (two-tailed Student’s t test). Source data are provided as a Source Data file.
Fig. 9
Fig. 9. Acetylated KLF5 is upregulated and positively correlated with CXCR4 in bone metastases of PCa.
a Representative images of IHC staining of Ac-KLF5. Red arrows indicate positive Ac-KLF5 staining. Scale bar, 50 μm. b Quantitative analyses of Ac-KLF5 expression in benign tissues, hyperplasia, and localized tumors of the prostate and metastases of PCa from both the visceral and bone tissues. Numbers of samples (n) are indicated in the figure. Data are shown in mean ± S.E.M. NS not significant; *p < 0.05; ***p < 0.001 (two-tailed Student’s t test). c Ac-KLF5 expression is positively correlated with CXCR4 expression in bone metastases of PCa patients, as indicated by representative images of IHC staining in two bone metastasis samples. Black arrow heads indicate stronger Ac-KLF5 and CXCR4 staining in the same cells from consecutive sections. Scale bar, 50 μm. d Pearson analyses of the expression of Ac-KLF5 and CXCR4 in 51 bone metastasis samples of PCa patients. ***p < 0.0001. e A schematic depicting how acetylation of KLF5 leads to bone metastasis by promoting osteoclast differentiation via transcriptionally activating CXCR4, which in turn increases IL-11 secretion. Representative images shown in a and c are statistically analyzed in b and d, respectively. Source data are provided as a Source Data file.

Comment in

  • Uro-Science.
    Atala A. Atala A. J Urol. 2021 Nov;206(5):1319-1321. doi: 10.1097/JU.0000000000002153. Epub 2021 Aug 16. J Urol. 2021. PMID: 34392697 No abstract available.

References

    1. Siegel RL, Miller KD, Jemal A. Cancer statistics, 2019. CA Cancer J. Clin. 2019;69:7–34. doi: 10.3322/caac.21551. - DOI - PubMed
    1. Kirby M, Hirst C, Crawford ED. Characterising the castration-resistant prostate cancer population: a systematic review. Int. J. Clin. Pract. 2011;65:1180–1192. doi: 10.1111/j.1742-1241.2011.02799.x. - DOI - PubMed
    1. Gandaglia G, et al. Impact of the site of metastases on survival in patients with metastatic prostate cancer. Eur. Urol. 2015;68:325–334. doi: 10.1016/j.eururo.2014.07.020. - DOI - PubMed
    1. Bubendorf L, et al. Metastatic patterns of prostate cancer: an autopsy study of 1,589 patients. Hum. Pathol. 2000;31:578–583. doi: 10.1053/hp.2000.6698. - DOI - PubMed
    1. Himelstein AL, et al. Effect of longer-interval vs standard dosing of zoledronic acid on skeletal events in patients with bone metastases: a randomized clinical trial. JAMA. 2017;317:48–58. doi: 10.1001/jama.2016.19425. - DOI - PMC - PubMed

Publication types

MeSH terms