. 2021 Mar 17;11(1):6180.
doi: 10.1038/s41598-021-85434-9.

Adaptive constrained constructive optimisation for complex vascularisation processes

Affiliations

Adaptive constrained constructive optimisation for complex vascularisation processes

Gonzalo Daniel Maso Talou et al. Sci Rep. .

Abstract

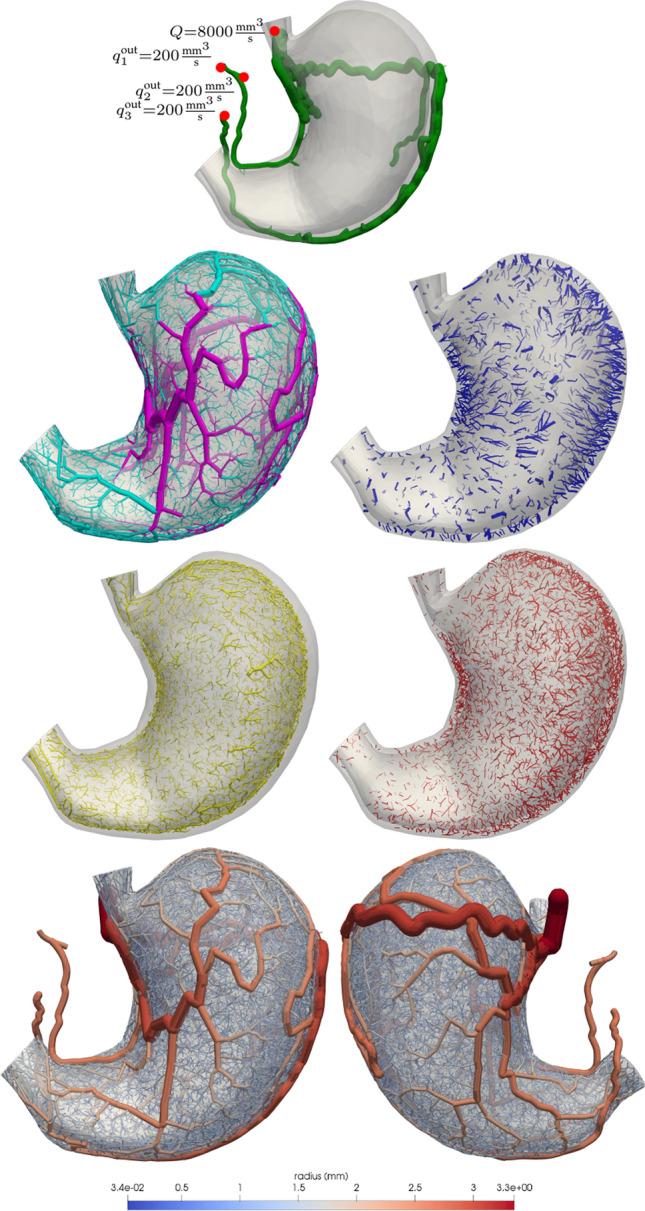
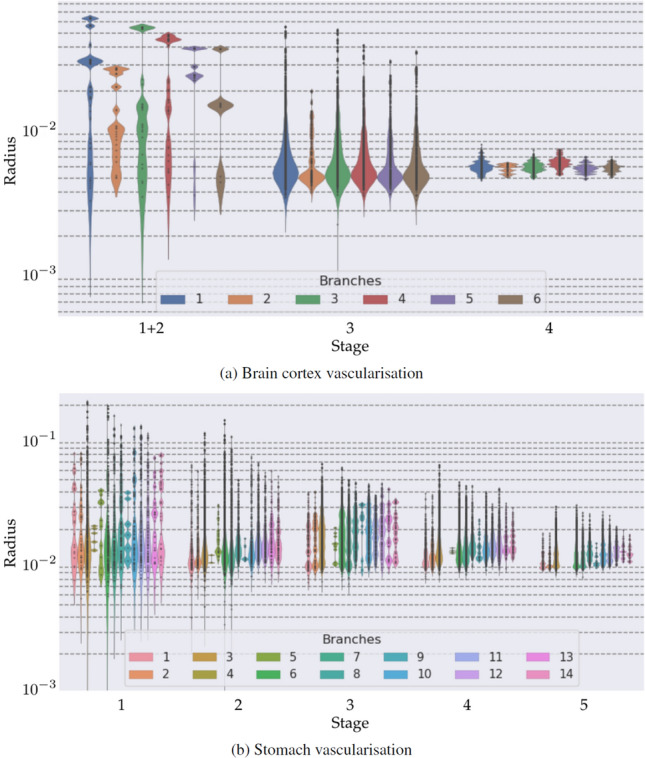
Mimicking angiogenetic processes in vascular territories acquires importance in the analysis of the multi-scale circulatory cascade and the coupling between blood flow and cell function. The present work extends, in several aspects, the Constrained Constructive Optimisation (CCO) algorithm to tackle complex automatic vascularisation tasks. The main extensions are based on the integration of adaptive optimisation criteria and multi-staged space-filling strategies which enhance the modelling capabilities of CCO for specific vascular architectures. Moreover, this vascular outgrowth can be performed either from scratch or from an existing network of vessels. Hence, the vascular territory is defined as a partition of vascular, avascular and carriage domains (the last one contains vessels but not terminals) allowing one to model complex vascular domains. In turn, the multi-staged space-filling approach allows one to delineate a sequence of biologically-inspired stages during the vascularisation process by exploiting different constraints, optimisation strategies and domain partitions stage by stage, improving the consistency with the architectural hierarchy observed in anatomical structures. With these features, the aDaptive CCO (DCCO) algorithm proposed here aims at improving the modelled network anatomy. The capabilities of the DCCO algorithm are assessed with a number of anatomically realistic scenarios.


Conflict of interest statement

The authors declare no competing interests.

Figures

Figure 1
Figure 1
Bifurcation optimisation strategy for Δv=6: (left) discretised domain to look for the optimal bifurcation point xb between vessel vj and the candidate terminal point xid; (right) new tree structure for optimal bifurcation point xb replacing vessel vj by vessels vp, vs and vnew in T. All black dots in the left image denote the set of potential bifurcation points. Images generated with Blender v2.8 available at https://www.blender.org/.
Figure 2
Figure 2
Different vascular architectures obtained using the staged growth paradigm. (a) Sequential vascular growth: blue vessels correspond to a pre-defined existing vascularisation T0, while red and grey ones correspond to trees T1 and T2, generated at stages S1 and S2. (b) Hierarchical vascular growth: (left) vascularisation obtained with a standard CCO algorithm with parameters Pgeo and Popt; (right) the first stage of the network is T1, grown in the annulus subdomain Ω1 (light grey), while the second stage is T2, the inner circular subdomain Ω2 (dark grey). (c) Scale-specific vascular growth: (left) vascularisation obtained with a standard CCO algorithm with δ=0.7; (right) vascularisation using three stages with with δ=0.7, 0.5 and 0.2 for T1 (blue vessels), T2 (grey vessels) and T3 (red vessels), respectively. Images generated with ParaView version 5.4 available at https://www.paraview.org/.
Figure 3
Figure 3
Concurrent vascularisation of circular and spherical domains with equiradial vessel inlets using: (left) volumetric cost criterion (standard CCO algorithm), S={Ω,Pgeo,Popt,T,1000,Fvol}; (centre) sprouting cost criterion, S={Ω,Pgeo,Popt,T,1000,Fsprout}; (right) 2-stage multi-criteria growing with S1={Ω,Pgeo,Popt,T,25,Fsprout} and S2={Ω,Pgeo,Popt,T,975,Fvol}. Parameters for central and right column cases are cv=0.5×10²,cp=0.5,cd=1.0 and cv=1.0×10⁴,cp=0.5,cd=1.0 for 2D and 3D cases, respectively, Pgeo={γ=3,δ=0} and Popt={ν=1.0,fr=0.9,fn=8,Δv=7}. Total vascular volume Fvol(T) is reported below each tree. Note that Fsprout preserves the initial balanced conditions of inlet vessel radii, while Fvol tends to benefit one inlet over the other. Images generated with ParaView version 5.4 available at https://www.paraview.org/.
Figure 4
Figure 4
Flow delivery using different probability distribution functions for xid generation: (first row) uniform distribution (standard CCO algorithm); (second row) Gaussian distribution xidN(μ,σ2) with μ=(0,0) and σ=(0.25,0.25); and (third row) Gaussian mixture of 2 distributions xid0.5N(μ1,σ12)+0.5N(μ2,σ22) with μ1=(0,0.5), σ1=(0.25,0.25), μ2=(0,-0.5) and σ2=(0.10,0.10). First column presents the generated tree while second column outlines the distribution of the tree terminals that are sampled from the probability distribution. The domain Ω is a circle of radius 1 centred at (0, 0) with positive axes pointing towards the right and upper directions. Images generated with ParaView version 5.4 available at https://www.paraview.org/.
Figure 5
Figure 5
Flow delivery in the presence of an outlet vessel vout with a prescribed outflow: (from left to right) tree initialisation, flow to be distributed is Q; vout flow is unconstrained, i.e., outlet carries the same flow than terminals inside the domain; vout flow is constrained to 0.5Q; and vout flow is constrained to 0.99Q. Images generated with ParaView version 5.4 available at https://www.paraview.org/.
Figure 6
Figure 6
Inner retinal vasculature generated by a two-staged growth process: (first row) initialisation T0; (second row) generated tree discriminating vessels given as initial conditions (blue), generated at the stage S1 (light blue) and stage S2 (red); (third row) variation of vessel radii along the generated network. Images generated with ParaView version 5.4 available at https://www.paraview.org/.
Figure 7
Figure 7
Grey matter vasculature in the superior frontal gyrus generated by a four-staged growth process: (first row) initial tree T0, illustrating the inflow and outflow constraints; (second row) from left to right, vessels corresponding to the pial network (T1T2), penetrating arterioles (T3) and deep arterioles (T4); (third row) superior-posterior part (left) and coronal slice at a middle section of the rostral-caudal axis (right), describing the architectural organisation of pial (red), penetrating (green) and deep (blue) vessels across the tissue; and (fourth row) final vascular tree depicting the vessel radius. Images generated with ParaView version 5.4 available at https://www.paraview.org/.
Figure 8
Figure 8
Stomach vasculature generated by a five-staged growth process: (first row) initial tree T0, including the inflow and outflow constraints; (second and third rows) from left to right and top to bottom, vessels corresponding to the serosa layer (T1T2), muscularis perforators (T3), mucosa layer (T4) and muscularis layer (T5); (bottom row) final vascular tree depicting the vessel radius from anterior and posterior views of the stomach. Images generated with ParaView version 5.4 available at https://www.paraview.org/.
Figure 9
Figure 9
Radius distribution of vessels generated at each stage. Each colour corresponds to a different vessel branched form the initial tree T0. Black dots in the violin indicate a sample value for the radius. First stages present a multimodal distribution in which larger radius modes correspond to vessels transporting blood to neighbour regions vascularised at another stage and smaller radius modes correspond to terminal and distribution vessels. Plots generated with Seaborn library version 0.11 available at https://seaborn.pydata.org/.
Figure 10
Figure 10
Comparison between standard CCO (left column) and the proposed DCCO (right column) methods. (Top) Initial vasculature; (middle) generated trees of 8000 terminal segments; (bottom) coronal slices at a middle section of the rostral-caudal axis. Images generated with ParaView version 5.4 available at https://www.paraview.org/.

References

    1. Olesen S-P, Claphamt D, Davies P. Haemodynamic shear stress activates a k+current in vascular endothelial cells. Nature. 1988;331:168–170. doi: 10.1038/331168a0. - DOI - PubMed
    1. Jain R. Determinants of tumor blood flow: a review. Cancer Res. 1988;48:2641–2658. - PubMed
    1. Navar L, et al. Paracrine regulation of the renal microcirculation. Physiol. Rev. 1996;76:425–536. doi: 10.1152/physrev.1996.76.2.425. - DOI - PubMed
    1. Dibona G, Kopp U. Neural control of renal function. Physiol. Rev. 1997;77:75–197. doi: 10.1152/physrev.1997.77.1.75. - DOI - PubMed
    1. Malek A, Alper S, Izumo S. Hemodynamic shear stress and its role in atherosclerosis. J. Am. Med. Assoc. 1999;282:2035–2042. doi: 10.1001/jama.282.21.2035. - DOI - PubMed

Publication types

LinkOut - more resources