. 2021 Jul;14(4):937-948.
doi: 10.1038/s41385-021-00393-8. Epub 2021 Mar 17.

Luminal microvesicles uniquely influence translocating bacteria after SIV infection

Affiliations

Luminal microvesicles uniquely influence translocating bacteria after SIV infection

Jacob K Flynn et al. Mucosal Immunol. 2021 Jul.

Abstract

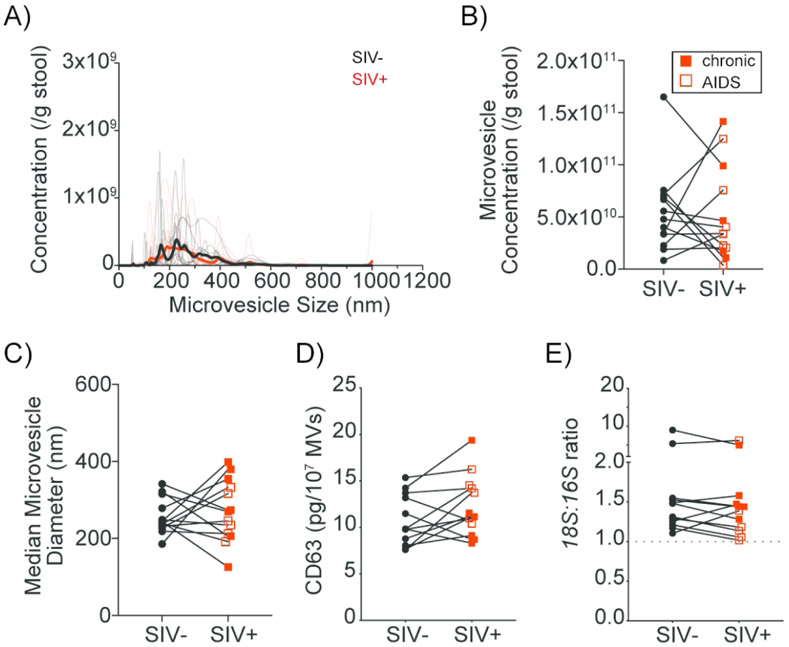
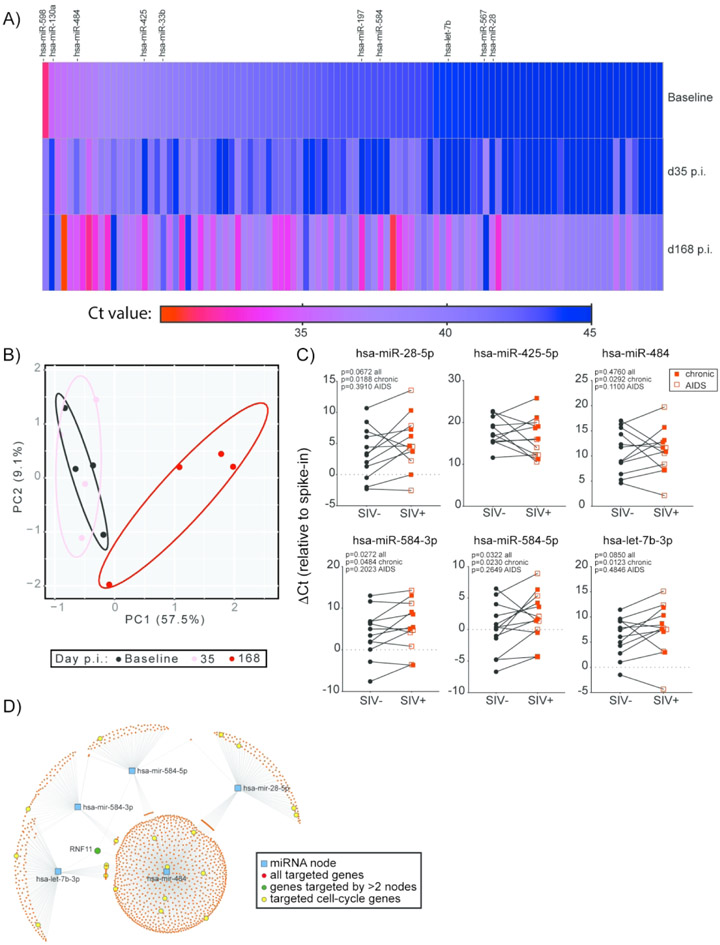
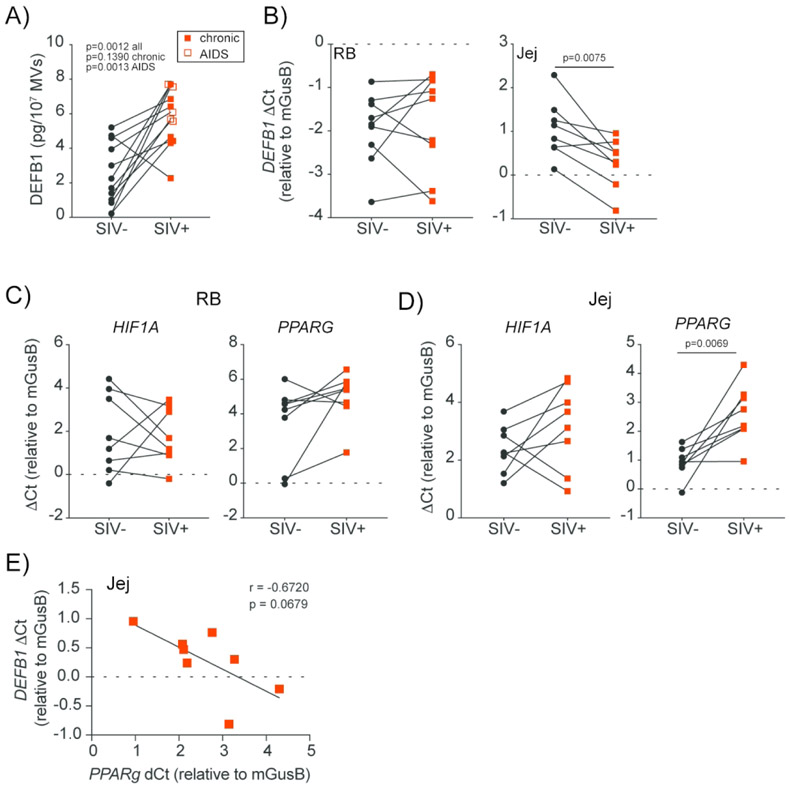
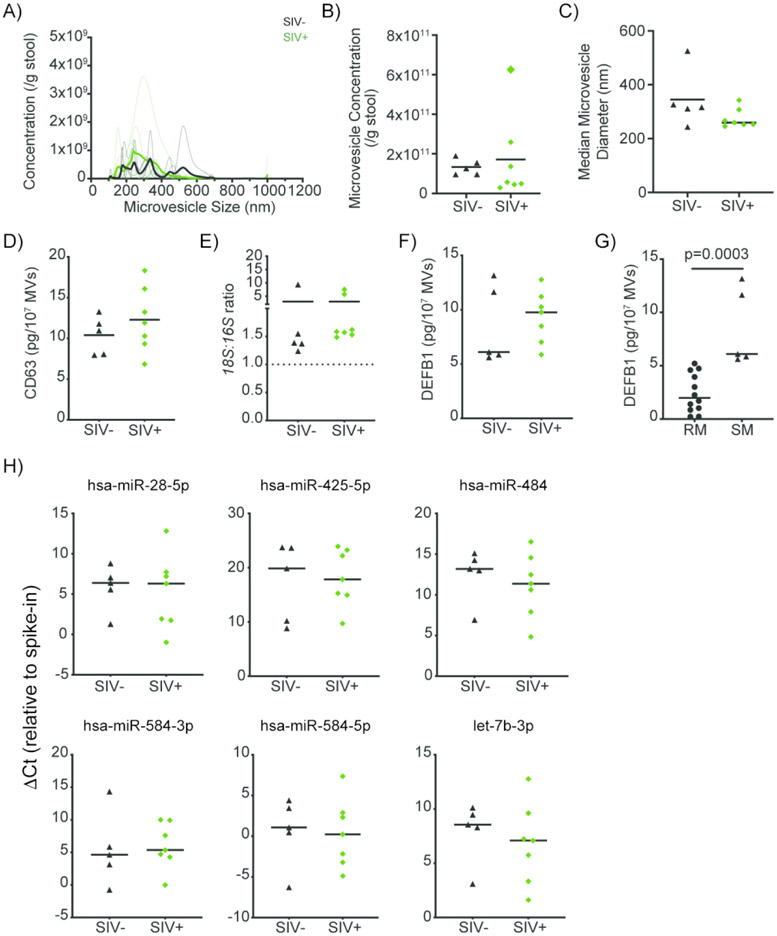
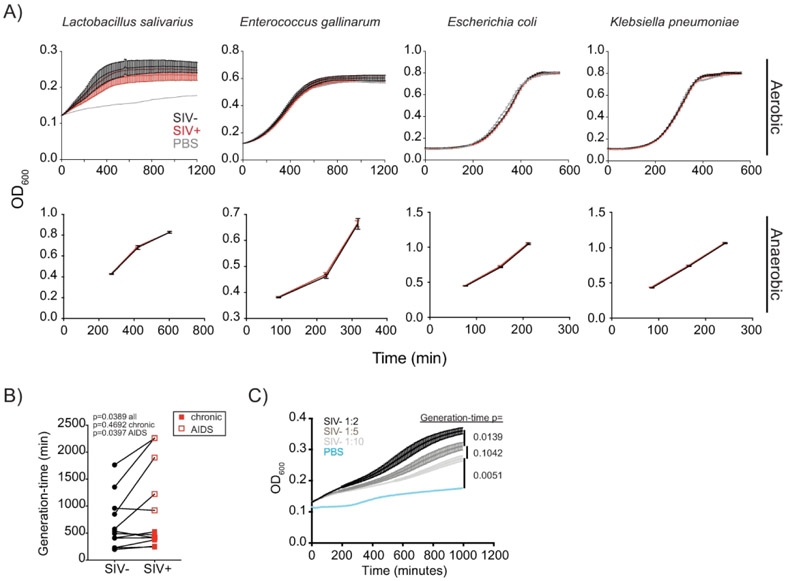
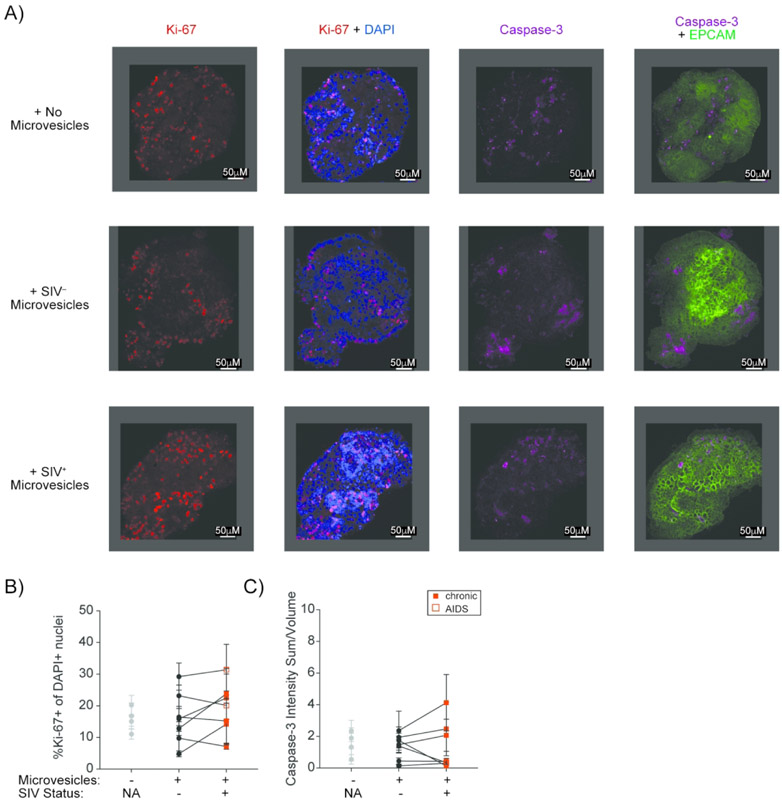
Microbial translocation contributes to persistent inflammation in both treated and untreated HIV infection. Although translocation is due in part to a disintegration of the intestinal epithelial barrier, there is a bias towards the translocation of Proteobacteria. We hypothesized that intestinal epithelial microvesicle cargo differs after HIV infection and contributes to biased translocation. We isolated gastrointestinal luminal microvesicles before and after progressive simian immunodeficiency virus (SIV) infection in rhesus macaques and measured miRNA and antimicrobial peptide content. We demonstrate that these microvesicles display decreased miR-28-5p, -484, -584-3p, and -584-5p, and let-7b-3p, as well as increased beta-defensin 1 after SIV infection. We further observed dose-dependent growth sensitivity of commensal Lactobacillus salivarius upon co-culture with isolated microvesicles. Infection-associated microvesicle differences were not mirrored in non-progressively SIV-infected sooty mangabeys. Our findings describe novel alterations of antimicrobial control after progressive SIV infection that influence the growth of translocating bacterial taxa. These studies may lead to the development of novel therapeutics for treating chronic HIV infection, microbial translocation, and inflammation.


Conflict of interest statement

DISCLOSURES

The authors have no conflicts of interest to declare.

Figures

Fig. 1.
Fig. 1.
Luminal microvesicle phenotype is preserved after progressive simian immunodeficiency virus (SIV) infection. a Luminal microvesicle (MV) size distribution in paired uninfected (black) and SIV-infected (red) macaques. Light lines correspond to individual samples and heavy lines to mean sample distribution by infection status. b-e Luminal microvesicle concentration (b), median diameter (c), CD63 expression (d), and 18S:16S transcript ratio (e) from paired uninfected and SIV-infected macaques, with chronic (closed squares) and AIDS (open squares) disease progression denoted. Microvesicle concentration, diameter, and distribution measured by Nanosight. CD63 measured by ELISA. 18S and 16S measured by quantitative reverse transcription (qRT)-PCR, with the ratio reflective of raw threshold cycle (Ct) values. ELISA and qRT-PCR values represent the mean of 3 technical replicates. Significance in b-e assessed by paired, two-way t-test.
Fig. 2.
Fig. 2.
Luminal microvesicle cargo shows a significant shift in specific miRNA content after progressive SIV infection. a Heatmap displaying longitudinal host miRNA expression from luminal microvesicles isolated at baseline and days 35 and 168 post-infection (p.i.). Expression (Ct values) assessed by miRNA Array. Data ordered from highest to lowest Ct value at baseline. Represented Ct values are the average of non-replicate, raw Ct values from 4 animals per timepoint, with per-animal values below threshold normalized to 45. b Principal component analysis considering animal, day post-infection, and Ct values of miRNA considered in a. c Normalized expression (ΔCt) of 6 follow-up miRNA from paired uninfected (black) and SIV-infected (red) luminal microvesicle samples as measured by qRT-PCR, with chronic (closed squares) and AIDS (open squares) disease progression denoted. Values are normalized to spike-in control and represent the mean of 3 technical replicates. d miRNA network analysis as assessed by miRnet. Network highlights known genes (circles) targeted by individual miRNA (squares), with shared targets joined by spanning lines. Genes targeted by >2 miRNA (green) and cell-cycle genes (yellow) are uniquely denoted. Significance in c assessed by paired, one-way t-test.
Fig. 3.
Fig. 3.
Progressive SIV infection is associated with altered DEFB1 expression in luminal microvesicles and with altered jejunal DEFB1 transcription. a Beta-defensin 1 (DEFB1) load in luminal microvesicles as measured by ELISA from paired uninfected (black) and SIV-infected (red) macaques, with chronic (closed squares) and AIDS (open squares) disease progression denoted. b Normalized DEFB1 expression (ΔCt) from paired uninfected and chronic SIV-infected rectal biopsy (RB, left) and jejunal biopsy (Jej, right) macaque homogenates as measured by qRT-PCR. c-d Rectal (c) and jejunal (d) homogenate hypoxia-inducible factor 1-alpha (HIF1A, left) and peroxisome proliferator-activated receptor-gamma (PPARG, right) expression from paired uninfected and chronic SIV-infected macaques as measured by qRT-PCR. e Association between jejunal homogenate DEFB1 and PPARG in chronic SIV-infected macaques. All values represent the mean of 3 technical replicates. qRT-PCR ΔCt values are normalized to housekeeping gene (monkey) beta-glucuronidase (mGusB). Significance in b-d assessed by paired, two-way t-test. Association in e assessed by Pearson correlation.
Fig. 4.
Fig. 4.
Luminal microvesicle phenotype, DEFB1, and miRNA expression are preserved in natural SIV hosts. a Luminal microvesicle size distribution in unpaired uninfected (black) and SIV-infected (green) mangabeys. Light lines correspond to individual samples and heavy lines to mean sample distribution by infection status. b-e Luminal microvesicle concentration (b), median diameter (c), CD63 concentration (d), 18S:16S transcript ratio (e), and DEFB1 concentration (f) from unpaired uninfected and SIV-infected mangabeys. Microvesicle concentration, diameter, and distribution measured by Nanosight. CD63 and DEFB1 measured by ELISA. 18S and 16S measured by qRT-PCR, with the ratio reflective of raw Ct values. g Direct comparison of DEFB1 expression in uninfected rhesus macaques (RM, circles) and sooty mangabeys (SM, triangles) as assessed by ELISA. h Expression (ΔCt) of 6 miRNAs from unpaired uninfected and SIV-infected mangabey luminal microvesicle samples as measured by qRT-PCR with values normalized to spike-in control. ELISA and qRT-PCR values represent the mean of 3 technical replicates. Significance in b-h assessed by unpaired, two-way t-test.
Fig. 5.
Fig. 5.
Luminal microvesicles from progressive SIV-infected hosts significantly reduce the growth of Lactobacillus salivarius. a Growth curves of translocating bacterial isolates in aerobic (top) or anaerobic (bottom) conditions upon co-culture with luminal microvesicles (1:2 dilution) isolated from paired uninfected and SIV-infected macaques. Growth of L. salivarius (n=12 pairs), Escherichia coli (n=8), Enterococcus gallinarum (n=11), and Klebsiella pneumoniae (n=8) measured by spectrophotometer at OD600. Values represent the mean of 8-12 paired biological and 3 technical replicates ±SEM. b Generation time of L. salivarius aerobically co-cultured in a, with chronic (closed squares) and AIDS (open squares) disease progression denoted. c Growth curves of L. salivarius aerobically co-cultured with serial dilutions of luminal microvesicles isolated from uninfected macaques. Values represent the mean of 4 paired biological replicates ±SEM. Significance in growth generation times in b-c assessed by paired, two-way t-test.
Fig. 6.
Fig. 6.
Luminal Microvesicles from SIV-infected macaques do not alter epithelial cell proliferation or apoptosis. a Representative immunofluorescence images of colonic organoids cultured with or without microvesicles isolated from paired uninfected and SIV-infected macaques, stained for Ki-67, DAPI, active caspase-3, and EPCAM. b Percent Ki-67+ of DAPI+ nuclei of colonic organoids stained as in a, with chronic (closed squares) and AIDS (open squares) disease progression denoted. c Intensity (sum/volume) of active caspase-3 of colonic organoids stained as in b. Values represent the mean of 5 technical replicates from 4 control or 7 paired biological samples ±SEM.

Similar articles

Cited by

References

    1. Marchetti G, Tincati C, Silvestri G. Microbial translocation in the pathogenesis of HIV infection and AIDS. Clin Microbiol Rev 2013; 26(1): 2–18. - PMC - PubMed
    1. Hunt PW. HIV and inflammation: mechanisms and consequences. Curr HIV/AIDS Rep 2012; 9(2): 139–147. - PubMed
    1. Sender R, Fuchs S, Milo R. Revised Estimates for the Number of Human and Bacteria Cells in the Body. PLoS Biol 2016; 14(8): e1002533. - PMC - PubMed
    1. Allaire JM, Crowley SM, Law HT, Chang SY, Ko HJ, Vallance BA. The Intestinal Epithelium: Central Coordinator of Mucosal Immunity. Trends Immunol 2018; 39(9): 677–696. - PubMed
    1. Brenchley JM. Mucosal immunity in human and simian immunodeficiency lentivirus infections. Mucosal Immunol 2013; 6(4): 657–665. - PMC - PubMed

Publication types

MeSH terms

LinkOut - more resources