. 2021 Nov;35(11):3188-3200.
doi: 10.1038/s41375-021-01217-1. Epub 2021 Mar 17.

Interleukin-10 suppression enhances T-cell antitumor immunity and responses to checkpoint blockade in chronic lymphocytic leukemia

Affiliations

Interleukin-10 suppression enhances T-cell antitumor immunity and responses to checkpoint blockade in chronic lymphocytic leukemia

J R Rivas et al. Leukemia. 2021 Nov.

Abstract

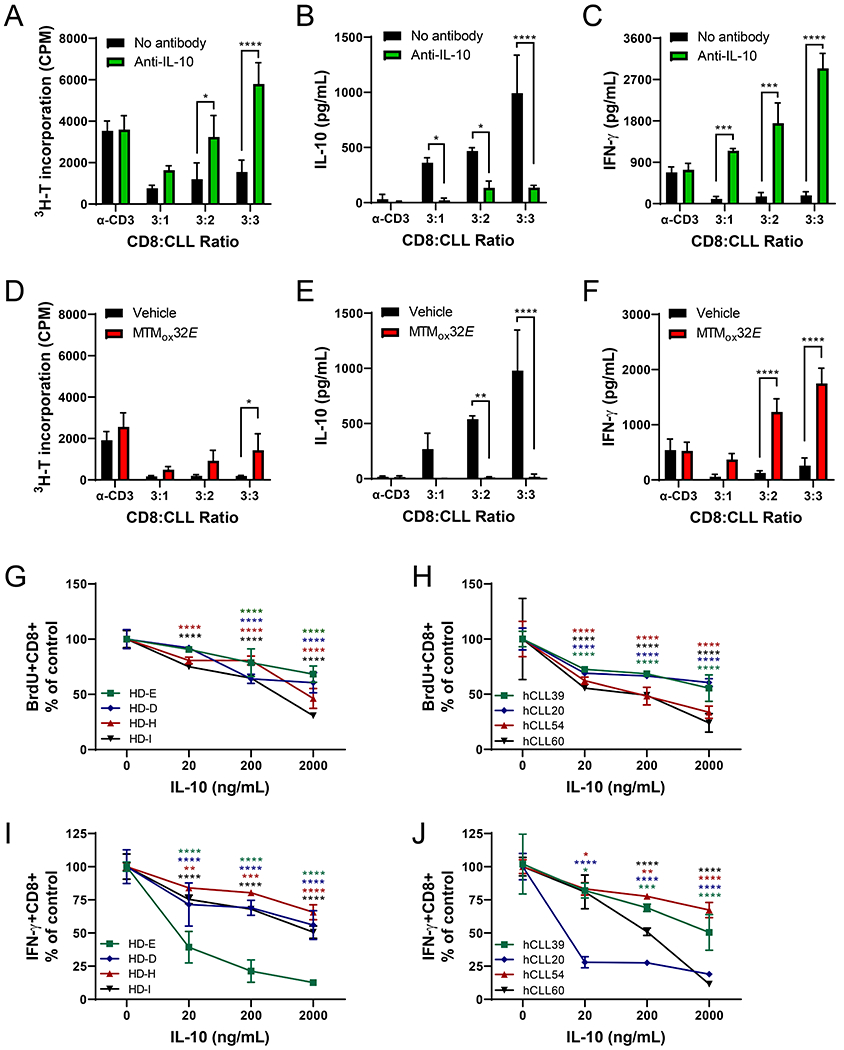
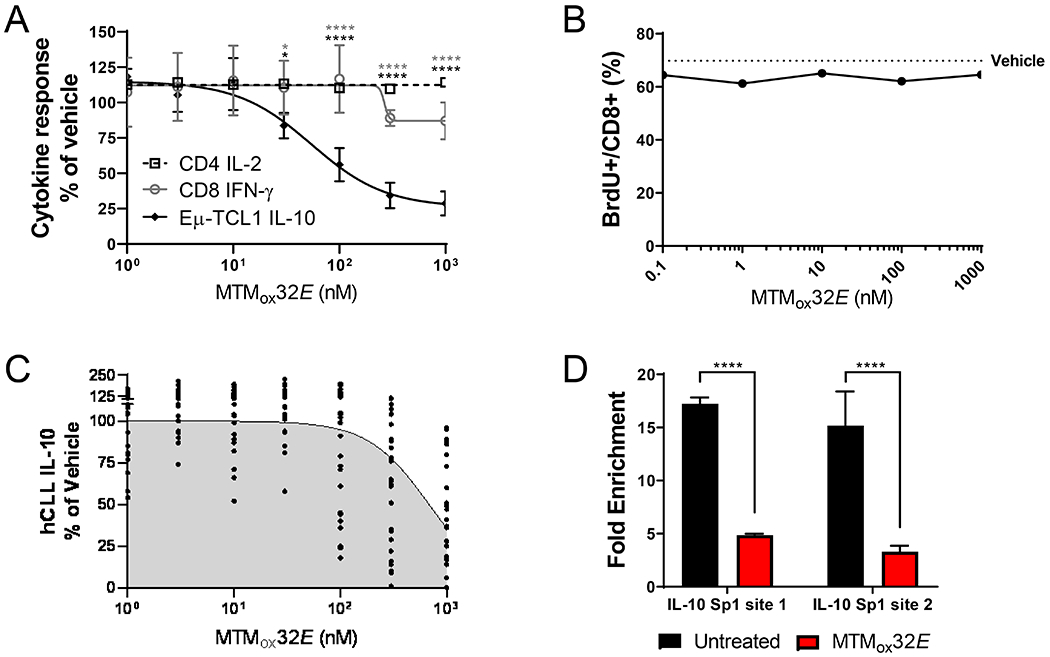
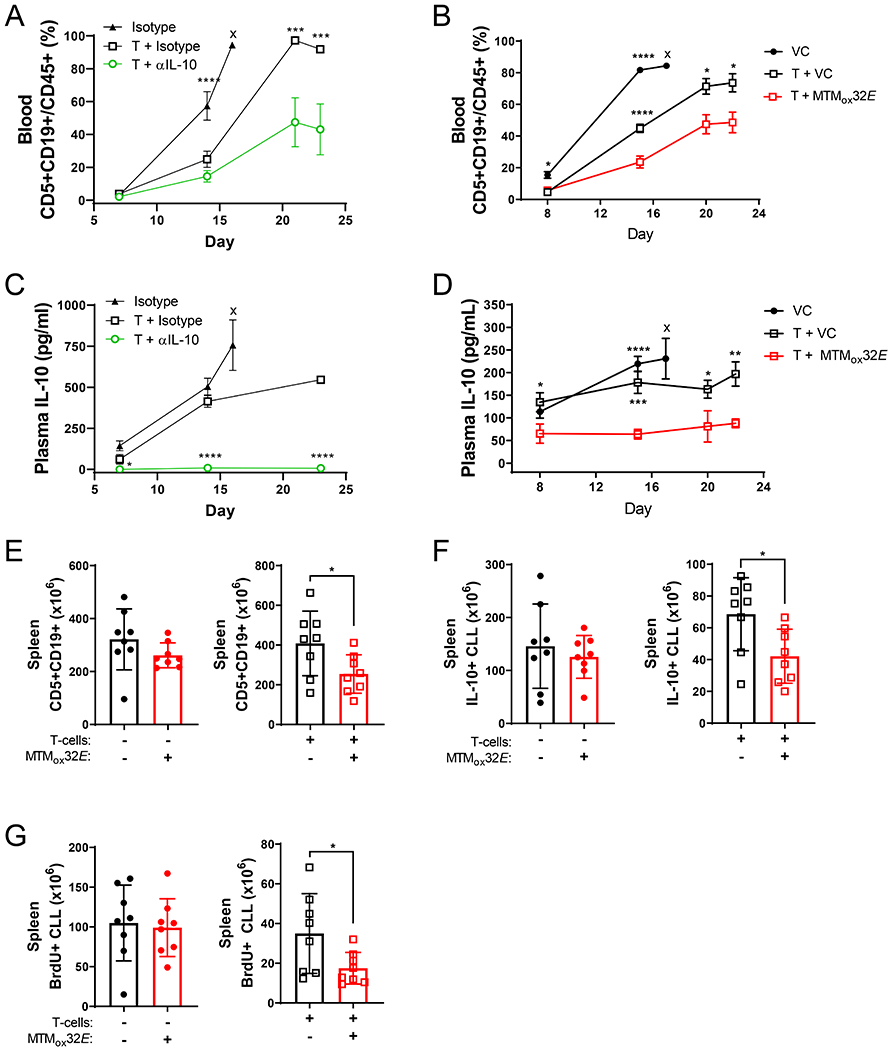
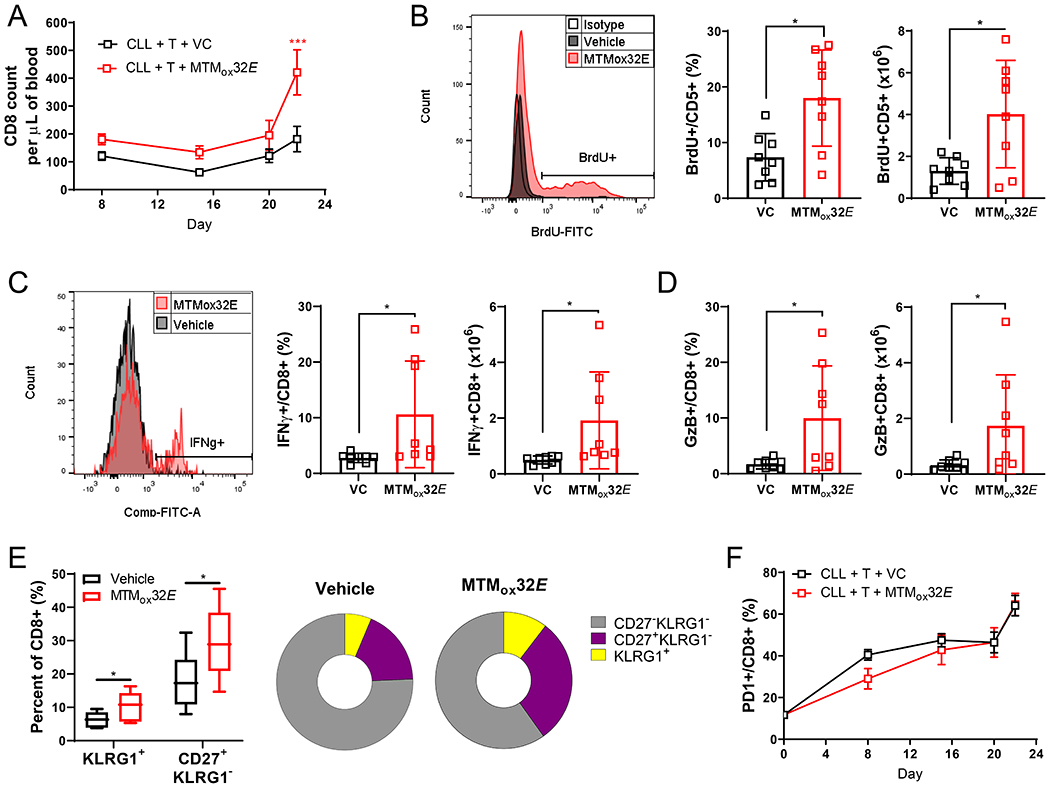
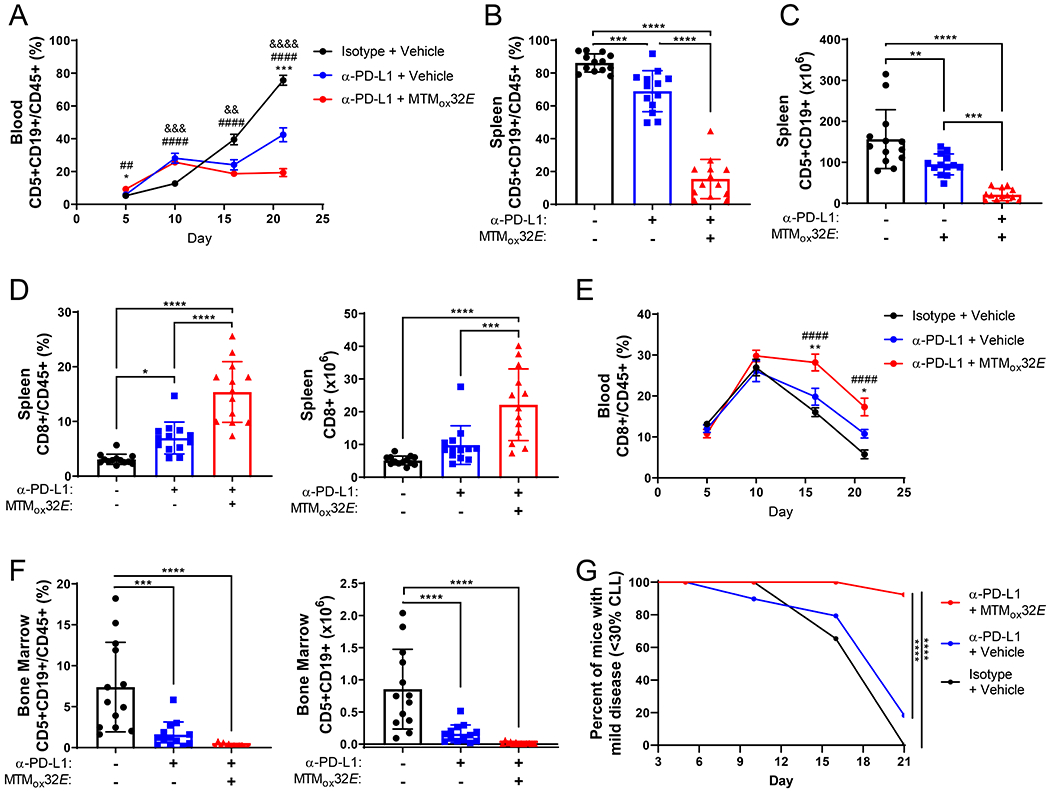
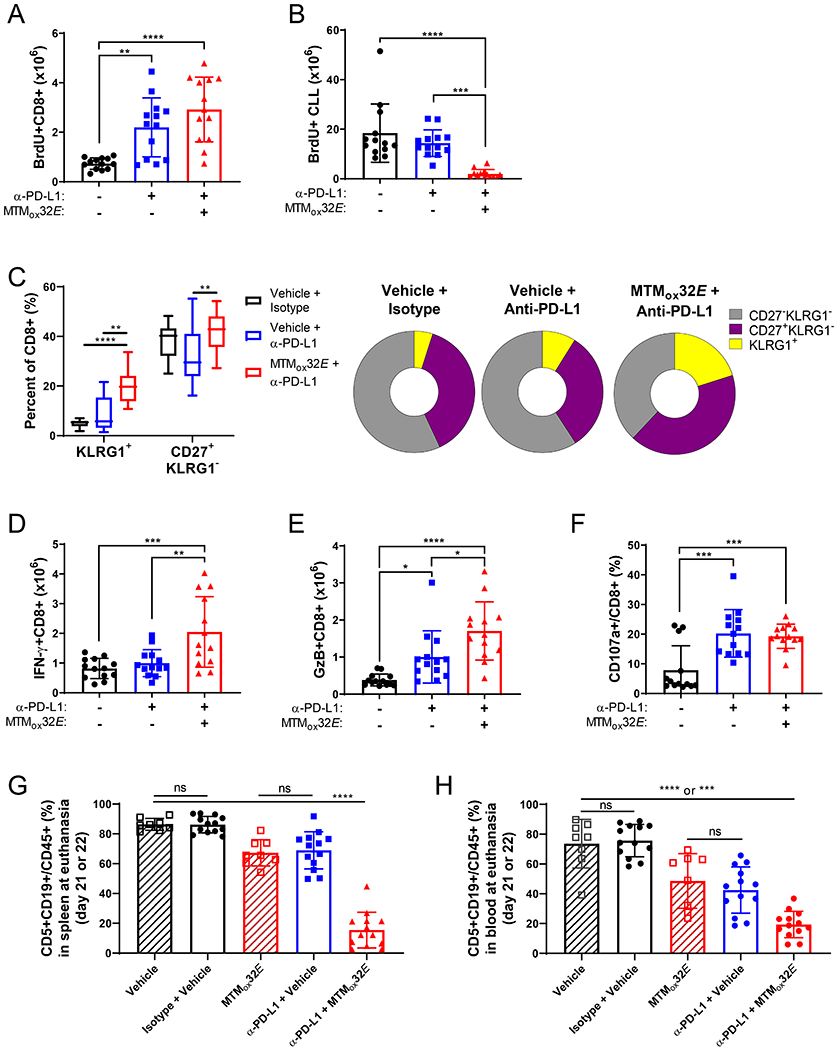
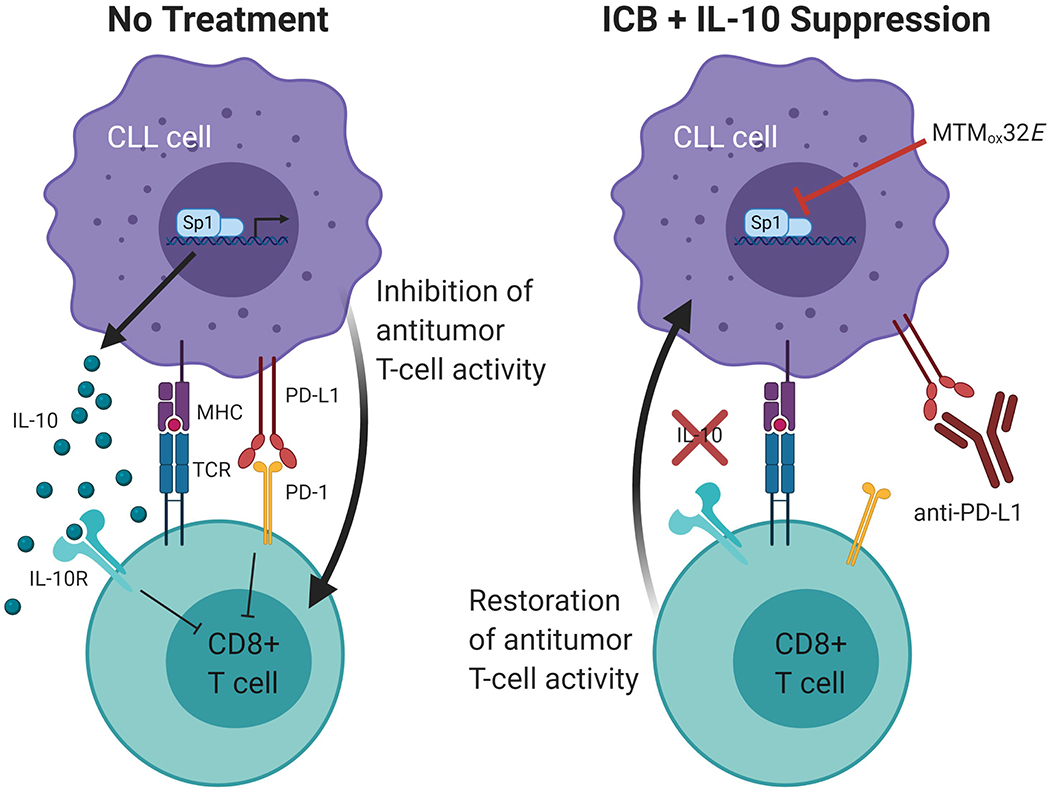
T-cell dysfunction is a hallmark of B-cell Chronic Lymphocytic Leukemia (CLL), where CLL cells downregulate T-cell responses through regulatory molecules including programmed death ligand-1 (PD-L1) and Interleukin-10 (IL-10). Immune checkpoint blockade (ICB) aims to restore T-cell function by preventing the ligation of inhibitory receptors like PD-1. However, most CLL patients do not respond well to this therapy. Thus, we investigated whether IL-10 suppression could enhance antitumor T-cell activity and responses to ICB. Since CLL IL-10 expression depends on Sp1, we utilized a novel, better tolerated analogue of the Sp1 inhibitor mithramycin (MTMox32E) to suppress CLL IL-10. MTMox32E treatment inhibited mouse and human CLL IL-10 production and maintained T-cell effector function in vitro. In the Eμ-Tcl1 mouse model, treatment reduced plasma IL-10 and CLL burden and increased CD8+ T-cell proliferation, effector and memory cell prevalence, and interferon-γ production. When combined with ICB, suppression of IL-10 improved responses to anti-PD-L1 as shown by a 4.5-fold decrease in CLL cell burden compared to anti-PD-L1 alone. Combination therapy also produced more interferon-γ+, cytotoxic effector KLRG1+, and memory CD8+ T-cells, and fewer exhausted T-cells. Since current therapies for CLL do not target IL-10, this provides a novel strategy to improve immunotherapies.


Conflict of interest statement

Competing Interests:

J.S.T. is a co-founder of Centrose (Madision, WI, USA). No other authors have competing financial interests.

Figures

Figure 1:
Figure 1:. CLL IL-10 suppresses T-cell responses.
(A) Proliferation of CLL-primed CD8+ T-cells in response to anti-CD3 or varying numbers of Eμ-TCL1 splenocytes after 72 hours of stimulation, with or without 10μg/mL anti-IL-10. Secreted IL-10 (B) and IFN-γ (C) from cultures in panel A (Eμ-TCL1 spleen cells alone produced 986pg/mL IL-10 and 80pg/mL IFN-γ). (D) Proliferation of CLL-primed CD8+ T-cells stimulated with anti-CD3 or varying numbers of Eμ-TCL1 splenocytes after 72 hours with or without 1μM MTMox32E. Secreted IL-10 (E) and IFN-γ (F) from cultures in panel D (Eμ-TCL1 spleen cells alone produced 948pg/mL IL-10 and 78pg/mL IFN-γ). (G-H) Normalized proliferation (BrdU incorporation) of healthy donor (G) or CLL patient (H) human CD8+ T-cells in response to a 5-day stimulation with plate bound anti-CD3 with soluble anti-CD28 and recombinant human IL-10. (I-J) Normalized intracellular IFN-γ production from cells in (G-H), measured by flow cytometry. Frequency of responding cells in G-J were normalized to responses of CD8+ T-cells from same donor/patient cultured without IL-10. Two-way ANOVA between control and antibody or inhibitor treatment was used to calculate statistical significance. **p<0.01, ***p<0.001, ****p<0.0001
Figure 2:
Figure 2:. MTMox32E suppresses CLL IL-10 without dampening in vitro T-cell responses.
(A) Secreted IL-10 from Eμ-TCL1 splenocytes, IL-2 from murine C57BL/6 CD4+ T-cells, and IFN-γ from murine C57BL/6 CD8+ T-cells cultured for 24 hours with MTMox32E, normalized to vehicle control (660pg/mL, 398pg/mL, 106pg/mL, respectively). T-cells were stimulated with 10μg/mL soluble anti-CD3. (B) Proliferation (BrdU incorporation) of C57BL/6 CD8+ T-cells cultured for 72 hours with 10μg/mL anti-CD3 + MTMox32E (error bars are too small to be seen). (C) Secreted IL-10 from human CLL PBMCs stimulated with 25μg/mL anti-IgM for 24 hours with MTMox32E, normalized to vehicle control (17–656pg/mL). (D) Promoter occupancy of Sp1 GC-rich sites on the human IL-10 promoter in Mec1 cells treated with 1000nM MTMox32E. Statistical comparisons made by two-way ANOVA in A and one-way ANOVA in D. *p<0.05, **p<0.01, ***p<0.001, ****p<0.0001
Figure 3:
Figure 3:. MTMox32E enhances anti-CLL activity of CD8+ T-cells and suppresses CLL IL-10 production in vivo.
(A-B) Frequency of Eμ-TCL1 CLL cells in the blood of NSG mice (mean + SEM). Six groups of eight NSG mice were injected with Eμ-TCL1 CLL, with or without Eμ-TCL1 primed CD8+ T-cells (CLL to T-cell ratio of 32:1) and received 150μg anti-IL-10 or isotype every two days (A) or 12mg/kg MTMox32E or vehicle every three days (B). Stars indicate statistical significance of differences between control and anti-IL-10 (A) or MTMox32E (B) treated group. (C-D) Plasma IL-10 levels in NSG mice (mean + SEM). Stars indicate significance between control and anti-IL-10 (C) or MTMox32E (D) treated group. (E) Burden of Eμ-TCL1 CLL cells in the spleens of NSG mice without CD8+ T-cells (left panel, euthanized day 17) and with CD8+ T-cells (right panel, euthanized day 22) in the MTMox32E group. (F) Count of IL-10+ Eμ-TCL1 CLL cells in the spleens of NSG mice without CD8+ T-cells (left, day 17) and with CD8+ T-cells (right, day 22). (G) Count of proliferative (BrdU+) Eμ-TCL1 CLL cells in the spleens of NSG mice without CD8+ T-cells (left, day 17) and with CD8+ T-cells (right, day 22). Statistical comparisons made by two-way ANOVA in A-D, and one-way ANOVA in E-G. *p<0.05, **p<0.01, ***p<0.001, ****p<0.0001, VC=vehicle control, x=mice euthanized at indicated earlier timepoint
Figure 4:
Figure 4:. Inhibiting CLL IL-10 with MTMox32E increases the numbers of T- effector cells.
Mice were treated as in Figure 3B. (A) The number of CD8+ T-cells in the blood of NSG mice. (B) (Left) Representative histograms of BrdU incorporation by splenic CD5+CD19- T-cells (>99% CD8+). Frequency (middle) and number (right) of BrdU+ splenic CD8+ T-cells. (C) (Left) Representative histograms of IFN-γ production by splenic CD8+ T-cells. Frequency (middle) and number (right) of splenic IFN-γ+ CD8+ T-cells. (D) Frequency (left) and number (right) of GzB+ CD8+ T-cells in the spleen. (E) Frequency of KLRG1+ highly cytotoxic effector and CD27+ memory CD8+ T-cells in the spleen (left) and pie chart representations of CD8+ T-cell proportions. (F) Frequency of PD-1 expressing CD8+ T-cells in the blood. Statistical comparisons in A+F were obtained by two-way ANOVA comparing vehicle to MTMox32E treated mice, and in B-E by one-way ANOVA between vehicle to MTMox32E. *p<0.05
Figure 5:
Figure 5:. Anti-PD-L1 checkpoint blockade is more effective when combined with IL-10 suppression by MTMox32E.
Three groups of thirteen NSG mice were injected with Eμ-TCL1 and Eμ-TCL1 primed CD8+ T-cells at a ratio of one T-cell to 32 CLL cells. Mice received 12mg/kg MTMox32E or vehicle every two to three days plus 10mg/kg anti-PD-L1 or isotype control every three days. (A) Frequency of Eμ-TCL1 CLL cells in the blood of NSG mice (mean + SEM). (B-C) Frequency (B) and count (C) of Eμ-TCL1 CLL cells in the spleen. (D) Frequency (left) and count (right) of CD8+ T-cells in the spleen of recipient NSG mice. (E) Frequency of CD8+ T-cells in the blood of NSG recipients (mean + SEM). (F) Frequency (left) and count (right) of Eμ-TCL1 CLL cells in the bone marrow. (G) Percent of mice with less than 30% CLL in the blood over time. Statistical significance in A, E, G was calculated by two-way ANOVA comparing vehicle to treated mice, and by one-way ANOVA comparing vehicle to treated mice in remaining panels. *p<0.05, **p<0.01, ***p<0.001, ****p<0.0001 indicate statistical significance of *difference between combination and ICB alone, #difference between combination and control, &difference between ICB alone and control
Figure 6:
Figure 6:. T-cells from Eμ-TCL1 mice are more functional when treated with both anti-PD-L1 checkpoint blockade and IL-10 blockade.
Mice were treated as in Figure 5. (A) Count of BrdU+ splenic CD8+ T-cells. (B) Count of BrdU+ Eμ-TCL1 CLL cells in the spleen. (C) Frequency of KLRG1+ highly cytotoxic effector and CD27+ memory CD8+ T-cells in the spleen (left) and pie chart representations of CD8+ T-cell proportions. (D-E) Count of IFN-γ+ (D) and GzB+ (E) splenic CD8+ T-cells. (F) Frequency of CD107a+ splenic CD8+ T-cells. (G) Comparison of CLL frequency in spleen from Fig. 5B and Fig. S5B. (H) Comparison of CLL frequency in the blood from Figures 3B and 5A. Statistical comparisons done by one-way ANOVA comparing vehicle to treated mice, except in G+H where all groups were compared to each other. *p<0.05, **p<0.01, ***p<0.001, ****p<0.0001
Figure 7:
Figure 7:. Cooperation of IL-10 suppression and immune checkpoint blockade.
Created with BioRender.com. Model shows combining IL-10 suppression with anti-PD-L1 ICB enhances antitumor CD8+ T-cell activity by counteracting multiple methods of CLL immune suppression.

References

    1. Brusa D, Serra S, Coscia M, Rossi D, D’Arena G, Laurenti L, et al. The PD-1/PD-L1 axis contributes to T-cell dysfunction in chronic lymphocytic leukemia. Haematologica. 2013;98(6):953–63. - PMC - PubMed
    1. McClanahan F, Riches JC, Miller S, Day WP, Kotsiou E, Neuberg D, et al. Mechanisms of PD-L1/PD-1-mediated CD8 T-cell dysfunction in the context of aging-related immune defects in the Emicro-TCL1 CLL mouse model. Blood. 2015;126(2):212–21. - PMC - PubMed
    1. DiLillo DJ, Weinberg JB, Yoshizaki A, Horikawa M, Bryant JM, Iwata Y, et al. Chronic lymphocytic leukemia and regulatory B cells share IL-10 competence and immunosuppressive function. Leukemia. 2013;27(1):170–82. - PMC - PubMed
    1. Alhakeem SS, McKenna MK, Oben KZ, Noothi SK, Rivas JR, Hildebrandt GC, et al. Chronic Lymphocytic Leukemia-Derived IL-10 Suppresses Antitumor Immunity. J Immunol. 2018;200(12):4180–9. - PMC - PubMed
    1. Alhakeem SS, Sindhava VJ, McKenna MK, Gachuki BW, Byrd JC, Muthusamy N, et al. Role of B cell receptor signaling in IL-10 production by normal and malignant B-1 cells. Ann N Y Acad Sci. 2015;1362:239–49. - PMC - PubMed

Publication types

MeSH terms