. 2021 Jul;23(7):1263-1272.
doi: 10.1038/s41436-021-01120-1. Epub 2021 Mar 17.

Computational analysis of 10,860 phenotypic annotations in individuals with SCN2A-related disorders

Affiliations

Computational analysis of 10,860 phenotypic annotations in individuals with SCN2A-related disorders

Katherine Crawford et al. Genet Med. 2021 Jul.

Abstract

Purpose: Pathogenic variants in SCN2A cause a wide range of neurodevelopmental phenotypes. Reports of genotype-phenotype correlations are often anecdotal, and the available phenotypic data have not been systematically analyzed.

Methods: We extracted phenotypic information from primary descriptions of SCN2A-related disorders in the literature between 2001 and 2019, which we coded in Human Phenotype Ontology (HPO) terms. With higher-level phenotype terms inferred by the HPO structure, we assessed the frequencies of clinical features and investigated the association of these features with variant classes and locations within the NaV1.2 protein.

Results: We identified 413 unrelated individuals and derived a total of 10,860 HPO terms with 562 unique terms. Protein-truncating variants were associated with autism and behavioral abnormalities. Missense variants were associated with neonatal onset, epileptic spasms, and seizures, regardless of type. Phenotypic similarity was identified in 8/62 recurrent SCN2A variants. Three independent principal components accounted for 33% of the phenotypic variance, allowing for separation of gain-of-function versus loss-of-function variants with good performance.

Conclusion: Our work shows that translating clinical features into a computable format using a standardized language allows for quantitative phenotype analysis, mapping the phenotypic landscape of SCN2A-related disorders in unprecedented detail and revealing genotype-phenotype correlations along a multidimensional spectrum.


Conflict of interest statement

I.H. serves on the Scientific Advisory Board of Biogen. The other authors declare no competing interests.

Figures
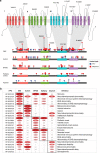
Fig. 1
Fig. 1. Overview of SCN2A variants and associated phenotypic features.
(a) The NaV1.2 channel (above) and gene (below), highlighting a selection of recurrent variants. (b) The frequency of phenotypic features within categorized phenotypic subgroups: developmental and epileptic encephalopathy (DEE, n = 255), autism (ASD, n = 60), benign familial neonatal–infantile seizures (BFNIS, n = 53), Other epilepsy (n = 27), and atypical SCN2A-related phenotypes (n = 18). Boxed frequencies indicate the five most frequent Human Phenotype Ontology (HPO) terms within each respective phenotypic subgroup. CNS central nervous system, EEG electroencephalogram, PTV protein-truncating variant.
Fig. 2
Fig. 2. Recurrent variant phenograms.
(a) Phenogram comparing the frequency of Human Phenotype Ontology (HPO) terms in individuals with variant p.L1342P and the remainder of the cohort. (b) Phenogram comparing the frequency of HPO terms in individuals with variant p.A263V and the remainder of the cohort. (c) Phenogram comparing the frequency of HPO terms in individuals with variant p.R853Q and the remainder of the cohort. Red points indicate HPO terms with uncorrected p values <0.05, blue points indicate HPO terms with uncorrected p values ≥0.05. EEG electroencephalogram.
Fig. 3
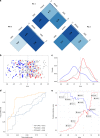
Fig. 3. Logistic principal component analysis (PCA) and receiver-operating characteristic curves (ROC) allow for variant function prediction.
(a) ROC performance measurements (area under the curve [AUC]) for phenotypic subgroup comparisons between developmental and epileptic encephalopathy (DEE), benign familial neonatal–infantile seizures (BFNIS), and autism. A darker shade of blue indicates a higher performance for separating between phenotypic groups. (b) The second major principal component (PC2) separates individuals with known loss-of-function (LoF) (blue) and gain-of-function (GoF) (red) variants. (c) Density plot of PC2 across all individuals with known LoF (blue), GoF (red), and unmeasured variants (gray). (d) ROC for PC2 (yellow) shows higher performance for separating GoF from LoF variants. (e) Positive predictive values (PPV) for GoF and LoF variants with PC2 values for individuals with specific variants are highlighted on the graph. Some variants appear twice as phenotypes in individuals with recurrent variants may differ.

References

    1. Scheffer IE, et al. ILAE classification of the epilepsies: position paper of the ILAE Commission for Classification and Terminology. Epilepsia. 2017;58:512–521. doi: 10.1111/epi.13709. - DOI - PMC - PubMed
    1. Heyne HO, et al. De novo variants in neurodevelopmental disorders with epilepsy. Nat. Genet. 2018;50:1048–1053. doi: 10.1038/s41588-018-0143-7. - DOI - PubMed
    1. Lindy AS, et al. Diagnostic outcomes for genetic testing of 70 genes in 8565 patients with epilepsy and neurodevelopmental disorders. Epilepsia. 2018;59:1062–1071. doi: 10.1111/epi.14074. - DOI - PubMed
    1. Truty R, et al. Possible precision medicine implications from genetic testing using combined detection of sequence and intragenic copy number variants in a large cohort with childhood epilepsy. Epilepsia Open. 2019;4:397–408. doi: 10.1002/epi4.12348. - DOI - PMC - PubMed
    1. Howell KB, et al. A population-based cost-effectiveness study of early genetic testing in severe epilepsies of infancy. Epilepsia. 2018;59:1177–1187. doi: 10.1111/epi.14087. - DOI - PMC - PubMed

Publication types

Substances

LinkOut - more resources