. 2021 Mar;53(3):432-445.
doi: 10.1038/s12276-021-00582-2. Epub 2021 Mar 17.

Pancreatic cancer induces muscle wasting by promoting the release of pancreatic adenocarcinoma upregulated factor

Affiliations

Pancreatic cancer induces muscle wasting by promoting the release of pancreatic adenocarcinoma upregulated factor

Wonbeak Yoo et al. Exp Mol Med. 2021 Mar.

Abstract

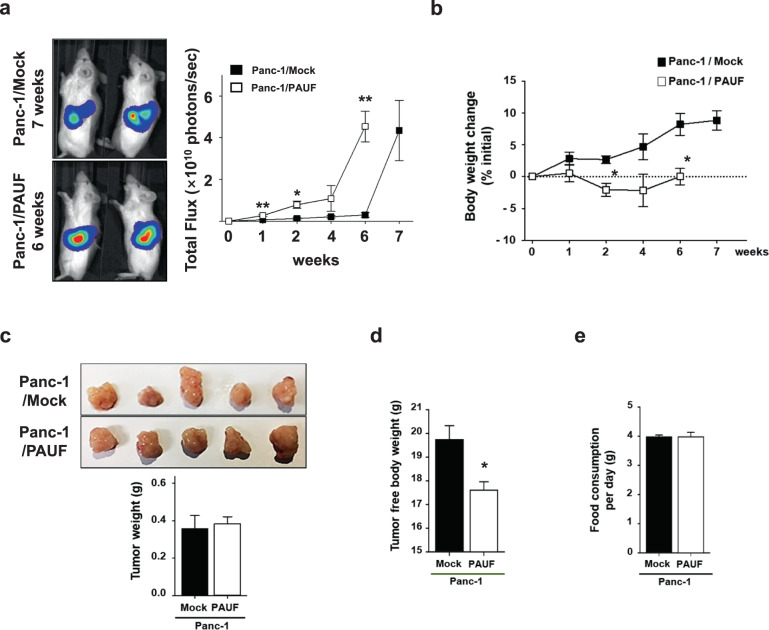
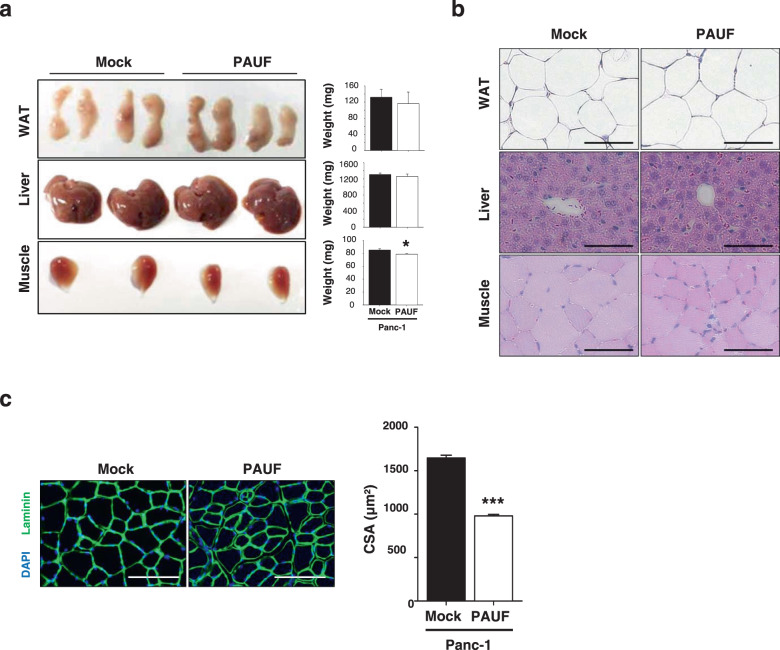
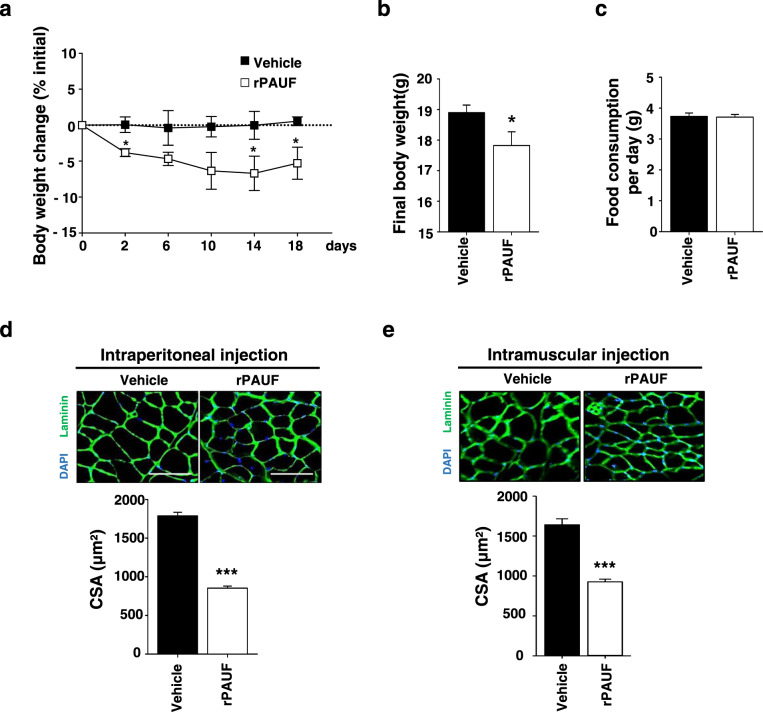
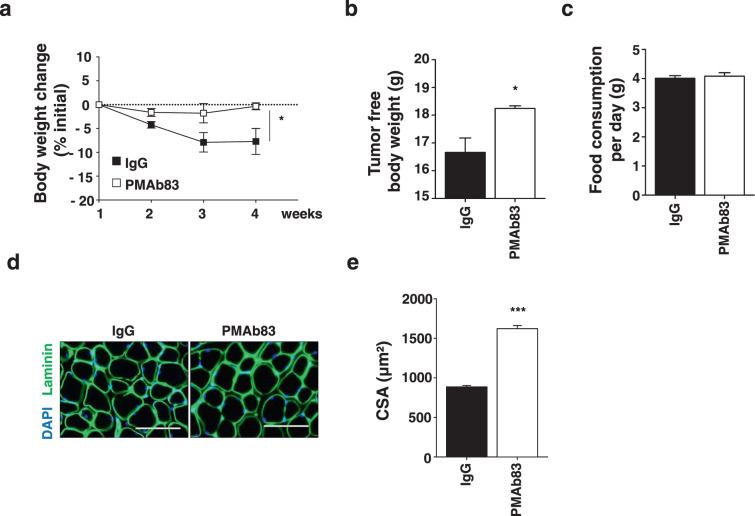
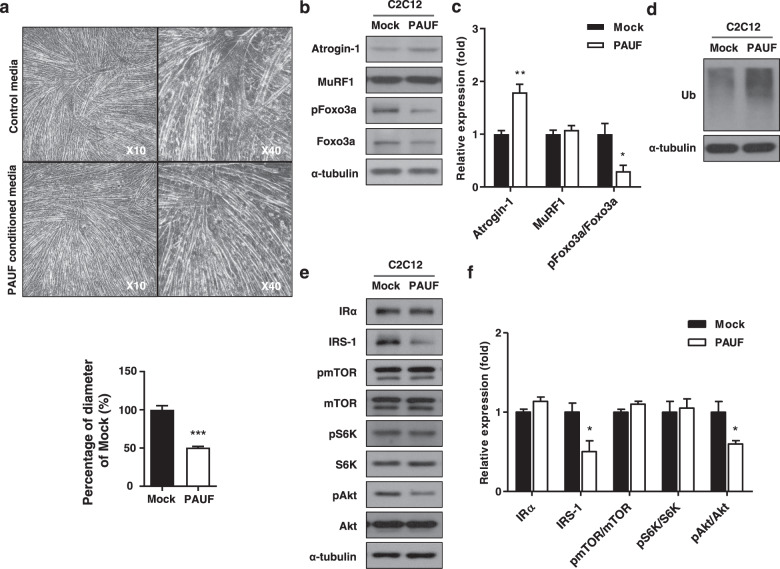
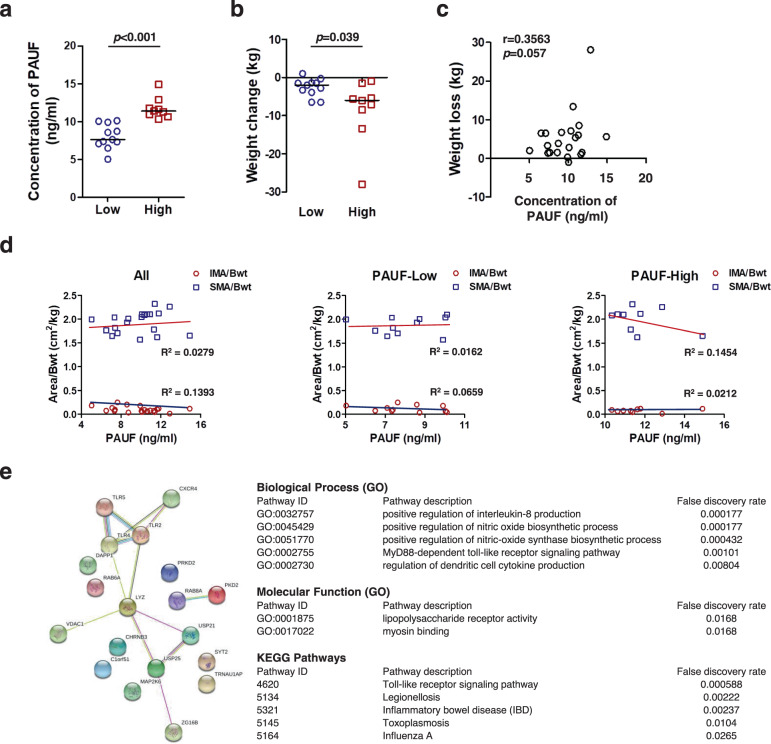
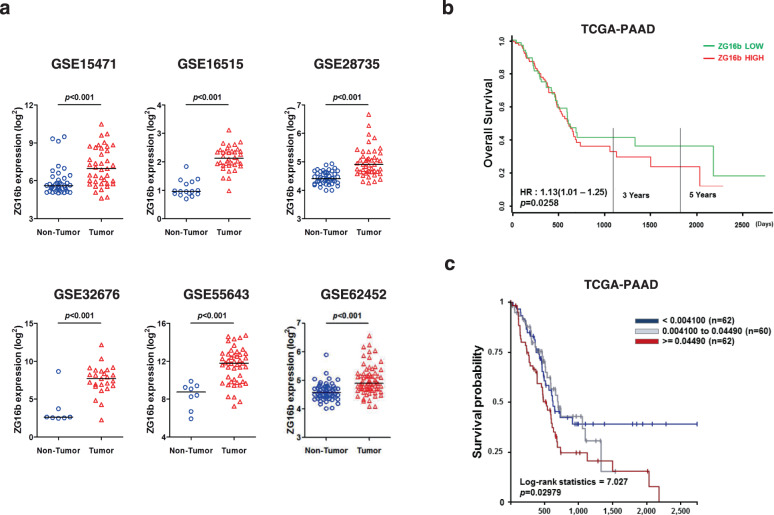
Cancer cachexia is a highly debilitating condition characterized by weight loss and muscle wasting that contributes significantly to the morbidity and mortality of pancreatic cancer. The factors that induce cachexia in pancreatic cancer are largely unknown. We previously showed that pancreatic adenocarcinoma upregulated factor (PAUF) secreted by pancreatic cancer cells is responsible for tumor growth and metastasis. Here, we analyzed the relation between pancreatic cancer-derived PAUF and cancer cachexia in mice and its clinical significance. Body weight loss and muscle weight loss were significantly higher in mice with Panc-1/PAUF tumors than in those with Panc-1/Mock tumors. Direct administration of rPAUF to muscle recapitulated tumor-induced atrophy, and a PAUF-neutralizing antibody abrogated tumor-induced muscle wasting in Panc-1/PAUF tumor-bearing mice. C2C12 myotubes treated with rPAUF exhibited rapid inactivation of Akt-Foxo3a signaling, resulting in Atrogin1/MAFbx upregulation, myosin heavy chain loss, and muscle atrophy. The neutrophil-to-lymphocyte ratio and body weight loss were significantly higher in pancreatic cancer patients with high PAUF expression than in those with low PAUF expression. Analysis of different pancreatic cancer datasets showed that PAUF expression was significantly higher in the pancreatic cancer group than in the nontumor group. Analysis of The Cancer Genome Atlas data found associations between high PAUF expression or a high DNA copy number and poor overall survival. Our data identified tumor-secreted circulating PAUF as a key factor of cachexia, causing muscle wasting in mice. Neutralizing PAUF may be a useful therapeutic strategy for the treatment of pancreatic cancer-induced cachexia.


Conflict of interest statement

The authors declare no competing interests.

Figures

Fig. 1
Fig. 1. Association between cachexia and pancreatic cancer-derived PAUF.
a Panc-1/Mock or Panc-1/PAUF cells were orthotopically injected into NSG mice (n = 5). Bioluminescence imaging of luciferase in the Panc-1/Mock or Panc-1/PAUF tumor-bearing mice and photon values of the tumor mass are displayed in the graph. b Time-dependent changes are expressed as the percent modulation of initial body weight. c Representative tumor image and tumor weight after Panc-1/Mock (7 weeks) or Panc-1/PAUF (6 weeks) cell inoculation. d Tumor-free body weight. e Food consumption per day. The data represent the mean ± SD; *p < 0.05 vs. Panc-1/Mock cell-injected mice.
Fig. 2
Fig. 2. Tissue histology of Panc-1/Mock and Panc-1/PAUF tumor-bearing mice.
a Representative images of white adipose tissue (WAT), liver tissue, and tibialis anterior (TA) muscles from Panc-1/Mock or Panc-1/PAUF tumor-bearing mice are shown. Weights of WAT, liver tissue, and the TA muscle. b Representative images of hematoxylin and eosin staining of WAT, liver tissue, and the TA muscle. c Representative images of muscle sections stained for laminin. Scale bar, 100 µm. The graph shows the mean CSA of muscle myofibers. The data represent the mean ± SD; *p < 0.05, **p < 0.01, and ***p < 0.001 vs. Panc-1/Mock cell-injected mice.
Fig. 3
Fig. 3. rPAUF induces body weight loss and muscle atrophy.
a Time-dependent changes expressed as the percent modulation of initial body weight in mice injected intravenously with rPAUF (50 µg/kg) or PBS. b Final body weight at 18 days postinjection. c Food consumption per day. d Representative images of muscle sections stained for laminin. Scale bar, 100 µm. The graph shows the mean CSA of muscle myofibers. e rPAUF (50 µg/kg) or PBS was injected into the muscles of mice. Representative images of muscle sections stained for laminin are shown. Scale bar, 100 µm. The graph shows the mean CSA of muscle myofibers. The data represent the mean ± SD; *p < 0.05, **p < 0.01, and ***p < 0.001 vs. PBS.
Fig. 4
Fig. 4. PMAb83 reduces muscle atrophy in PAUF tumor-bearing mice.
a Panc-1/PAUF cells were orthotopically injected into NSG mice. Two weeks after tumor cell injection, the tumor-bearing mice were treated with control IgG (10 mg/kg) or PMAb83 (10 mg/kg) intraperitoneally twice a week. Time-dependent changes are expressed as the percent modulation of initial body weight in the ctrl IgG- or PMAb83-injected mice. b Tumor-free body weight. c Food consumption per day. d Representative images of muscle sections stained for laminin. Scale bar, 100 µm. e The graph shows the mean CSA of muscle myofibers. The data represent the mean ± SD; *p < 0.05, **p < 0.01, and ***p < 0.001 vs. ctrl IgG.
Fig. 5
Fig. 5. Myotube atrophy induced by PAUF conditioned medium.
a Light microscopy images (left: low magnification at 10×; right: high magnification at 40×) showing the effect of control medium (from Panc-1/Mock cell cultures) or PAUF conditioned medium (from Panc-1/PAUF cell cultures). Relative diameter of myotubes cultured in control or PAUF conditioned medium. Four different views were randomly selected for diameter measurements and quantified using ImageJ software. Data were normalized to the diameter of myotubes cultured in control medium. b Western blot analysis of catabolic markers in cells treated with rPAUF using antibodies against Atrgoin-1, MuRF1, pFoxo3a, and Foxo3a. c Relative expression was measured by densitometric analysis of western blot data (n = 3). The data represent the mean ± SD; *p < 0.05 and **p < 0.01. d Whole-cell extracts were also subjected to SDS-PAGE followed by western blot analysis using an anti-ubiquitin antibody to assay steady-state ubiquitination levels. e Western blot analysis of anabolic markers in cells treated with rPAUF using antibodies against IR, IRS-1, pmTOR, mTOR, pS6K, S6K, pAkt, and aAkt. f Relative expression was measured by densitometric analysis of western blot data (n = 3). The data represent the mean ± SD; *p < 0.05.
Fig. 6
Fig. 6. Plasma PAUF levels in pancreatic cancer patients and PAUF-associated gene analysis.
a Plasma PAUF levels and b body weight changes in pancreatic cancer patients; horizontal lines indicate the median. c Pearson’s correlation analysis of the level of plasma PAUF and body weight loss in patients with pancreatic cancer. d Analysis of the skeletal muscle area and intermuscular fat area determined by abdominal CT scans in patients (SMA skeletal muscle area, IMA intermuscular fat area). e Graphs represent the number of associated genes (STRING [Search Tool for the Retrieval of Interacting Genes], version 10.5) for PAUF. The tables represent the significant biological processes, molecular functions, cellular components, and key pathways evaluated using STRING.
Fig. 7
Fig. 7. Aberrant expression of PAUF (ZG16b) and Kaplan–Meier-analyzed overall survival in pancreatic cancer.
a PAUF expression in nontumor and tumor groups determined from gene expression data from NCBI GEO (accession numbers GSE15471, GSE16515, GSE28735, GSE32676, GSE55643, and GSE62452). b Relationship between PAUF expression and overall survival in the TCGA pancreatic cancer cohort (TCGA-PAAD). Gene expression was dichotomized into high and low values using the mean as the cutoff. HR, hazard ratio. c Kaplan–Meier survival analysis and the log-rank test were used to analyze the overall survival of patients according to the copy number of the PAUF gene in TCGA-PAAD.

References

    1. Porporato PE. Understanding cachexia as a cancer metabolism syndrome. Oncogenesis. 2016;5:e200. - PMC - PubMed
    1. Damrauer JS, et al. Chemotherapy-induced muscle wasting: association with NF-kappaB and cancer cachexia. Eur. J. Transl. Myol. 2018;28:7590. - PMC - PubMed
    1. Barreto R, et al. Chemotherapy-related cachexia is associated with mitochondrial depletion and the activation of ERK1/2 and p38 MAPKs. Oncotarget. 2016;7:43442–43460. - PMC - PubMed
    1. Tisdale MJ. Mechanisms of cancer cachexia. Physiol. Rev. 2009;89:381–410. - PubMed
    1. Andreyev HJ, Norman AR, Oates J, Cunningham D. Why do patients with weight loss have a worse outcome when undergoing chemotherapy for gastrointestinal malignancies? Eur. J. Cancer. 1998;34:503–509. - PubMed

Publication types

MeSH terms

Substances