. 2021 Apr;592(7854):421-427.
doi: 10.1038/s41586-021-03343-3. Epub 2021 Mar 17.

Primate cell fusion disentangles gene regulatory divergence in neurodevelopment

Affiliations

Primate cell fusion disentangles gene regulatory divergence in neurodevelopment

Rachel M Agoglia et al. Nature. 2021 Apr.

Abstract

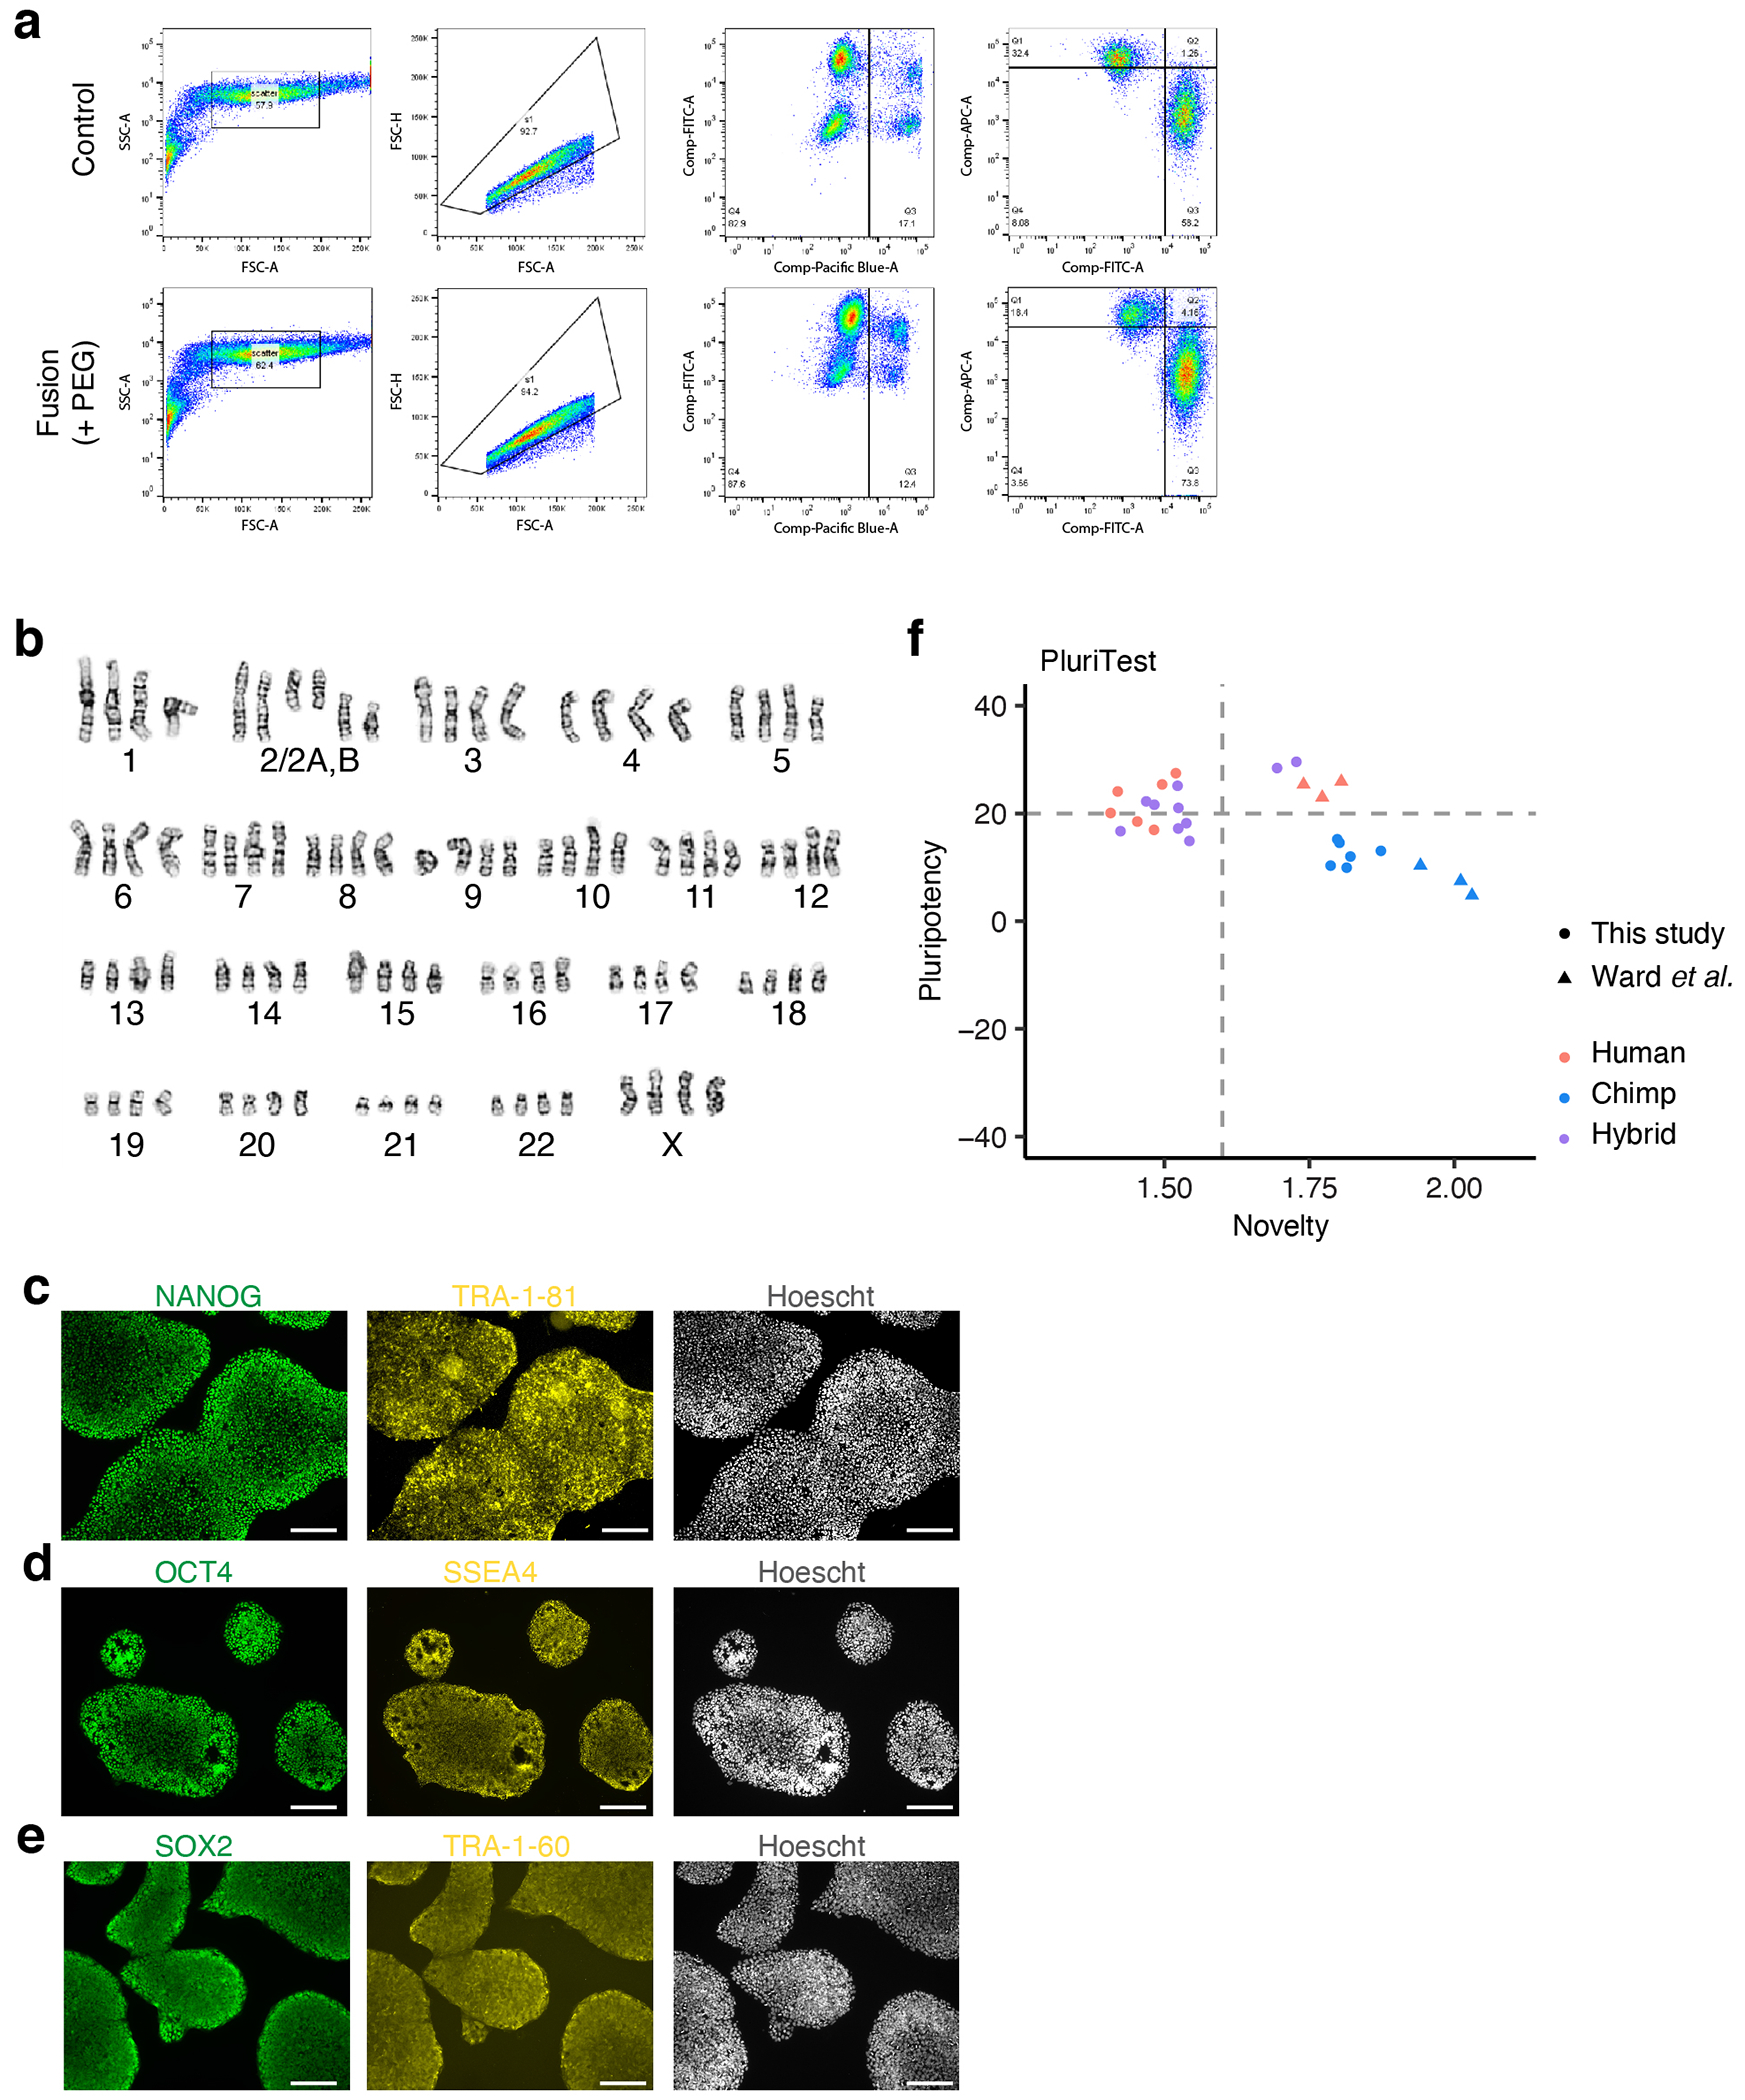
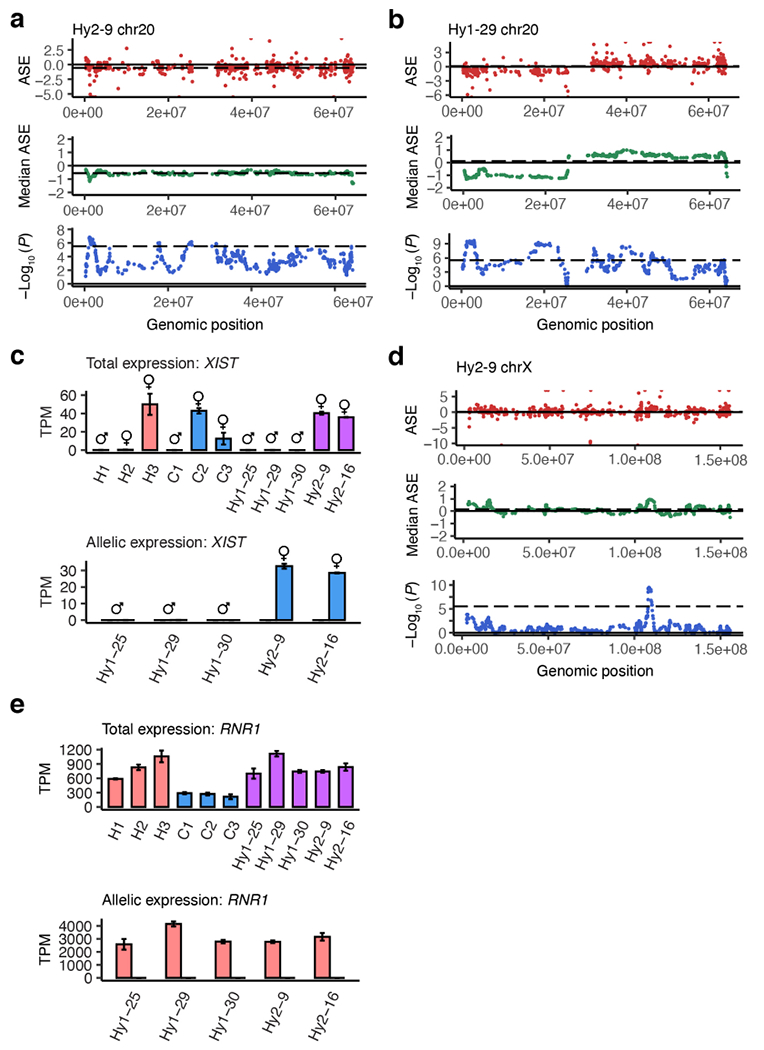
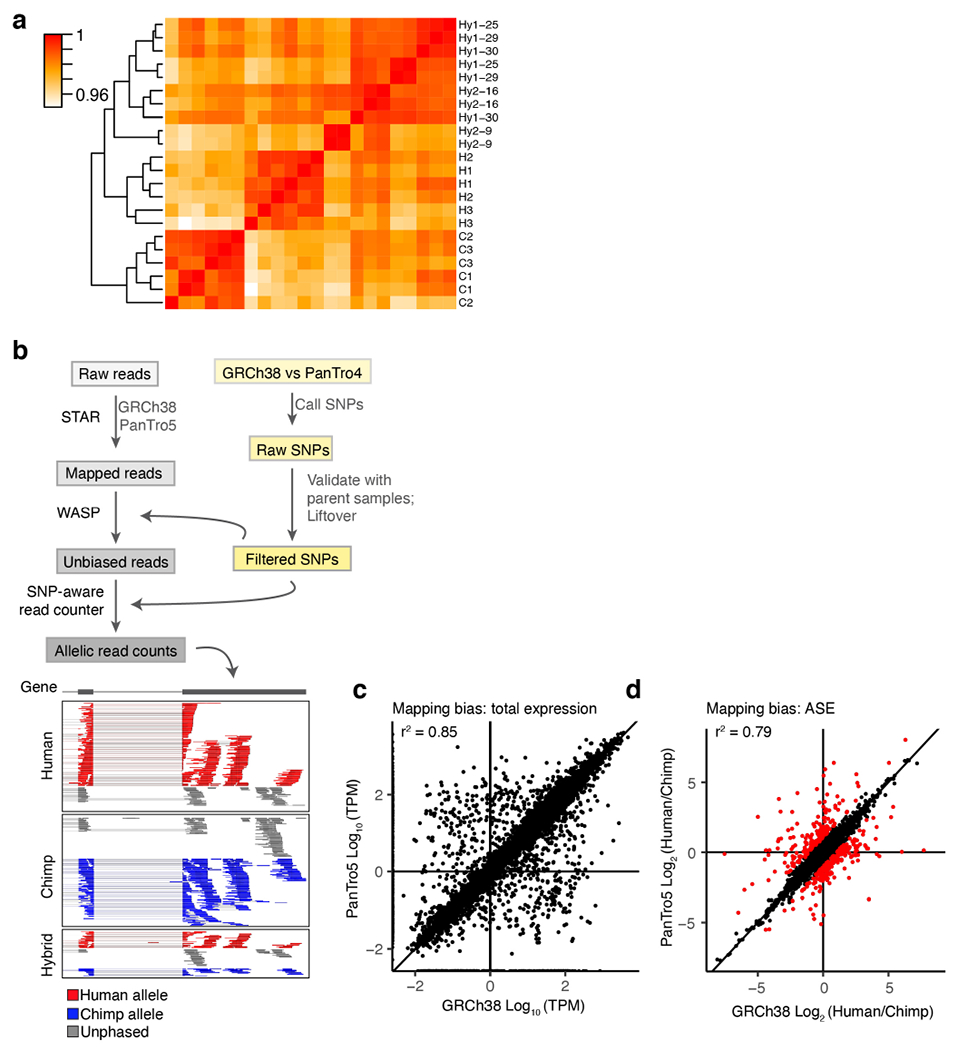
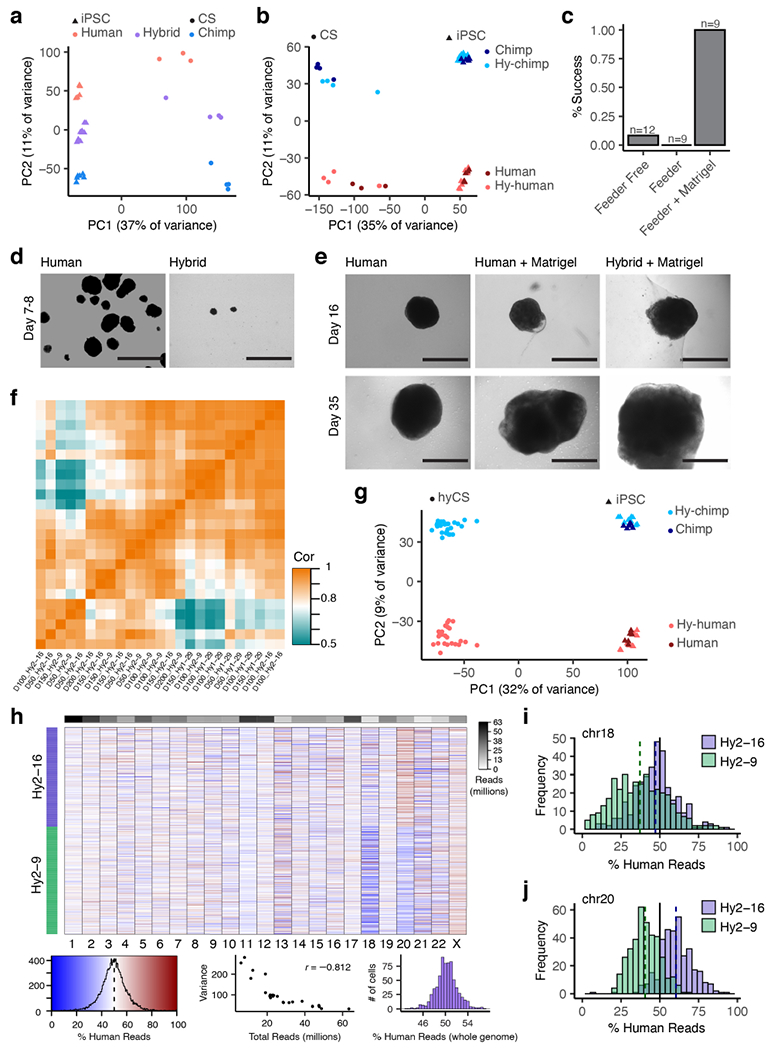
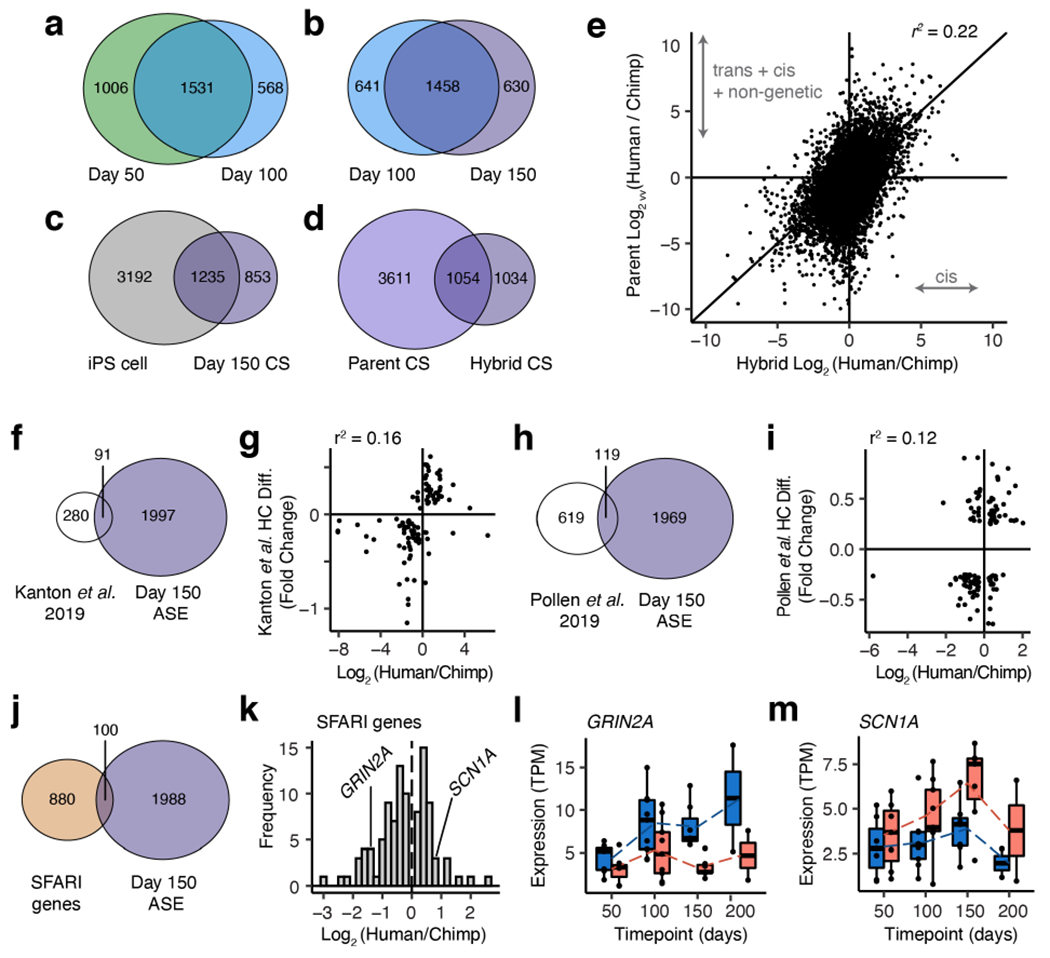
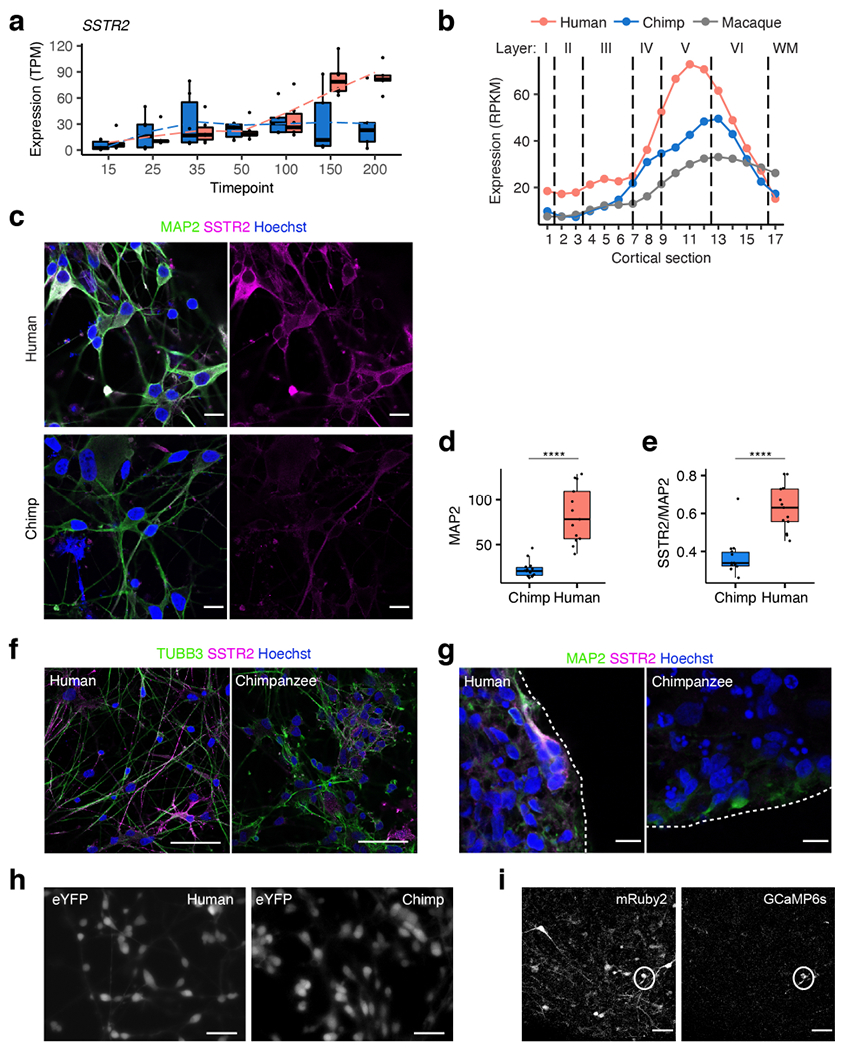
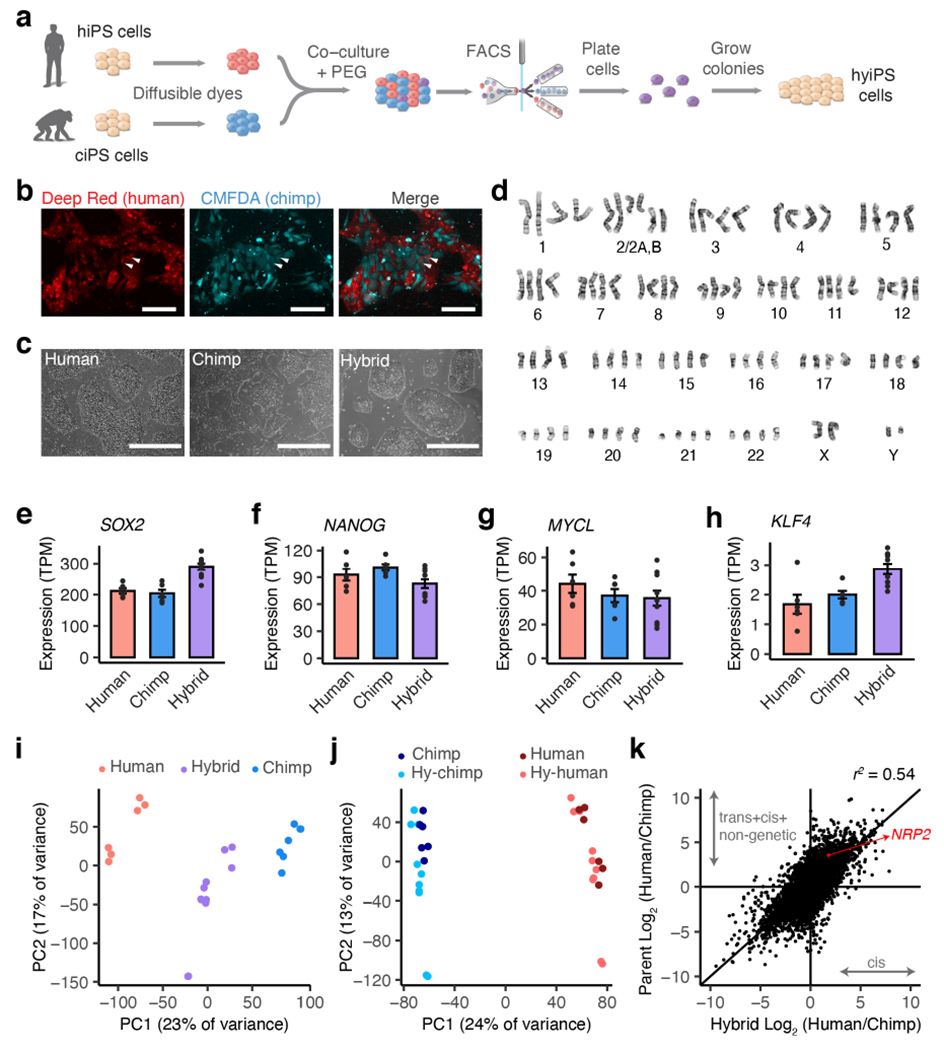
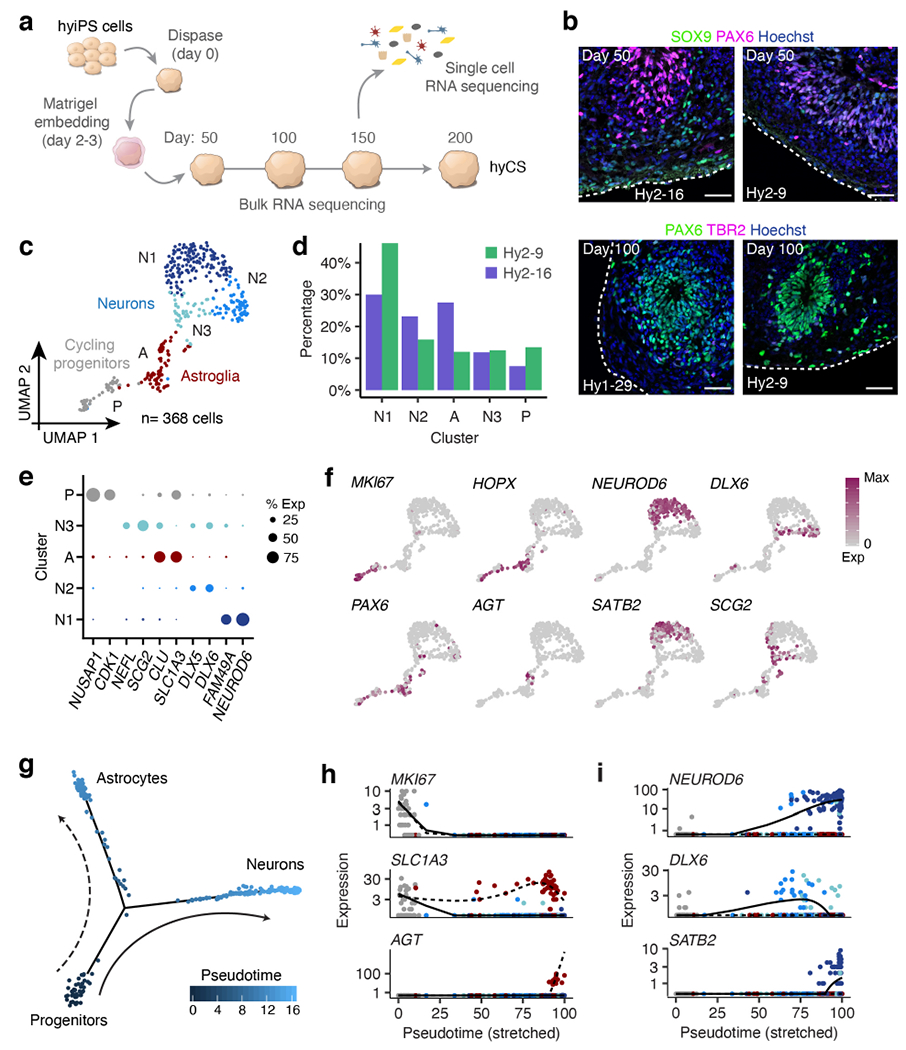
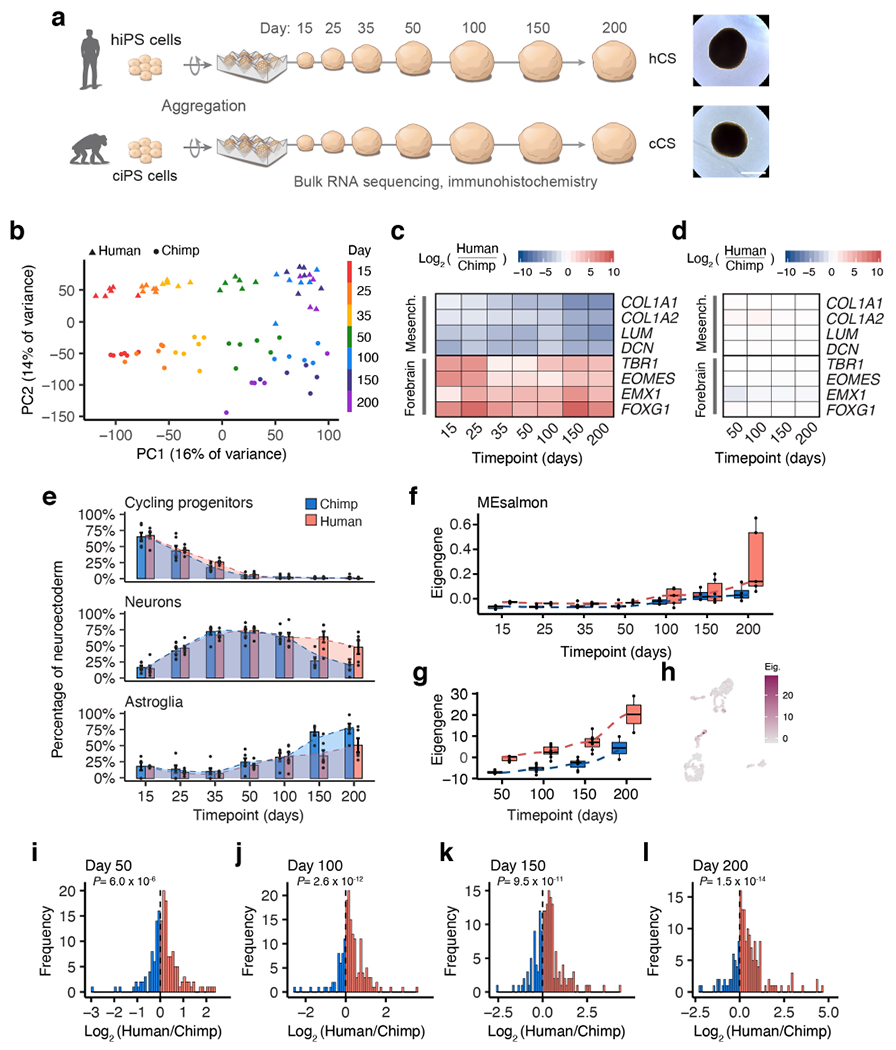
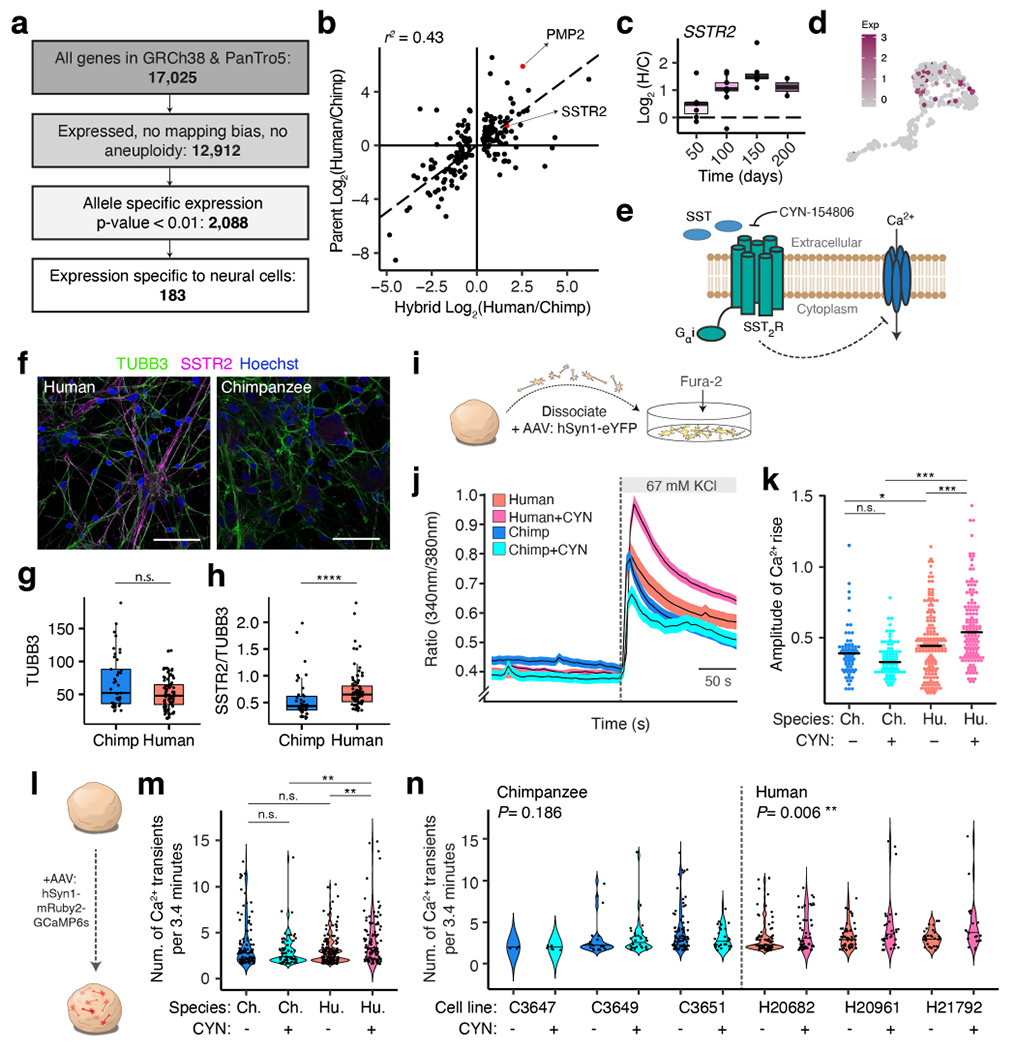
Among primates, humans display a unique trajectory of development that is responsible for the many traits specific to our species. However, the inaccessibility of primary human and chimpanzee tissues has limited our ability to study human evolution. Comparative in vitro approaches using primate-derived induced pluripotent stem cells have begun to reveal species differences on the cellular and molecular levels1,2. In particular, brain organoids have emerged as a promising platform to study primate neural development in vitro3-5, although cross-species comparisons of organoids are complicated by differences in developmental timing and variability of differentiation6,7. Here we develop a new platform to address these limitations by fusing human and chimpanzee induced pluripotent stem cells to generate a panel of tetraploid hybrid stem cells. We applied this approach to study species divergence in cerebral cortical development by differentiating these cells into neural organoids. We found that hybrid organoids provide a controlled system for disentangling cis- and trans-acting gene-expression divergence across cell types and developmental stages, revealing a signature of selection on astrocyte-related genes. In addition, we identified an upregulation of the human somatostatin receptor 2 gene (SSTR2), which regulates neuronal calcium signalling and is associated with neuropsychiatric disorders8,9. We reveal a human-specific response to modulation of SSTR2 function in cortical neurons, underscoring the potential of this platform for elucidating the molecular basis of human evolution.


Conflict of interest statement

Competing interest declaration

Stanford University holds a patent covering the generation of region-specific brain organoids (U.S. Patent Serial No. 62/163,870;8) (S.P.P.).

Figures

Extended Data Figure 1 |
Extended Data Figure 1 |. Isolation and characterization of hyiPS cells.
a, Fluorescence-activated cell sorting (FACS) of fused hybrid cells (representative plots for fusion of H20961 and C3649); top panel, co-cultured cells with no PEG; bottom panel, co-cultured cells with PEG; from left: initial size selection, gating out doublets, gating out dead cells, sorting for red (human) and green (chimpanzee) double positive population; FSC forward scatter, SSC side scatter, -A area, -H height; Pacific Blue measures DAPI, FITC measures Green CMFDA (chimpanzee), and APC measures Deep Red (human). b, Representative karyotype for female (XX/XX) hybrid iPS cell lines. c-e, Immunostaining for the pluripotency markers NANOG, Tra-1-81 (c), OCT4, SSEA4 (d), SOX2, Tra-1-60 (e). f, Results from PluriTest analysis of RNA-sequencing data from this study and from Ward et al. (see Methods); benchmarked thresholds are 20 or higher for pluripotency, 1.6 or lower for novelty (dotted lines). Scale bars, 200 μm (c-e).
Extended Data Figure 2 |
Extended Data Figure 2 |. Chromosomal instability and X chromosome inactivation.
a-b, Plots showing aneuploidies on chromosome 20 indicating a gain of a chimpanzee chromosome (a) or a combined loss of the human short arm and gain of the human long arm (b); top panel, scatter plot of allele specific expression (ASE = log2[human/chimpanzee]) versus genomic location; middle panel, median ASE in a sliding window of 20 genes; bottom panel, P-values from a two-sided Wilcoxon rank sum test comparing a sliding window of 20 genes to the background of the entire genome. c, Total (top panel) and allelic (bottom panel; human allele pink, chimpanzee allele blue) expression (TPM, transcripts per million) of XIST in RNA-seq samples; symbols indicate the sex of each iPS cell line; n= 2 technical replicates per cell line. d, Plots of ASE across the X chromosome (as in a-b). e, Total and allelic expression of RNR1 (chrMT), as in (c); n= 2 technical replicates per cell line.
Extended Data Figure 3 |
Extended Data Figure 3 |. RNA-sequencing of hyiPS cells.
a, Heat map of correlations (Pearson’s) between RNA-seq samples from human (H1, H2, H3), chimpanzee (C1, C2, C3) and hybrid (Hy1-25, -29, -30, Hy2-9, -16) iPS cells. b, Top panel, pipeline for analysis of RNA-seq data and separation of species-specific sequencing reads; bottom panels, pileup of phased allelic reads from human, chimpanzee and hybrid RNA-seq samples for a representative gene. c, Representative scatter plot (from line Hy1-30) showing total gene expression (TPM, transcripts per million) when samples are mapped to the human genome (GRCh38, x-axis) versus the chimpanzee genome (PanTro5, y-axis); n= 1, out of 10 total hyiPS samples sequenced with similar results. d, Scatter plot of allele specific expression (ASE) in all hybrid samples when mapped to the human versus the chimpanzee genome; genes represented by the points in red are considered to have mapping bias and are eliminated from subsequent analyses; data merged from n= 10 samples from 5 hyiPS cell lines (2 replicates each).
Extended Data Figure 4 |
Extended Data Figure 4 |. Generation and characterization of hyCS.
a-b, Principal components plots for iPS and CS (pilot study) RNA-seq samples based on total (a) or allelic gene expression (b). c, Rates of success of three protocols used to derive hyCS (success is defined as at least one CS from a given cell line surviving to 100 days of differentiation); n refers to the number of independent attempts to differentiate any of 3 hyiPS cell lines. d, Bright field imaging of hCS and hyCS at day 7-8 of differentiation; experiment was repeated across 3 independent differentiation experiments of 3 hyiPS and 1 hiPS cell line with similar results. e, Bright field images of Matrigel™-embedded hCS and hyCS, as well as non-embedded hCS, at days 16 and 35 of differentiation. f, Heatmap of correlations (Pearson’s) between bulk RNA-seq samples for hyCS. g, Principal components plot for iPS and hyCS (full data set) RNA-seq samples based on allelic gene expression h, Heatmap colored by the percentage of human reads in each single cell, stratified by chromosome; rows are ordered by hybrid cell line; top bar shows read depth of each chromosome across all cells; bottom left, color key and histogram for heatmap values; bottom middle, scatter plot of total read depth versus variance per chromosome, wherein fewer reads results in higher variance; bottom right, histogram showing the percent of human reads in each cell, genome-wide. i-j, Histogram of the percentage of human reads in each cell for aneuploid chromosomes 18 (i) and 20 (j), stratified by cell line. Scale bars, 1 mm (d-e).
Extended Data Figure 5 |
Extended Data Figure 5 |. Single cell gene profiling of hyCS.
a, UMAP clustering of all cells (n= 706); clusters are identified by color and labelled by letter (A= astroglia, P= cycling progenitors, N1= glutamatergic neurons, N2= GABAergic neurons, M1= mesenchyme cluster 1, M2= mesenchyme cluster 2, E= epithelial cells). b, Proportion of cells from each hybrid cell line in each single cell cluster (from a). c, Dotplot for expression of marker genes for each cluster in (a), size corresponds to the percent of cells in each cluster that express each gene. d, UMAP colored by expression of mesenchymal and epithelial marker genes. e, Scatter plot of normalized gene expression between embedded (y-axis) and non-embedded (x-axis) hybrid (line Hy1-29) CS at day 50 of differentiation; points in red and green indicate genes whose expression is induced by the addition of Matrigel™ (see Methods). f, tSNE of all single cells from this study aggregated with cells from non-embedded spheroids in Sloan et al., colored by study. g, tSNE from (f) colored by expression of cell-type marker genes. h, UMAP from (a) colored according to which cells were defined as neural and used for further analysis in Fig. 3. i, Histograms of per-gene ASE, where ASE is defined as the ratio of all human reads across cells of a given cell type to all chimpanzee reads in those cells.
Extended Data Figure 6 |
Extended Data Figure 6 |. Generation of hCS and cCS and RNA-sequencing.
a-b, Representative bright field images of three CS per line for three human (a) and three chimpanzee (b) cell lines at day 166. c, Immunostaining of hCS and cCS for SOX9, PAX6 and CTIP2; at each time point, a maximum of 2 spheroids were fixed for immunostaining across 3 hiPS and 3 ciPS cell lines with 4 independent differentiation experiments per cell line. d-e, Heatmap of correlations (Pearson’s) between bulk RNA-seq samples for hCS (d) and cCS (e). Scale bars, 1 mm (a-b), 50 μm (c).
Extended Data Figure 7 |
Extended Data Figure 7 |. RNA-seq and cell type deconvolution in cortical spheroids.
a-b, Principal components plots for RNA-seq samples based on total gene expression of parent and hybrid samples. c, e, g, Per-sample estimated cell type proportions in hyCS (c), hCS (e) and cCS (g) (see Methods). d, f, h, Normalized expression across time of cell-type specific marker genes in hyCS (d), hCS (f) and cCS (h); TPM, transcripts per million.
Extended Data Figure 8 |
Extended Data Figure 8 |. Weighted gene co-expression network analysis
a, Dendrogram of all genes used in WGCNA; genes in the same color block belong to the same co-expressed module. b, Eigengene values for genes in the Blue, Brown and Red modules over time in hCS and cCS; chimpanzee blue, human red; in order of time points, n= 6, 6, 6, 6, 6, 6, 5 hCS and n= 6, 6, 6, 6, 5, 5, 5 cCS samples from 3 human and 3 chimpanzee iPS cell lines (1-2 replicates per cell line). c, Expression of module genes (eigengene, see Methods) in single cell data; cell clusters are defined in Extended Data Fig. 5a. d, Allelic eigengene values for genes in these modules over time in hyCS (see Methods); chimpanzee blue, human red; n as in (b). e, Single cell gene expression of PMP2. f, Expression of PMP2 in parental bulk time course; chimpanzee blue, human red; n as in (b). g, Allelic expression of PMP2 in hybrid bulk time course; chimpanzee allele blue, human allele red; n as in (b). Box plots in (b, d, f, g): center line, median; box limits, upper and lower quartiles; whiskers, 1.5x interquartile range, dotted lines connect average values.
Extended Data Figure 9 |
Extended Data Figure 9 |. Summary of ASE genes.
a-d, Overlap in genes with significant ASE (a,b,c; d hybrid) or differential expression (d parent) across bulk data sets; data in (d) are from day 150. e, Scatter plot showing differences in gene expression between parent lines (y-axis) versus between alleles in the hybrid (x-axis) at day 150; data are from bulk RNA-seq of 6 human, 5 chimpanzee and 7 hybrid CS samples, collected across 3 human, 3 chimpanzee and 3 hybrid iPS cell lines. f, Overlap between ASE genes and SFARI genes. g, ASE in SFARI genes from the overlapping genes in (f). h-i, Allelic expression (TPM, transcripts per million) over time in GRIN2A and SCN1A; human allele pink, chimpanzee allele blue; in order of time points n= 7, 9, 7, 2 hyCS samples (1-2 spheroids per sample) from 3 independent differentiations of 3 hyiPS cell lines. j, Filtering pipeline for prioritizing candidate genes. k, Scatter plot of hybrid ASE (x-axis) and parental differential expression (y-axis) for top candidate genes at day 150; n= 7 hyCS, 6 hCS, and 5 cCS samples (1-3 spheroids per sample) derived from 3 iPS cell lines per species and 2 independent differentiations per hiPS and ciPS cell line, n= 3 independent differentiations per hyiPS cell line. Box plots in (h, i): center line, median; box limits, upper and lower quartiles; whiskers, 1.5x interquartile range; dotted lines connect average values.
Extended Data Figure 10 |
Extended Data Figure 10 |. Validation of SSTR2.
a, Expression of SSTR2 in parental bulk time course; chimpanzee blue, human red; in order of time points, n= 6, 6, 6, 6, 6, 6, 5 hCS and n= 6, 6, 6, 6, 5, 5, 5 cCS samples from 3 human and 3 chimpanzee iPS cell lines (1-2 replicates per cell line). b, Expression of SSTR2 across cortical sections in adult primate brain tissue (data from He et al.); dotted lines indicate approximate boundaries of cortical layers; WM, white matter. c, Immunostaining for MAP2 (neuronal) and SSTR2 protein in dissociated hCS (H20682) and cCS (C3649) at day 225-250; right panels show SSTR2 only; 10 images were taken per sample and quantified. d, Quantification of fluorescence intensity (arbitrary units) of MAP2 for the images in (c); n= 13 cells for hCS, 14 cells for cCS; **** P<0.0001, two-tailed Mann-Whitney test. e, Quantification of fluorescence intensity (arbitrary units) of SSTR2 relative to MAP2 for the images in (c); n= 13 cells for hCS, 14 cells for cCS; **** P<0.0001, two-tailed Mann-Whitney test. f, Additional immunostaining for TUBB3 (neuronal) and SSTR2 in dissociated hCS (H20682) and cCS (C3649) at day 225-250; 10 images were taken per sample and quantified. g, Immunostaining for MAP2 and SSTR2 in whole hCS (H20961) and cCS (C3651) at day 160; imaging was reproduced across 3 human and two chimpanzee cell lines from one differentiation experiment with n= 3, 2, 3, 2, 3 images for lines H21792, H20682, H20961, C3649 and C3651, respectively. h, Representative still frame images of hCS (H20682) and cCS (C3649) derived neurons infected with AAV-DJ-hSyn1-eYFP; images are taken from one of the samples in Fig 4g-i; experiment was reproduced across 2 human and 1 chimpanzee cell line. i, Representative still frame images of hCS (H20682) infected with the viral vector co-encoding stable red fluorophore mRuby2 and genetically encoded calcium indicator GCaMP6s; images are taken from one of the samples in Fig. 4j-l; experiment was reproduced across 3 human and 3 chimpanzee cell lines. Box plots in (a, d, e): center line, median; box limits, upper and lower quartiles; whiskers, 1.5x interquartile range; dotted lines connect average values (a). Scale bars, 50 μm (f), 10 μm (c, g), 60 μm (h), 30 μm (i).
Figure 1 |
Figure 1 |. Generation of human-chimpanzee hybrid iPS cells.
a, Generation of hybrid iPS cells. b, Fluorescent imaging of co-cultured human (H20961) and chimpanzee (C3649) iPS cells; arrows indicate putative hybrid cells; experiment was reproduced for 2 pairs of fusion cell lines to generate 5 hybrid cell lines. c, Bright field images of human (H20682), chimpanzee (C3649) and hybrid (Hy1-29) iPS cell colonies in feeder-free conditions; n= 3 human, 3 chimpanzee and 5 hybrid cell lines were cultured in this study. d, Representative karyotype for male (XY/XY) hybrid iPS cell lines. e-h, Gene expression (TPM, transcripts per million) for pluripotency markers SOX2, NANOG, MYCL, and KLF4 in human (n= 3 iPS cell lines, 2 replicates each), chimpanzee (n= 3 iPS cell lines, 2 replicates each) and hybrid (n= 5 iPS cell lines, 2 replicates each); error bars, mean ± s.e.m. i-j, Principal components plot for RNA-seq samples based on total gene expression (i) or allelic gene expression (j). k, Scatter plot showing differences in gene expression between parent cell lines (y-axis) versus between alleles in the hybrid cells (x-axis); data are from bulk RNA-seq of 3 human, 3 chimpanzee and 5 hybrid iPS cell lines, all with 2 replicates each. Scale bars, 100 μm (b), 400 μm (c).
Figure 2 |
Figure 2 |. Cortical differentiation of hybrid iPS cells.
a, Generation of CS from hybrid iPS cells. b, Immunostaining of hyCS for SOX9, PAX6 and TBR2; at each time point, a maximum of 2 spheroids were fixed for immunostaining across n= 3 hybrid cell lines with n= 3 independent differentiation experiments per cell line. c, UMAP clustering of all neural cells (n= 368); clusters are identified by color and labelled by letter (A= astroglia, P= cycling progenitors, N1= glutamatergic neurons, N2= GABAergic neurons cluster 1, N3= GABAergic neurons cluster 2). d, Proportion of CS cells from each hybrid cell line in each single cell cluster (from c). e, Dotplot for expression of marker genes for each cluster in (c), size corresponds to the percent of cells in each cluster that express each gene. f, UMAP colored by expression of marker genes. g, Cell trajectory map of neural cells (n= 349) colored by pseudotime. h-i, Branch-specific expression of marker genes over pseudotime for glial cells (h) and neurons (i), colored by cell type as in (c); solid and dashed lines correspond to those in (g); lines are natural spline curves for each lineage over scaled pseudotime. Scale bars, 50 μm (b).
Figure 3 |
Figure 3 |. Disentangling cis regulatory effects on gene expression in CS.
a, Generation of cortical spheroids (CS) from human and chimpanzee iPS (iPS) cells; bright field images of representative human and chimpanzee CS (lines H21792 and C3651) at day 166; images were chosen from n= 3 human and 3 chimpanzee iPS cell lines each with n= 5 spheroids imaged from a single differentiation experiment. b, Principal components plot for RNA-seq samples based on total gene expression. c, Heat map of differential expression (log2[fold-change]) between hCS and cCS for forebrain and mesenchyme-related marker genes. d, Heat map of allele specific expression (log2[fold-change]) in hybrid spheroids for forebrain and mesenchyme-related marker genes. e, Estimated cell type proportions over time in hCS and cCS, normalized as a percentage of neuroectodermal cell types; error bars, mean ± s.e.m.; curved line from LOWESS regression; in order of time points, n= 6, 6, 6, 6, 6, 6, 5 hCS and n= 6, 6, 6, 6, 5, 5, 5 cCS samples from 3 human and 3 chimpanzee iPS cell lines (1-2 replicates per cell line). f, Eigengene values for genes in the Salmon module (from weighted gene co-expression network analysis) over time in hCS and hCS; n as in (e). g, Allelic eigengene values for genes in the Salmon module over time in hyCS (see Methods); n as in (e). h, Expression of Salmon module genes (colored by eigengene rank, see Methods) in Monocle pseudotime plot; cell trajectories and pseudotime are defined in Fig. 2g. i-l, Histogram of ASE (log2[fold-change]) in all genes in the Salmon module, at each time point in bulk hyCS data; P-value from a two-sided Wilcoxon Rank Sum test, comparing module genes to all genes included in the co-expression analysis. Box plots in (f, g): center line, median; box limits, upper and lower quartiles; whiskers, 1.5x interquartile range. Scale bars, 1 mm (a).
Figure 4 |
Figure 4 |. Functional validation of allele specific gene expression changes.
a, Hybrid ASE for SSTR2; n=7, 9, 7, 2 hyCS samples (1-2 spheroids/sample) from 3 differentiations of 3 hyiPS cell lines. b, Single-cell gene expression of SSTR2. c, SSTR2 function. d, Immunostaining for TUBB3 and SSTR2 in dissociated hCS and cCS (day 225-250); 10 images/sample. e, Fluorescence intensity (arbitrary units) of TUBB3 for (d) and Extended Data Fig. 10f; n=87 cells (hCS), 41 cells (cCS); n.s., not significant, two-sided Mann-Whitney test. f, Fluorescence intensity of SSTR2 relative to TUBB3 for (d) and Extended Data Fig. 10f; n as in (e); ****P<0.0001, two-tailed Mann-Whitney test. g, Fura-2 imaging in dissociated CS. h, Mean fluorescence ratio of Fura-2; n=164 cells from 2 lines (human), n=142 cells from 2 lines (human +CYN), n=71 cells from 1 line (chimpanzee), n=87 cells from one line (chimpanzee +CYN) dissociated between day 225-250. i, Peak amplitude (mean maximum minus baseline) for each cell in (h) upon KCl depolarization; sample sizes as in (h); *P<0.05, ***P<0.001, two-tailed Wilcoxon rank sum test; left to right P=0.087, 0.020, 4.143x10⁻¹⁴, 5.082x10⁻⁵. j, GCaMP6s imaging in intact CS. k, Spontaneous GCaMP6s transients; n=161 cells (3 human lines), n=110 cells (3 human lines, +CYN), n=105 cells (3 chimpanzee lines), n=87 cells (3 chimpanzee lines, +CYN) at day 130-150; **P<0.01, two-tailed Wilcoxon rank sum test; from left to right, P=0.114, 0.272, 0.00118, 0.00134. l, Data in (k) by line; left to right, n=4, 6, 21, 30, 80, 30, 78, 58, 53, 31, 30, and 21 cells/line; left to right, n=1, 1, 4, 4, 4, 4, 2, 2, 2, 2, 5, and 5 CS/line; P-values from Fisher’s method χ2(4)=6.178 (chimpanzee), χ2(6)=18.059 (human); original per-line P-values from a two-tailed Wilcoxon rank sum test. Box plots in (a, e, f): center line, median; box limits, upper and lower quartiles; whiskers, 1.5x interquartile range. Scale bars, 10μm (d).

Comment in

References

    1. Gallego Romero I et al. A panel of induced pluripotent stem cells from chimpanzees: a resource for comparative functional genomics. Elife 4, e07103, doi: 10.7554/eLife.07103 (2015). - DOI - PMC - PubMed
    1. Prescott SL et al. Enhancer divergence and cis-regulatory evolution in the human and chimp neural crest. Cell 163, 68–83, doi: 10.1016/j.cell.2015.08.036 (2015). - DOI - PMC - PubMed
    1. Pasca SP The rise of three-dimensional human brain cultures. Nature 553, 437–445, doi: 10.1038/nature25032 (2018). - DOI - PubMed
    1. Muchnik SK, Lorente-Galdos B, Santpere G & Sestan N Modeling the Evolution of Human Brain Development Using Organoids. Cell 179, 1250–1253, doi: 10.1016/j.cell.2019.10.041 (2019). - DOI - PMC - PubMed
    1. Qian X, Song H & Ming GL Brain organoids: advances, applications and challenges. Development 146, doi: 10.1242/dev.166074 (2019). - DOI - PMC - PubMed

Methods References

    1. Yoon SJ et al. Reliability of human cortical organoid generation. Nat Methods 16, 75–78, doi: 10.1038/s41592-018-0255-0 (2019). - DOI - PMC - PubMed
    1. van de Geijn B, McVicker G, Gilad Y & Pritchard JK WASP: allele-specific software for robust molecular quantitative trait locus discovery. Nat Methods 12, 1061–1063, doi: 10.1038/nmeth.3582 (2015). - DOI - PMC - PubMed
    1. Tehranchi A et al. Fine-mapping cis-regulatory variants in diverse human populations. Elife 8, doi: 10.7554/eLife.39595 (2019). - DOI - PMC - PubMed
    1. Combs PA & Fraser HB Spatially varying cis-regulatory divergence in Drosophila embryos elucidates cis-regulatory logic. PLoS Genet 14, e1007631, doi: 10.1371/journal.pgen.1007631 (2018). - DOI - PMC - PubMed
    1. Birey F et al. Assembly of functionally integrated human forebrain spheroids. Nature 545, 54–59, doi: 10.1038/nature22330 (2017). - DOI - PMC - PubMed

Publication types

Substances