. 2021 Apr;592(7853):296-301.
doi: 10.1038/s41586-021-03341-5. Epub 2021 Mar 17.

The AIM2 inflammasome exacerbates atherosclerosis in clonal haematopoiesis

Affiliations

The AIM2 inflammasome exacerbates atherosclerosis in clonal haematopoiesis

Trevor P Fidler et al. Nature. 2021 Apr.

Abstract

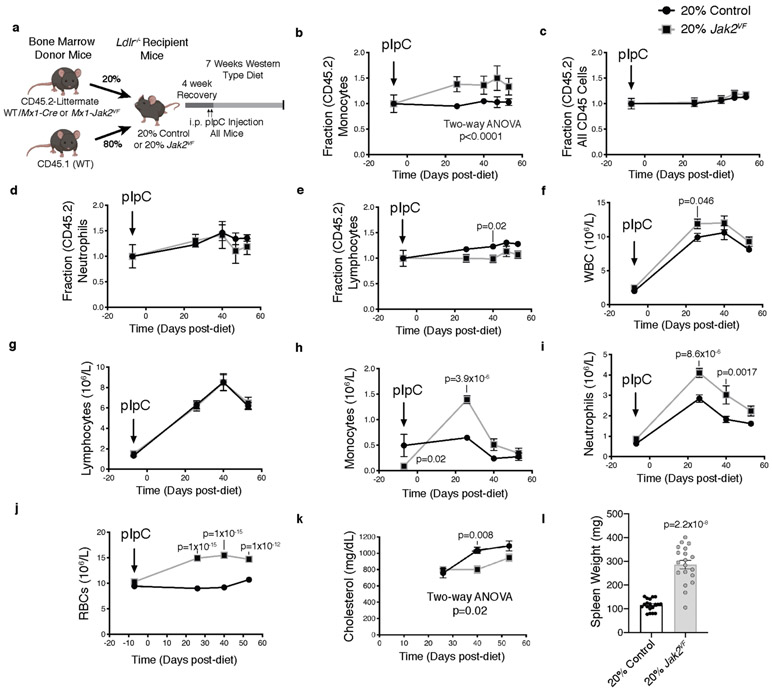
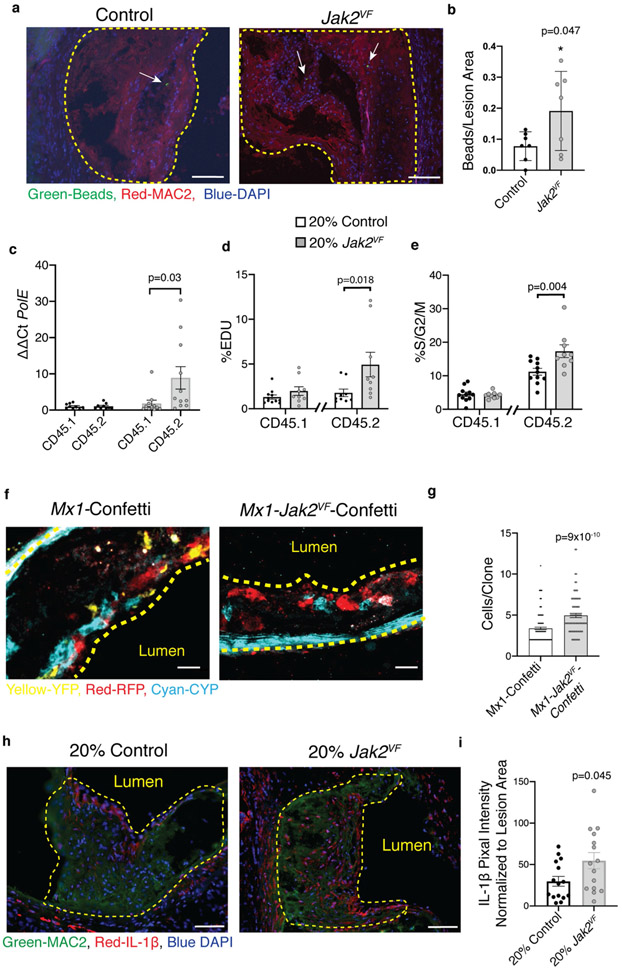
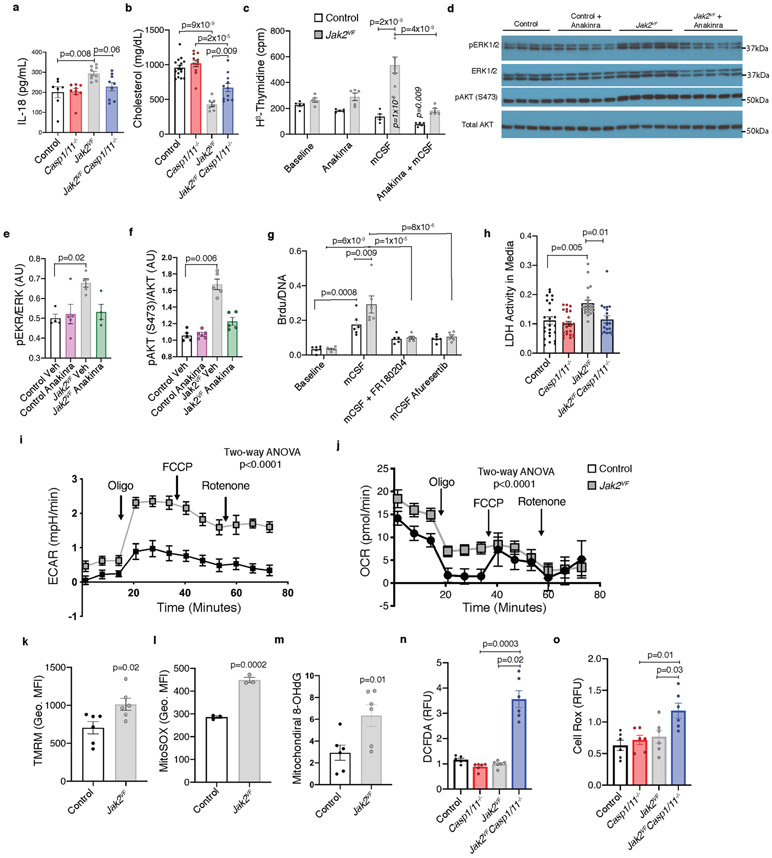
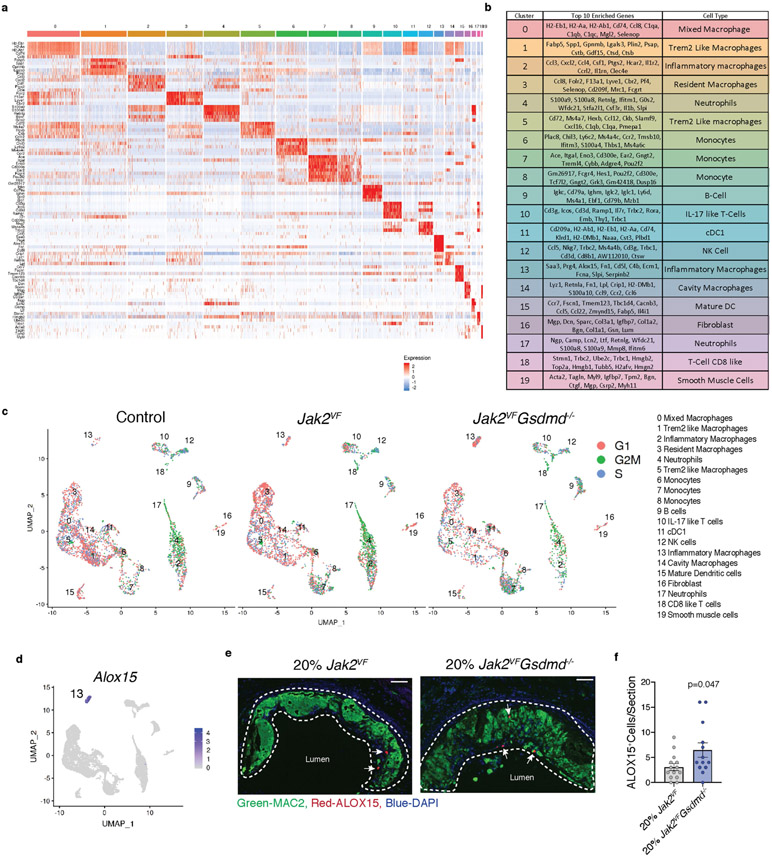
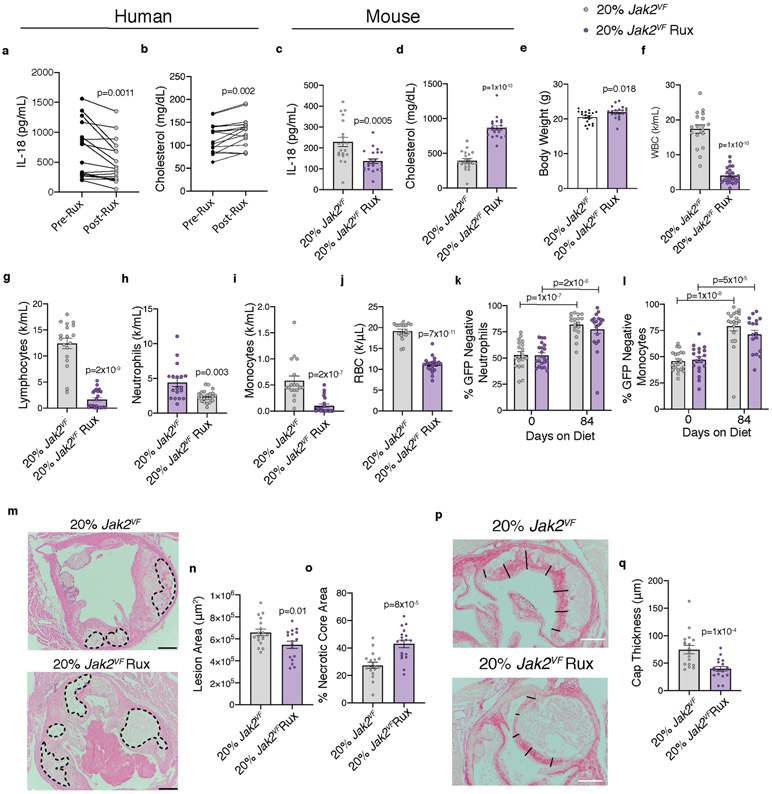
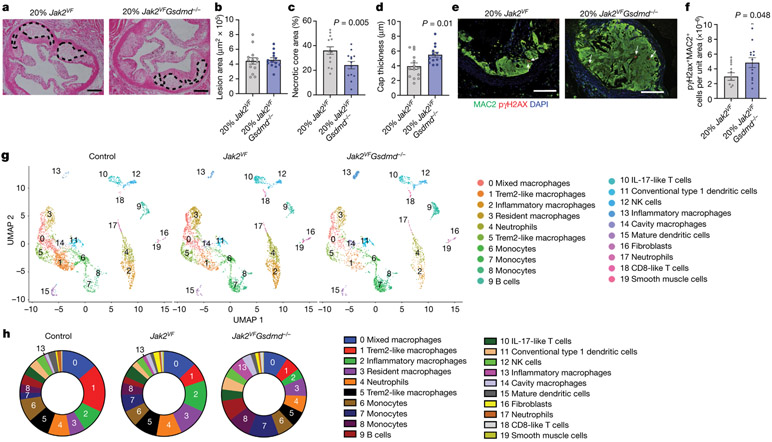
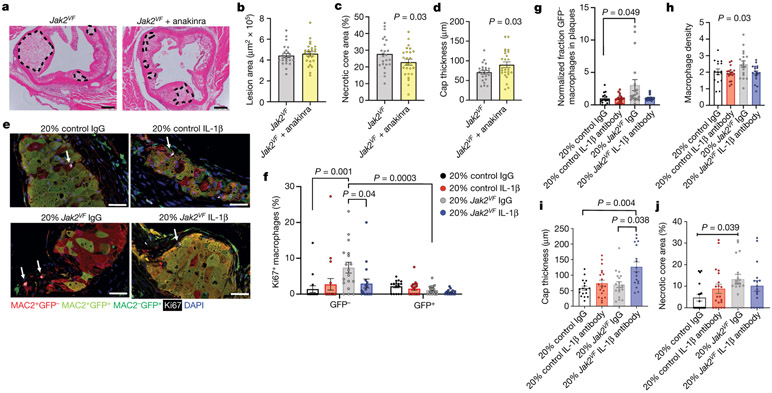
Clonal haematopoiesis, which is highly prevalent in older individuals, arises from somatic mutations that endow a proliferative advantage to haematopoietic cells. Clonal haematopoiesis increases the risk of myocardial infarction and stroke independently of traditional risk factors1. Among the common genetic variants that give rise to clonal haematopoiesis, the JAK2V617F (JAK2VF) mutation, which increases JAK-STAT signalling, occurs at a younger age and imparts the strongest risk of premature coronary heart disease1,2. Here we show increased proliferation of macrophages and prominent formation of necrotic cores in atherosclerotic lesions in mice that express Jak2VF selectively in macrophages, and in chimeric mice that model clonal haematopoiesis. Deletion of the essential inflammasome components caspase 1 and 11, or of the pyroptosis executioner gasdermin D, reversed these adverse changes. Jak2VF lesions showed increased expression of AIM2, oxidative DNA damage and DNA replication stress, and Aim2 deficiency reduced atherosclerosis. Single-cell RNA sequencing analysis of Jak2VF lesions revealed a landscape that was enriched for inflammatory myeloid cells, which were suppressed by deletion of Gsdmd. Inhibition of the inflammasome product interleukin-1β reduced macrophage proliferation and necrotic formation while increasing the thickness of fibrous caps, indicating that it stabilized plaques. Our findings suggest that increased proliferation and glycolytic metabolism in Jak2VF macrophages lead to DNA replication stress and activation of the AIM2 inflammasome, thereby aggravating atherosclerosis. Precise application of therapies that target interleukin-1β or specific inflammasomes according to clonal haematopoiesis status could substantially reduce cardiovascular risk.


Figures

Extended Data Fig. 1 ∣
Extended Data Fig. 1 ∣. Bulk RNA-seq analysis of CD11b+ splenocytes.
a, b, Gene ontology analysis of CD11b+ splenocytes from wild-type (a; n = 6 control, n = 7 Jak2VF mice) and Ldlr−/− recipient mice (b; n = 6 control, n = 4Jak2VF mice) containing bone marrow from control or Mx1-Jak2VF transgenic mice.
Extended Data Fig. 2 ∣
Extended Data Fig. 2 ∣. Monocyte/macrophage- and neutrophil-specific expression of Jak2VF.
a, Scheme of experimental procedures for atherosclerosis studies in mice with monocyte/macrophage-specific expression of Jak2VF. b, qPCR analysis of Jak2VF mRNA in blood monocytes (n = 4 samples (3 mice pooled per sample,12-total mice per genotype)) and neutrophils (n = 5 (3 mice pooled per sample, 15 total mice per genotype)). c, Serum cholesterol levels (n = 14, 18, 19 control, n = 13, 18, 19 Jak2VF mice for day 21, 56, 83, respectively). d, Scheme of experimental procedure for studies of mice with neutrophil-specific expression of Jak2VF. e, qPCR analysis of Jak2VF mRNA in blood monocytes and neutrophils. Each point indicates four mice pooled together (n = 3 pooled samples, 12 total mice per genotype). f, Serum cholesterol levels. g–k, Quantification of lesion area (g), percentage necrotic core area (h), percentage macrophage area (i), percentage collagen area (j), and percentage smooth muscle cell (SMC) area (k; n = 12 control, n = 9 Jak2VF mice). Mean ± s.e.m.; two-tailed Mann–Whitney test (g), two-tailed t-test (f, h–k), two-way ANOVA followed by Bonferroni multiple comparison post hoc test (b, c, e).
Extended Data Fig. 3 ∣
Extended Data Fig. 3 ∣. Jak2VF allele burden and blood cell counts in mice with Jak2VF clonal haematopoiesis.
a, Experimental design for Jak2VF clonal haematopoiesis mice. b–e, Fraction CD45.2:CD45.1 (Jak2VF/control:CD45.1) in blood monocytes (b), all CD45+ cells (c), neutrophils (d), and lymphocytes (e); black arrow, induction of Mx1-cre (n = 10, 19, 18, 9, 20 control, n = 9, 18, 19, 9, 17 Jak2VF mice, for day −7, 26, 40, 47, 53, respectively). f–, Blood cell counts of white blood cells (f; WBC), lymphocytes (g), monocytes (h), neutrophils (i), and red blood cells (j; RBCs) (n = 17, 19, 10, 21 control, n = 17, 16, 10, 13 Jak2VF mice, for day −7, 26, 40, 53, respectively). k, Serum cholesterol (n = 17, 18, 19 control, n = 17, 12, 18 Jak2VF mice, for day 26, 40, 53, respectively). l, Spleen weight (n = 19 mice). Mean ± s.e.m.; two-tailed Mann–Whitney test (l), two-way ANOVA followed by Bonferroni multiple comparison post hoc test (b–k).
Extended Data Fig. 4 ∣
Extended Data Fig. 4 ∣. Jak2VF monocytes/macrophages have increased recruitment and proliferation in lesions.
a, Representative immunofluorescence images of aortic roots stained for latex beads (green), MAC2 (red), and DAPI (blue). White arrows, beads; scale bars, 100 μm. b, Quantification of beads in lesions. c, qPCR analysis of mRNA from CD11b+ aortic cells sorted for CD45.1 or CD45.2; PolE (n = 9 control, n = 11 Jak2VF mice). d, e, CD68+ cells isolated from aortas quantified for percentage EdU incorporation (d) and S/G2/M phase with propidium iodine staining (e; n = 11 control, n = 9 Jak2VF mice). f, Representative images of lesions from mice with Mx1-Confetti or Mx1-Jak2VF-Confetti expression in bone marrow. Cyan, cyan fluorescent protein (membrane-tethered CFP); yellow, membrane yellow fluorescent protein (cytoplasmic YFP); red, red fluorescent protein (cytoplasmic RFP). Yellow dashed lines, lesion boundary; scale bars, 25 μm. g, Quantification of the number of cells per clone in Confetti lesions (n = 149 control, n = 82 Jak2VF clones; four mice per group). h, Representative immunofluorescence images of aortic roots stained for MAC2 (green), IL-1β (red), and DAPI (blue). Scale bars, 50 μm. i, Quantification of total IL-1β fluorescent intensity normalized to area (n = 15 mice). Mean ± s.e.m.; two-tailed t-test (b), two-tailed Mann–Whitney test (d, e, g, i), Kruskal–Wallis two-tailed test with Dunn’s comparison (c).
Extended Data Fig. 5 ∣
Extended Data Fig. 5 ∣. IL-1β promotes increased ERK/AKT-driven proliferation of Jak2VF macrophages associated with increased glycolytic metabolism and mitochondrial ROS generation.
a, b, Quantification of serum IL-18 (a; n = 7 control, n = 9 Casp1/11−/−, n = 9 Jak2VF, n = 9 Casp1/11−/−Jak2VF mice) and cholesterol (b; n = 16 control, n = 11 Casp1/11−/−, n = 7 Jak2VF, n = 11 Casp1/11−/−Jak2VF mice) following 12-week WTD. c, Macrophage proliferation marked by 3H-thymidine incorporation into BMDMs during 16-h incubations (n = 4 biological replicates, replicated twice). d, Representative immunoblot analysis of BMDMs co-incubated with anakinra. e, f, Densitometric quantification of pERK1/2 (e; n = 4 control, n = 5 control + anakinra, n = 5 Jak2VF, n = 4 Jak2VF + anakinra; biological replicates from three mice pooled, representative of two experiments) and pAKT (f; n = 5 biological replicates from three mice pooled, representative of two experiments). g, Incorporation of BrdU into BMDMs co-incubated for 16 h with 100 ng ml−1 M-CSF and the indicated inhibitors (n = 6 biological replicates from three mice pooled, n = 5 M-CSF + FR180204). h, LDH release from non-stimulated BMDMs following 7-day culture (n = 24 control, n = 24 Casp1/11−/−, n = 22 Jak2VF, n = 19 Jak2VFCasp1/11−/− biological replicates from three mice repeated four times). i,j, Glycolysis rate indicated by the extracellular acidification rate (ECAR) (i) and mitochondrial respiration marked by oxygen consumption rate (OCR) (j; n = 15 control, n = 18 Jak2VF biological replicates repeated twice). k, Mitochondrial potential in CD11b+ splenocytes measured by tetramethylrhodamine, methyl ester, perchlorate (TMRM) geometric mean fluorescence intensity (geo. MFI) (n = 6 mice). l, MitoSOX geo. MFI in BMDMs (n = 3 mice). m, Quantification of mitochondrial localized 8-OHdG in BMDMs (n = 6 mice). n, o, Total cellular ROS in BMDMs marked by relative fluorescence units (RFU) of DCFDA (n) and Cell ROX (o; n = 6 biological replicates from three mice pooled). Mean ± s.e.m.; one-way ANOVA followed by Tukey’s post hoc test (a, b, e, o), Kruskal–Wallis two-tailed test with Dunn’s comparison (f, h, n), two-way ANOVA followed by Bonferroni’s multiple comparison post hoc test (c, g, i, j), two-tailed t-test (k–m).
Extended Data Fig. 6 ∣
Extended Data Fig. 6 ∣. JAK2VF macrophages display increased NLRP3 and AIM2 inflammasome activation.
a, b, IL-1β was quantified in medium from mouse BMDMs treated with pdAdT for 6 h (a) or LPS (20 ng ml−1; b) followed by a 1-h incubation with ATP (n = 6 biological replicates, representative of five experiments). Vertical P values are relative to LPS within the same genotype. c, d, IL-1β release from human iPSC-macrophages stimulated with pdAdT (c; n = 12 baseline, n = 6 treatments biological replicates representative of two experiments) and nigericin (d; n = 6 biological replicates, representative of two experiments). Vertical P values are relative to baseline within the same genotype. e, Immunoblot analysis of NLRP3 and AIM2 in protein lysates from BMDMs. f, g, Densiometric quantification of AIM2 (f) and NLRP3 (g; n = 8 biological replicates from four mice per group pooled together). h, Aim2 mRNA expression in BMDMs incubated in the presence of IFNY-neutralizing antibodies for 24 h (n = 6 biological replicates). i, Experimental scheme of atherosclerosis studies conducted in mice with Jak2VF bone marrow deficient in Nlrp3 or Aim2. j, k, Plasma cholesterol following 12-week WTD in Jak2VFNlrp3−/− (j; n = 15 Jak2VF, n = 19 Jak2VFNlrp3−/− mice) and Jak2VFAim2−/− mice (k; n = 24 Jak2VF, n = 25 Jak2VFAim2−/− mice). l. Representative immunofluorescence image of aortic roots stained for DAPI (blue) and AIM2 (magenta). Yellow dashed lines, lesions; scale bars, 50 μm. m, Quantification of AIM2 mean fluorescence intensity in lesions (n = 16 control, n = 18 Jak2VF mice). Mean ± s.e.m.; two-way ANOVA followed by Tukey’s post hoc test (a–d), one-way ANOVA followed by Tukey’s post hoc test (h), two-tailed t-test (j, k), two-tailed Mann–Whitney test (f, g, m).
Extended Data Fig. 7 ∣
Extended Data Fig. 7 ∣. Haematological parameters and atherosclerosis in Ldlr−/− mice transplanted with Gsdmd−/− bone marrow.
a, WBCs; b, lymphocytes (n = 14 Jak2VF, n = 13 Jak2VFGsdmd−/− mice); c, monocytes (n = 14 Jak2VF, n = 12 Jak2VFGsdmd−/− mice); d, neutrophils (n = 14 Jak2VF, n = 13 Jak2VFGsdmd−/− mice); e, RBCs (n = 13 mice). f–h, Jak2VF burden in blood lymphocytes (f), neutrophils (g), and monocytes (h; n = 14 Jak2VF, n = 13 Jak2VFGsdmd−/− mice). i, Serum cholesterol (n = 13 mice). j, Representative H&E images of aortic root lesions from Ldlr−/− mice with wild-type (WT) or Gsdmd−/− bone marrow fed a WTD for 12 weeks. Dashed lines, necrotic core; scale bars 200 μm. k, Quantification of lesion area. l, Percentage necrotic core area (n = 12 wild-type, n = 14 Gsdmd−/− mice). Mean ± s.e.m.; two-tailed t-test (a, b, d, e, i, k, l), two-tailed Mann–Whitney test (c, f–h).
Extended Data Fig. 8 ∣
Extended Data Fig. 8 ∣. scRNA-seq reveals increased proliferation and inflammatory macrophages.
a, Heat map of top five differentially expressed genes enriched in each cluster. b, Table showing top ten differentially expressed genes in each cluster with cell annotations (each sample pooled from eight mice). c, Cell cycle classification based on cell cycle gene expression using Seurat analysis; one-tailed X2 test, P = 1.415 × 10⁻¹⁰ indicates G2M cells enriched in Jak2VF lesions. d, UMAP plot of cluster 13 enriched Alox15. Blue indicates relative gene expression. e, Representative immunofluorescence images of aortic root lesions stained for MAC2 (green), ALOX15 (magenta) and DAPI (blue). White dashed lines, plaque; arrows, ALOX15+ cells; scale bars, 50 μm. f, Quantification of ALOX15+ cells per aortic root section (n = 14 Jak2VF, n = 13 Jak2VFGsdmd−/− mice). Mean ± s.e.m.; *P < 0.05 with respect to control genotype, two-tailed Mann–Whitney test (f).
Extended Data Fig. 9 ∣
Extended Data Fig. 9 ∣. Ruxolitinib reduces IL-18 and increases plasma cholesterol in individuals with MPN and mice with JAK2VF mutations.
a, b, Plasma from patients with MPN isolated before and after ruxolitinib (Rux) therapy were analysed for IL-18 (a) and total cholesterol (b; n = 17 patients). c, d, Serum from mice with chimeric 20% Jak2VF bone marrow was analysed for IL-18 (c) and total cholesterol (d; n = 20 Jak2VF, n = 22 Jak2VF + Rux mice). e, Body weight following 12 weeks WTD (n = 19 Jak2VF, n = 20 Jak2VF + Rux mice). f–j, Blood counts of WBCs (f), lymphocytes (g), neutrophils (h), monocytes (i) and RBCs (j; n = 18 Jak2VF, n = 22 Jak2VF + Rux mice). k, l, Jak2VF burden in blood neutrophils (k) and monocytes (l; n = 17 Jak2VF, n = 20 Jak2VF + Rux mice). m, Representative H&E images of aortic root lesions from mice with 20% Jak2VF chimeric bone marrow treated with Rux. Dashed lines, necrotic core; scale bars, 200 μm. n, o, Quantification of lesion area (n; n = 17 Jak2VF, n = 18 Jak2VF + Rux mice) and percentage necrotic core area (o; n = 18 mice). p, Representative picrosirius red-stained lesions (black lines indicate cap thickness). Scale bars, 200 μm. q, Quantification of cap thickness (n = 18 mice). Mean ± s.e.m.; Wilcoxon paired two-tailed test (a), two-tailed Student’s paired t-test (b); two-tailed Mann–Whitney test (c, e–j, n–p), two-tailed t-test (d), two-way ANOVA followed by Tukey’s post hoc test (k, l).
Extended Data Fig. 10 ∣
Extended Data Fig. 10 ∣. Inhibition of IL-1 reduces macrophage proliferation and density in plaques.
a, Terminal serum cholesterol levels in mice on a WTD and treated with anakinra for 7 weeks (n = 9 control, n = 8 control + anakinra, n = 7 Jak2VF, n = 9 Jak2VF + anakinra mice). b, Representative images of aortic roots following 7-week administration of anakinra or vehicle. MAC2 (green), phalloidin (cyan), Ki67 (red), DAPI (blue); arrows, Ki67+ nuclei; scale bars, 50 μm. c–e, Quantification of percentage Ki67+ cells (c), macrophage density (d) and lesion area (e; n = 8 control, n = 8 control + anakinra, n = 6 Jak2VF, n = 9 Jak2VF + anakinra mice). f, Serum cholesterol following 12 weeks WTD, related to late lesions in Fig. 4 (n = 24 Jak2VF, n = 25 Jak2VF + anakinra mice). g, Representative picrosirius red-stained lesions from mice treated with anakinra for 12 weeks. Black lines indicate cap thickness; scale bars, 200 μm. h, Experimental design for Jak2VF clonal haematopoiesis mice using GFP+ cells. i, Terminal serum cholesterol (n = 18 control IgG, n = 19 control IL-1, n = 19 Jak2VF IgG, n = 17 Jak2VF IL-1 mice). j, G2-M phase monocytes from blood identified with propidium iodine staining (n = 18 control IgG, n = 20 control IL-1, n = 18 Jak2VF IgG, n = 17 Jak2VF IL-1 mice). k, Representative picrosirius red-stained aortic root lesions from mice as in j. Black lines indicate cap thickness; scale bars, 200 μm. l, Representative H&E images of aortic roots. Dashed lines, necrotic core; scale bars, 200 μm. m, Overall summary scheme. Mean ± s.e.m.; one-way ANOVA followed by Tukey’s multiple comparison post hoc test (a, c–e), two-tailed t-test (f); Kruskal–Wallis two-tailed test with Dunn’s comparison (i, j).
Fig. 1 ∣
Fig. 1 ∣. Increased atherosclerosis in mice with macrophage Jak2VF expression and Jak2VF clonal haematopoiesis.
a, Immunofluorescence staining of aortic root plaques from mice with Cx3cr1-cre Jak2VF bone marrow. White arrows, Ki67+ nuclei. b–d, Quantification of lesion area (b), percentage of macrophage nuclei that were Ki67+ (c; n = 18 control, n = 21 Jak2VF mice) and necrotic core normalized to lesion area (d; n = 17 control, n = 21 Jak2VF mice). e, Representative haematoxylin and eosin (H&E) images of aortic root lesions from mice with Jak2VF clonal haematopoiesis. Scale bar, 200 μm. f, Lesion area for mice in e (n = 19 mice). g, Immunofluorescence staining of aortic roots. Arrows, Ki67+ nuclei; yellow dashed lines, lesions. Scale bar, 50 μm. h, Increased CD45.2 cells in Jak2VF lesions relative to blood monocytes (n = 18 control, n = 15 Jak2VF mice). i, Percentage Ki67+ CD45.1 or CD45.2 cells in lesions (n = 18 control, n = 14 Jak2VF mice). Mean ± s.e.m.; two-tailed t-test (b–d, f), two-way ANOVA with Bonferroni multiple comparison (h, i).
Fig. 2 ∣
Fig. 2 ∣. Inflammasome activation promotes macrophage proliferation and features of plaque instability in mice with Jak2VF bone marrow.
a, Immunofluorescence images of aortic root plaques. Arrows, Ki67+ nuclei. Scale bar, 50 μm. b, Percentage Ki67+ cells in lesions. c, Macrophage number normalized to total cells in lesions (n = 8 mice (b, c)). d, Necrotic core area (n = 9 control, n = 8 Casp1/11−/−Jak2VF and Jak2VFCasp1/11−/− mice). e, Cap thickness (n = 8 mice). f, Lesion area (n = 9 control, n = 8 Casp1/11−/−Jak2VF and Jak2VFCasp1/11−/− mice). g, Immunofluorescence staining of aortic root lesions from mice with Jak2VF clonal haematopoiesis. Arrows, pγH2AX+ nuclei. Scale bars, 100 μm. h, pγH2AX+MAC2+ cells normalized to lesion area (n = 19 control, n = 20 Jak2VF mice). i, Representative immunofluorescence staining of aortic roots. Yellow dashed lines, lesion. j, 8-oxo-deoxyguanosine (8-OHdG) fluorescence intensity normalized to lesion area (n = 17 mice). k, Representative H&E images of aortic root lesions from mice with Jak2VF or Jak2VFNlrp3−/− bone marrow. Yellow dashed lines, necrotic cores. l, m, Quantification of lesion area (l; n = 15 mice) and percentage necrotic core area (m; n = 19 mice). n, Representative H&E images of aortic root lesions from mice with Jak2VF (n = 24) or Jak2VFAim2−/− (n = 25) bone marrow. Yellow dashed lines, necrotic core. o, p, Lesion area (o) and percentage necrotic core area (p). Mean ± s.e.m.; two-tailed t-test (l, m, o, p); Kruskal–Wallis two-tailed test with Dunn’s comparison (b, c, e); one-way ANOVA with Tukey’s post hoc analysis (d, f); two-way ANOVA (e); two-tailed Mann–Whitney test (h, j).
Fig. 3 ∣
Fig. 3 ∣. Jak2VF promotes pyroptosis and inflammation in lesions.
a, Representative H&E images of aortic root lesions from mice with Jak2VF or Jak2VFGsdmd−/− bone marrow. Dashed lines, necrotic core. Scale bars, 200 μm. b–d, Lesion area (b), percentage necrotic core area (c), and cap thickness (d; n = 14 Jak2VF, n = 13 Jak2VFGsdmd−/− mice). e, Aortic root lesions were stained for pγH2AX (white arrows). Scale bars, 100 μm. f, Quantification of pγH2AX+MAC2+ cells (n = 14 Jak2VF, n = 13 Jak2VFGsdmd−/− mice). g, Single-cell RNA-seq of plaque cells. UMAP plot of CD45+ cells from aortas of Ldlr−/− mice with 100% bone marrow of indicated genotypes (control 8 mice pooled; Jak2VF 16 mice pooled; Jak2VFGsdmd−/− 8 mice pooled). h, Percentage cell populations within clusters. Mean ± s.e.m.; two-tailed t-test (b–d, f).
Fig. 4 ∣
Fig. 4 ∣. Effects of anakinra or IL-1β antibodies on atherosclerotic plaque development.
a, Representative H&E images of aortic root lesions from mice with 100% Jak2VF bone marrow treated with anakinra. Dashed lines, necrotic core. Scale bar, 200 μm. b–d, Lesion area (b), percentage necrotic core area (c; n = 24 Jak2VF, n = 25 Jak2VF + anakinra mice), and cap thickness (d; n = 23 Jak2VF, n = 25 Jak2VF + anakinra mice). e, Representative immunofluorescence image of aortic roots stained for GFP (Jak2VF-negative cells), MAC2, Ki67 and DAPI. Arrows, Ki67+ nuclei. Scale bars, 25 μm. f, Percentage Ki67+ macrophages (n = 16 control, n = 18 Jak2VF mice). g, Fraction of macrophages in aortic roots normalized to fraction in blood monocytes (n = 16 control, n = 19 Jak2VF mice). h–j, Quantification of aortic root lesion macrophage density (h), cap thickness (i), and necrotic core area (j) (n = 16 control, n = 20 Jak2VF mice). Mean ± s.e.m.; two-tailed t-test (b–d); one-way ANOVA with Tukey’s post hoc analysis (h); two-way ANOVA with Tukey’s post hoc analysis (f); Kruskal–Wallis two-tailed test with Dunn’s comparison (g, i, j).

Comment in

References

    1. Jaiswal S et al. Clonal hematopoiesis and risk of atherosclerotic cardiovascular disease. N. Engl. J. Med 377, 111–121 (2017). - PMC - PubMed
    1. Bick AG et al. Inherited causes of clonal haematopoiesis in 97,691 whole genomes. Nature 586, 763–768 (2020). - PMC - PubMed
    1. Benjamin EJ et al. Heart disease and stroke statistics—2019 update: a report from the American Heart Association. Circulation 139, e56–e528 (2019). - PubMed
    1. Ridker PM et al. Antiinflammatory therapy with Canakinumab for atherosclerotic disease. N. Engl. J. Med 377, 1119–1131 (2017). - PubMed
    1. José J et al. Clonal hematopoiesis associated with TET2 deficiency accelerates atherosclerosis development in mice. Science 355, 842–847 (2017). - PMC - PubMed

Publication types

MeSH terms