. 2021 Apr;53(4):467-476.
doi: 10.1038/s41588-021-00804-3. Epub 2021 Mar 17.

Human-chimpanzee fused cells reveal cis-regulatory divergence underlying skeletal evolution

Affiliations

Human-chimpanzee fused cells reveal cis-regulatory divergence underlying skeletal evolution

David Gokhman et al. Nat Genet. 2021 Apr.

Erratum in

Abstract

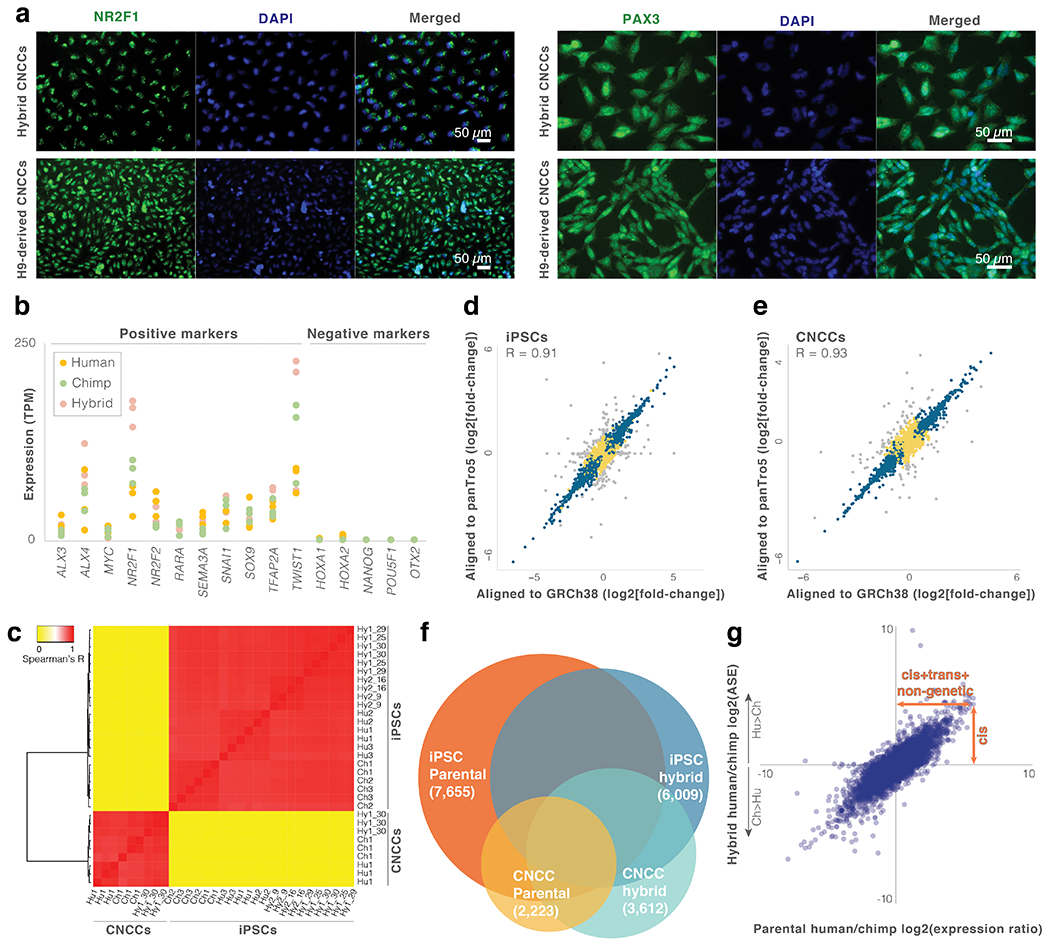
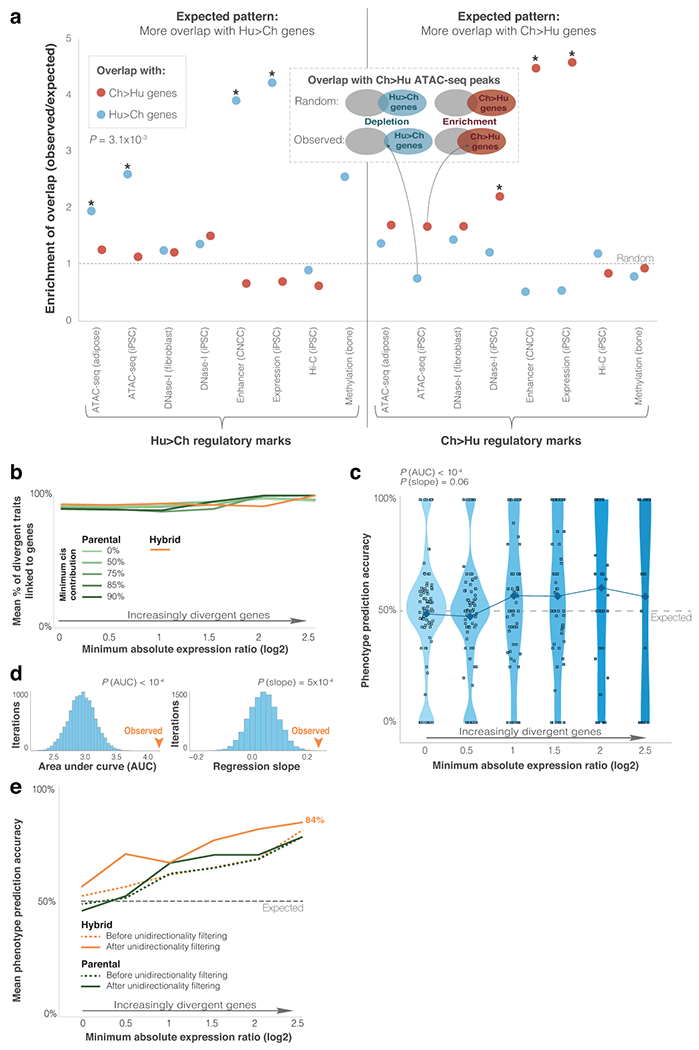
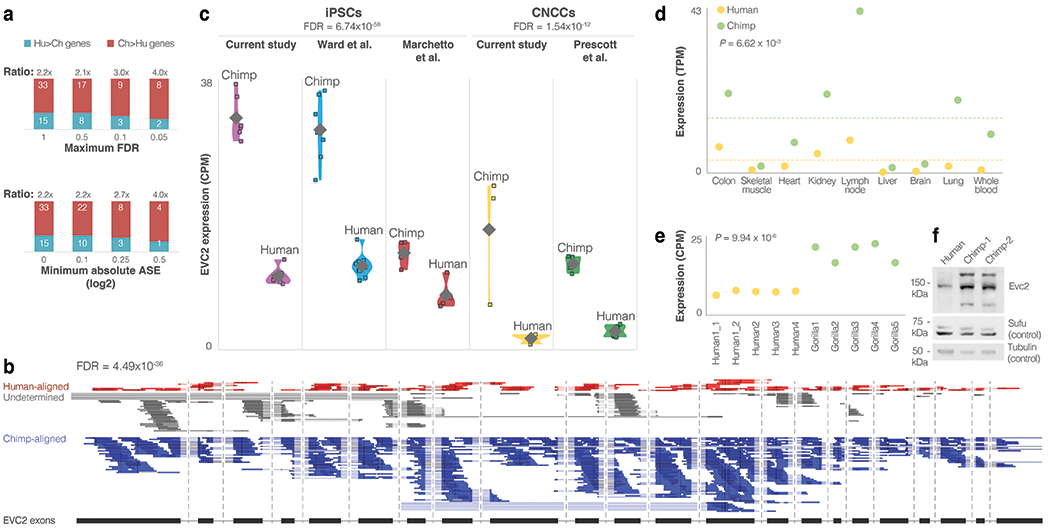
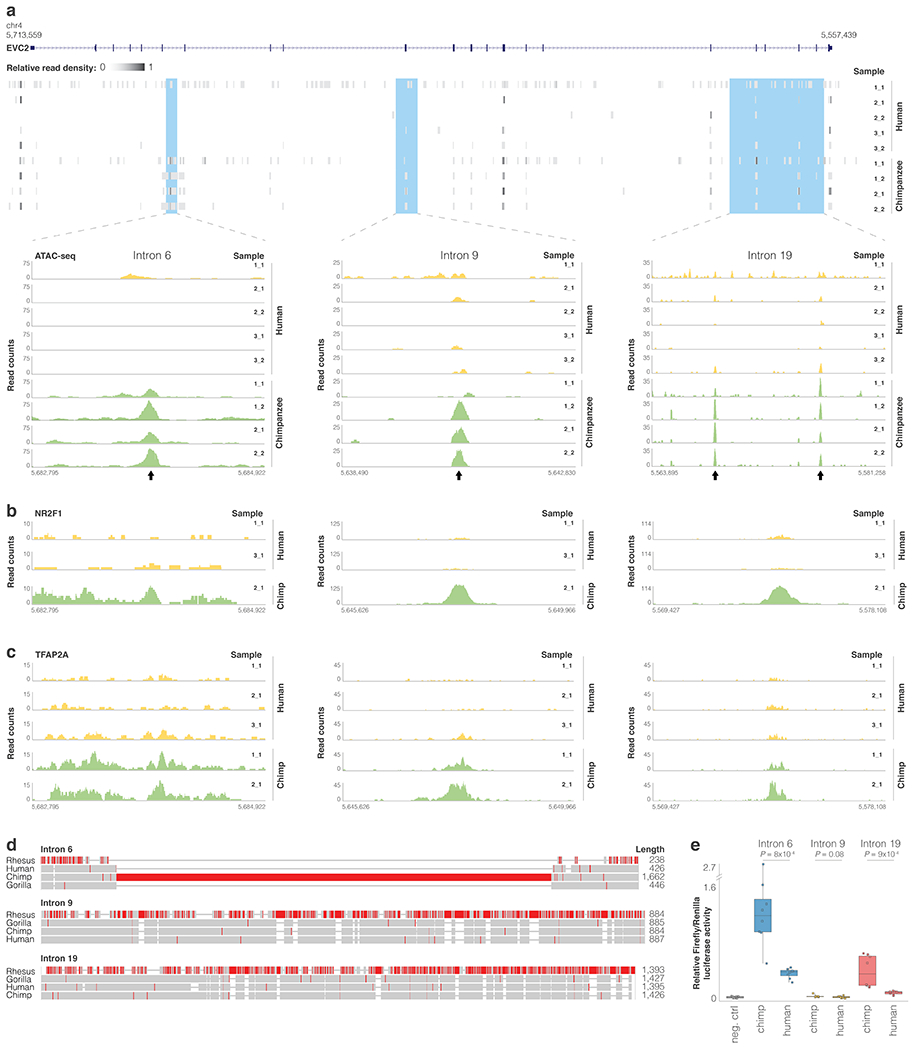
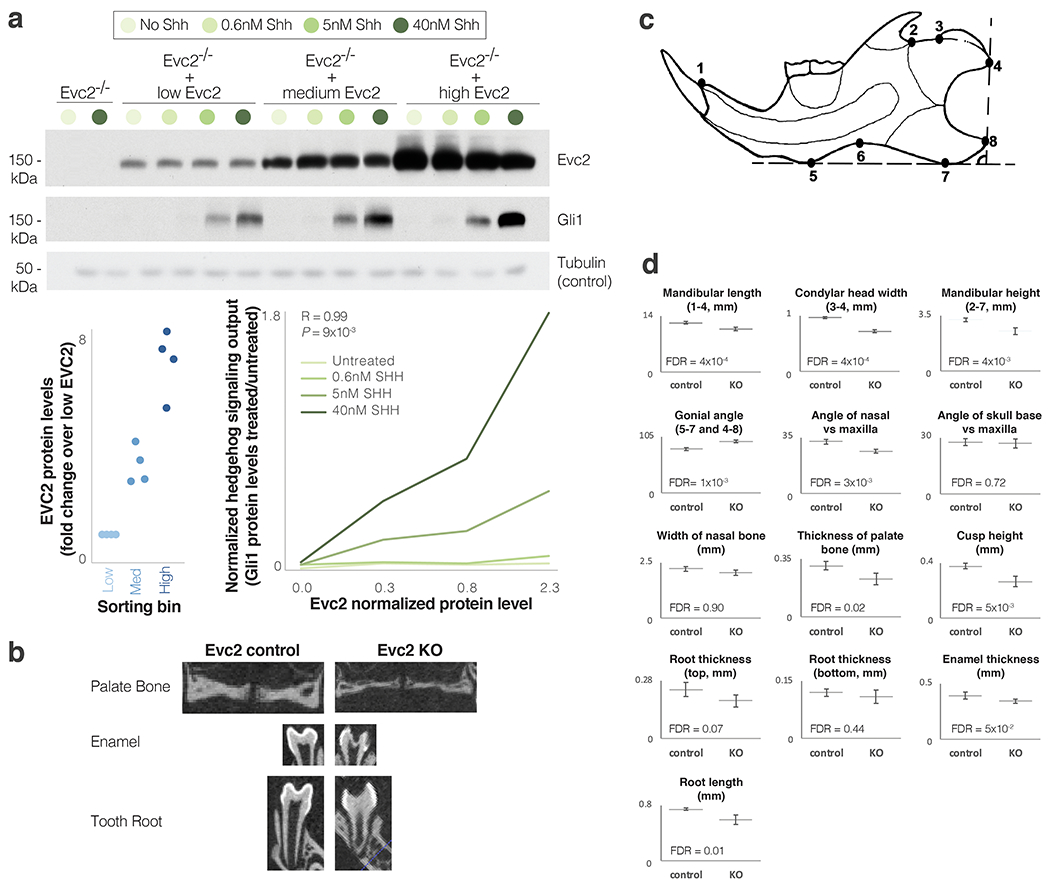
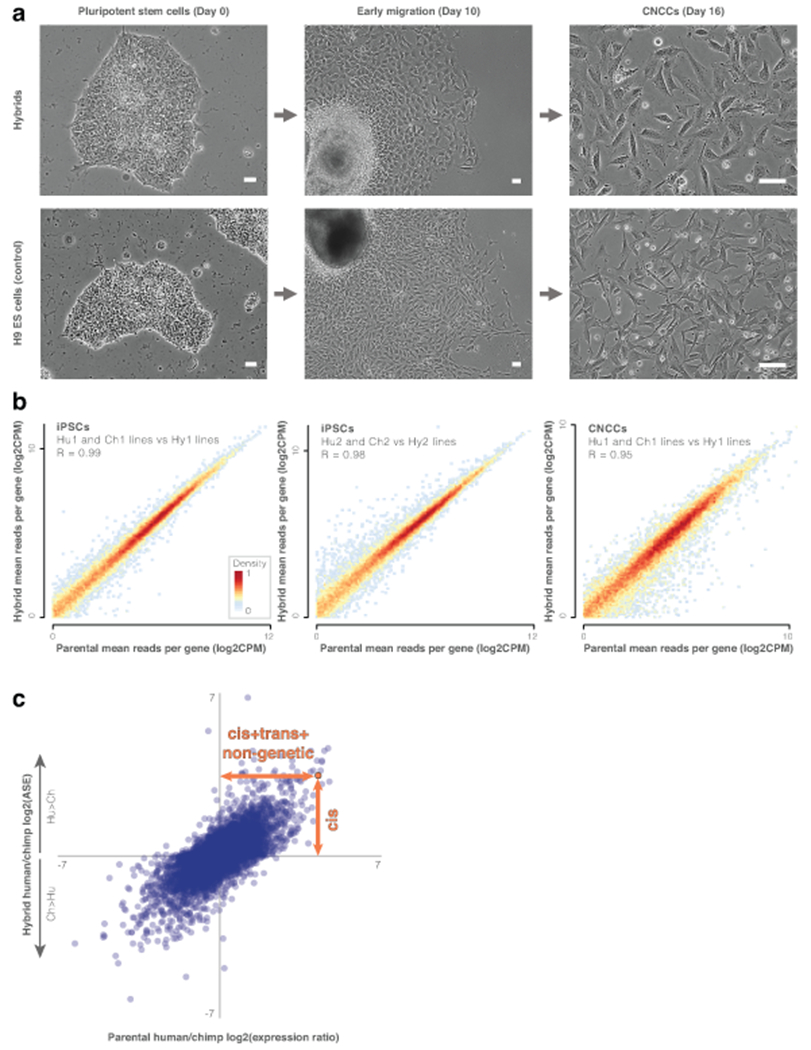
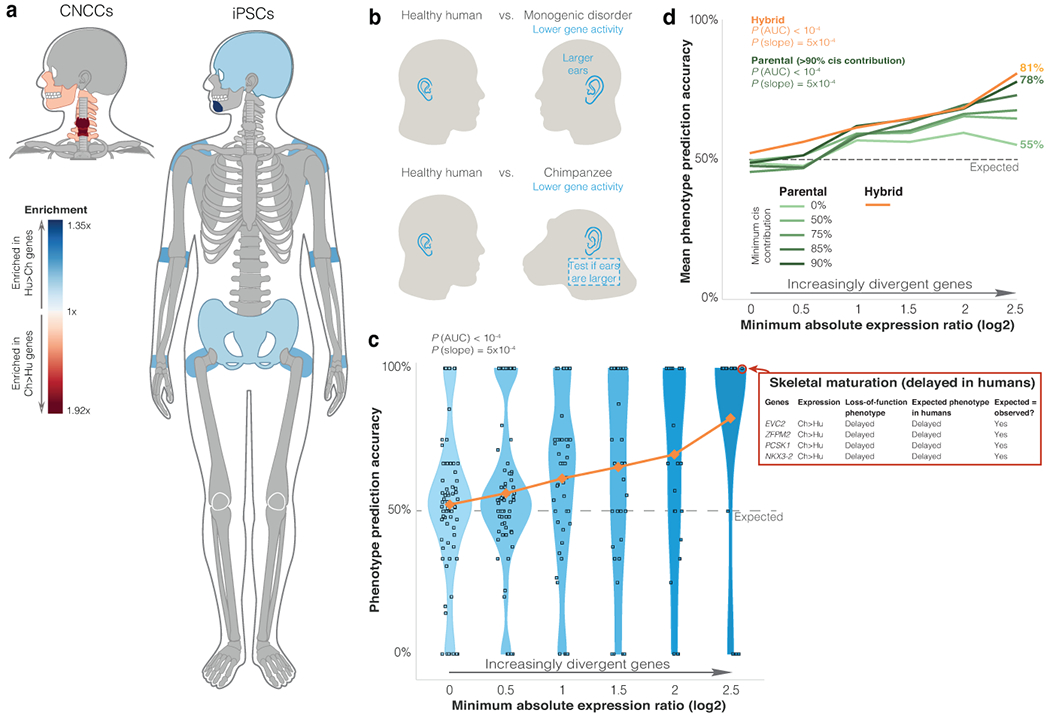
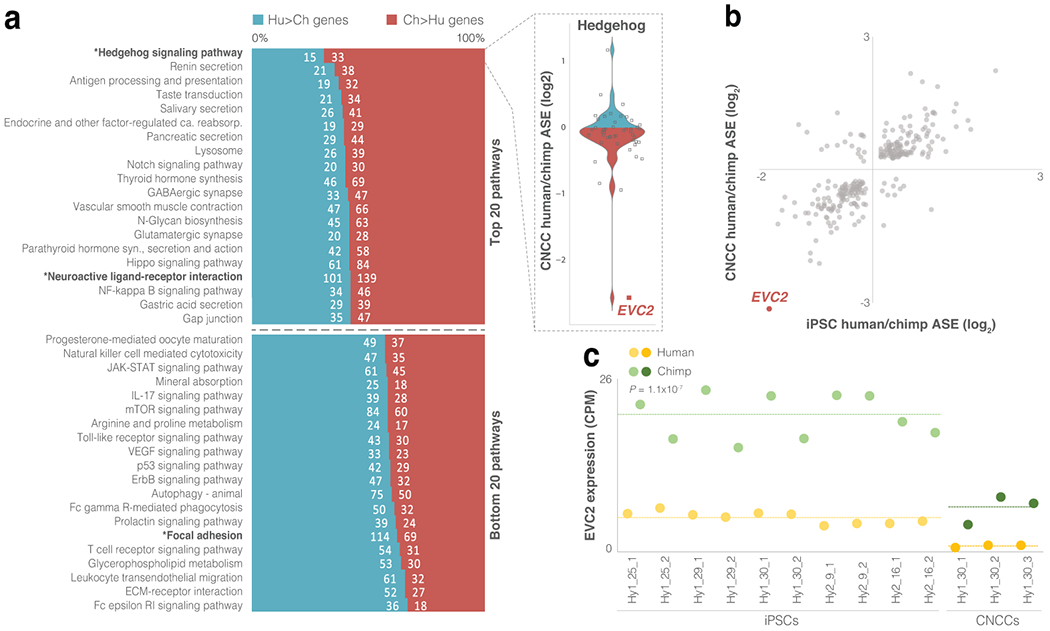
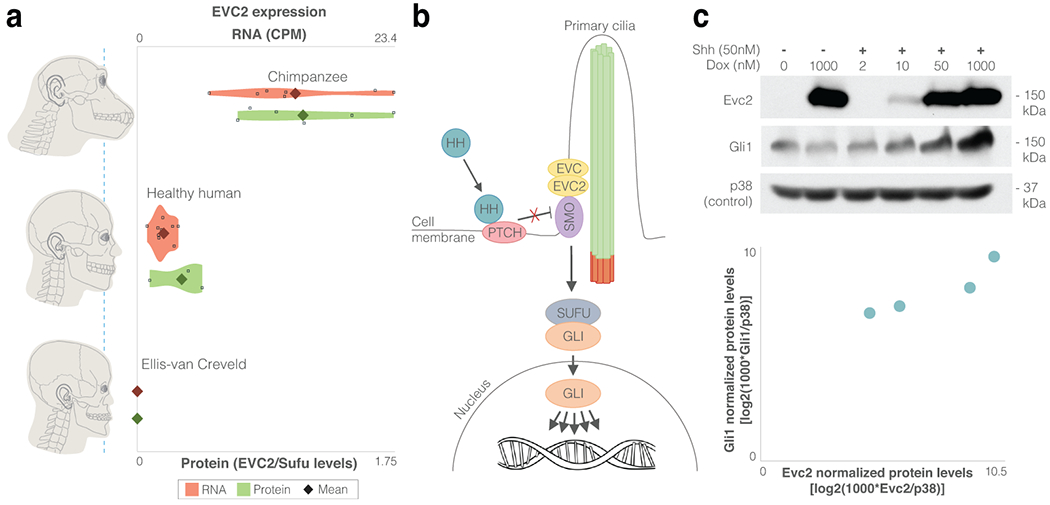
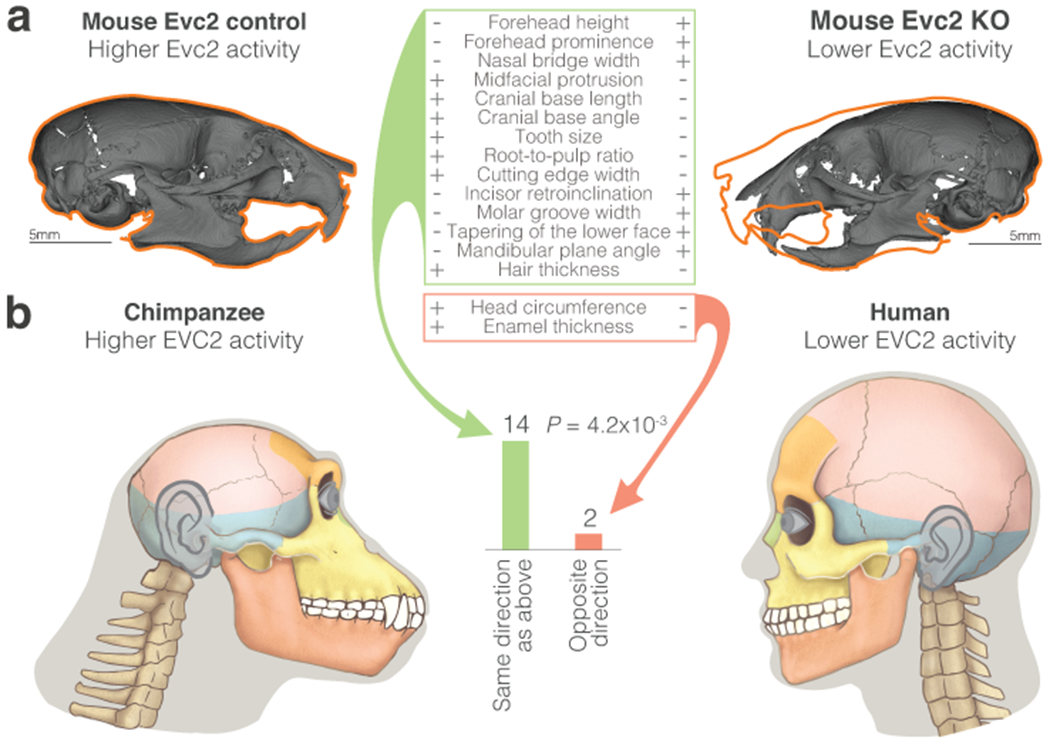
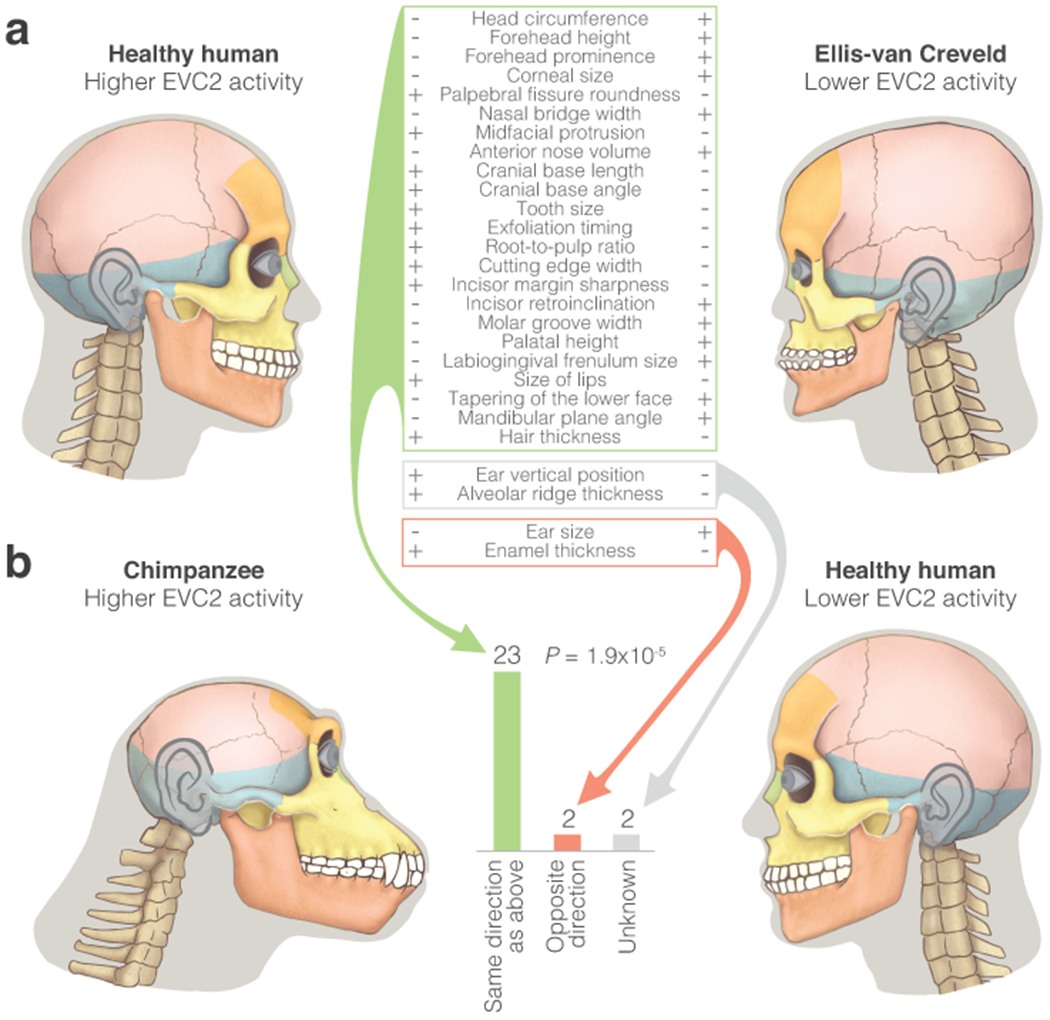
Gene regulatory divergence is thought to play a central role in determining human-specific traits. However, our ability to link divergent regulation to divergent phenotypes is limited. Here, we utilized human-chimpanzee hybrid induced pluripotent stem cells to study gene expression separating these species. The tetraploid hybrid cells allowed us to separate cis- from trans-regulatory effects, and to control for nongenetic confounding factors. We differentiated these cells into cranial neural crest cells, the primary cell type giving rise to the face. We discovered evidence of lineage-specific selection on the hedgehog signaling pathway, including a human-specific sixfold down-regulation of EVC2 (LIMBIN), a key hedgehog gene. Inducing a similar down-regulation of EVC2 substantially reduced hedgehog signaling output. Mice and humans lacking functional EVC2 show striking phenotypic parallels to human-chimpanzee craniofacial differences, suggesting that the regulatory divergence of hedgehog signaling may have contributed to the unique craniofacial morphology of humans.


Conflict of interest statement

Competing Interests Statement

The authors declare no competing interests.

Figures

Extended Data Fig. 1
Extended Data Fig. 1. Identifying human-chimpanzee expression changes using hybrid cells
a. Immunostaining for CNCC markers NR2F1 and PAX3 was performed to confirm CNCC differentiation. b. Expression levels of positive and negative markers in the parental and hybrid CNCCs. c. Heatmap and dendrogram of total gene expression across iPSC and CNCC samples. d,e. Fold-change per gene for hybrid iPSCs and hybrid CNCCs when aligned to the human (GRCh38) vs chimpanzee (panTro5) genomes. Grey points are genes where the absolute difference in log2(fold-change) when aligned to the human vs. chimpanzee genome is greater than 1 (i.e., genes with potential alignment bias that were excluded from the analysis). Genes with no observable alignment bias are marked with blue (significant ASE: q-value < 0.05) or yellow (non-significant ASE). f. Venn diagram of genes with significant human-chimpanzee expression changes in parental and hybrid samples. g. Parental vs hybrid iPSC expression changes. See Fig. 1d legend.
Extended Data Fig. 2
Extended Data Fig. 2. Differentially expressed genes are associated with divergent chromatin and phenotypes
a. Overlap of ASE genes in CNCCs with loci showing divergent regulatory marks. Each of the datasets was examined twice: (1) against Ch>Hu genes (red), and (2) against Hu>Ch genes (blue). In 14 out of 16 datasets, expression differences reflect regulatory differences, i.e., Hu>Ch regulatory marks show more overlap with Hu>Ch genes than with Ch>Hu genes, and vice versa. P-value shows one-tailed paired t-test for overall overlap (see Methods). Asterisks mark significant randomization test overlap (FDR < 0.05). See Supplementary Table 8. b. Mean fraction of divergent phenotypes for groups of genes with increasingly higher fold-change thresholds. c. Violin plots showing phenotype assignment accuracy in groups of genes with increasingly more divergent differential expression in parental cells. Randomization test P-values are shown for overall accuracy compared to random (PAUC), and accuracy increase compared to random (Pslope), as shown in d. See Fig. 2c legend. d. Randomization output for the phenotype assignment pipeline. Genes associated with each phenotype were randomly assigned a direction of expression change, while keeping their absolute fold-change. Randomization test P-values are shown for overall accuracy compared to random (PAUC), and accuracy increase compared to random (Pslope). e. Phenotype assignment accuracy before and after applying unidirectionality filtering, for ASE and parental differential expression with cis-contribution ≥ 90%. See Fig. 2d legend. In the unidirectionality filter, only phenotypes where all genes point in the same phenotypic direction (i.e., complete agreement) are analyzed.
Extended Data Fig. 3
Extended Data Fig. 3. EVC2 down-regulation in humans
a. The down:up ratio of Hh signaling genes across increasingly more stringent FDR and fold-change thresholds. b. Differential expression along all of the exons of EVC2 in a CNCC hybrid (Hy1_30_rep1), showing that the majority of reads come from the chimpanzee alleles. Introns are not shown to scale. c. Violin plots of EVC2 expression across iPSC and CNCC non-hybrid samples from various sources, showing consistent EVC2 down-regulation in humans compared to chimpanzees. Diamonds show mean expression levels. DESeq2 FDR-adjusted P-values are presented for cell type. The observation that the human-chimpanzee ratios are similar to the ones observed within the hybrid cells suggests that the majority of differential expression is driven by cis changes. d. EVC2 expression across nine additional tissues for which both human and chimpanzee data are available, showing that EVC2 down-regulation is not restricted to iPSCs and CNCCs. Dashed line shows mean expression. One-sided t-test P-values are shown. e. Gorilla vs human EVC2 expression. One-sided t-test P-values are shown. f. Western blot of EVC2 protein levels in human and chimpanzee DPSCs. The samples derive from the same experiment and blots were processed in parallel. For gel source data, see Source Data.
Extended Data Fig. 4
Extended Data Fig. 4. Differentially regulated regions in EVC2
ATAC-seq read pileup along EVC2 and for the three loci showing species-biased peaks within EVC2. Arrows mark peaks. b,c. NR2F1 and TFAP2A ChIP-seq read pileup for loci <10 kb away from the ATAC-seq peaks. d. MUSCLE103 sequence alignment of rhesus, gorilla, chimp and human sequences. Regions with a high proportion of mismatches are colored in red. e. Reporter assay comparing relative firefly/Renilla luciferase activity for chimpanzee and human EVC2 sequences following transient transfection in human DPSCs. Empty vector (pGL4.11b) was used as negative control. Box plots show mean (center), 2nd and 3rd quartiles (box boundaries), and minima and maxima (whiskers). One-tailed t-test P-values in two independent experiments of quadruplet measurements (n = 8) are shown.
Extended Data Fig. 5
Extended Data Fig. 5. Reduced levels of EVC2 result in reduced Hedgehog signaling output and affect craniofacial phenotypes
a. Western blot of Gli1 protein levels (a measure of Hh signaling output induced by Shh) at different Evc2 and Hh signaling input levels. EvcC2 was introduced at various levels into Evc2−/− mouse NIH/3T3 fibroblasts through retroviral infection. Cells with higher levels of Evc2 show higher Hh signaling output. p38 served as positive control. Pearson’s R and P-value are shown for 40nM SHH. The samples derive from the same experiment and blots were processed in parallel. For gel source data, see Source Data. b. Micro-CT radiographic images of the palate bone, enamel (extra bright) and roots of the first mandibular molar in Evc2 control and Evc2 KO mice at P28. c. Diagram of the mandible indicating the landmarks for the parameters measured. d. Mean skull and mandible measurements from Evc2 control and Evc2 KO mice at P28. (n = 5 for each group, FDR-adjusted two-tailed t-test P-values are shown). Whiskers show one standard deviation in each direction. Landmarks used are shown in the titles.
Extended Data Fig. 6
Extended Data Fig. 6. No aneuploidies observed in CNCC hybrid samples
Figure shows ASE (top), sliding window ASE median over 20 genes (middle), and Wilcoxon rank sum test P-values for each sliding window against the entire genome (bottom). Dashed line shows mean for ASE and sliding window ASE, and shows Bonferroni P-value cutoff for the Wilcoxon rank sum test. An example of data is presented for autosomal chromosomes 1 and 20, and for chromosome X from the CNCC Hy1_30_rep1 sample. No significant deviations were detected in any of the CNCC hybrid samples. See Agoglia et al. for iPSC aneuploidy analyses.
Extended Data Fig. 7
Extended Data Fig. 7. No chromosomal duplications or losses observed in the CNCC hybrid samples
Density plots of percentage of human-aligned reads per gene per chromosome for each of the CNCC hybrid samples. Vertical dashed lines show mean per sample.
Figure 1.
Figure 1.. Human-chimpanzee hybrid cells capture inter-specific cis-expression changes.
a. Phase contrast images of cranial neural crest cell (CNCC) derivation from human-chimpanzee hybrid iPSCs and positive control H9 human embryonic stem cells. Scale bars show 50μm. Three independent differentiations were conducted for each cell line. b. Heatmap of hybrid vs parental gene expression (e.g., mean expression of the three CNCC Hy1 samples vs the six CNCC Hu1 and Ch1 parental samples). Heatmaps show genes that are expressed in both (mean counts per million (CPM) > 1). The effect of tetraploidy on gene expression is likely minimal. c. Parental vs hybrid CNCC expression changes. Expression changes within the hybrid cells are driven by cis-regulatory changes (vertical orange arrow), while expression changes between the parental samples are driven by cis- and trans-regulatory changes and their combinatorial interaction, as well as by non-genetic factors, such as cell composition, environmental effects (e.g. response to cell culture), and batch effects (horizontal orange arrow). See Extended Data Fig. 1g for iPSCs. ASE, allele-specific expression.
Figure 2.
Figure 2.. More divergent expression is more tightly associated with divergent traits.
a. Gene ORGANizer output of significantly enriched body parts (FDR < 0.05, one-sided hypergeometric test) within ASE genes in the hybrid cells. b. Workflow of linking expression changes to potential phenotypic effects. We used phenotypes in monogenic disorders as indicators of expected phenotypic direction when relevant genes are down-regulated. Then, we predicted this direction for the lineage with lower expression. Finally, we tested whether predicted phenotypes match known human-chimpanzee phenotypic differences. c. Phenotype prediction accuracy among genes with increasingly divergent ASE. Correct predictions are cases where the phenotype assigned to a gene based on its ASE matches the known phenotype between humans and chimpanzees (see skeletal maturation example). If a gene is not related to phenotypic divergence, there is a 50% likelihood that the phenotype assigned to the gene based on its ASE would match the human-chimpanzee phenotypic difference. Each phenotype is represented as a square. Y-axis shows for each phenotype the fraction of genes whose prediction was correct. Horizontal distribution of squares within each bin is for display purposes only. Orange shows mean accuracy. Randomization test P-values are shown for overall accuracy compared to random (PAUC), and accuracy increase compared to random (Pslope). d. Mean phenotype prediction accuracy in groups of genes with increasingly more divergent expression. Orange shows mean accuracy in hybrid cells (from panel c). Green shows mean accuracy for differentially expressed genes with various cis-contribution thresholds in the parental samples. P-values were computed as in panel c.
Figure 3.
Figure 3.. EVC2 down-regulation is likely to have reduced Hh signaling output in humans.
a. For each KEGG pathway, the ratio of Hu>Ch to Ch>Hu genes was tested. Asterisks mark pathways with FDR < 0.05 (binomial test). b. Chimpanzee to human expression ratio in hybrid iPSCs and CNCCs for skeleton-related genes that are differentially expressed in both cell types. EVC2 is the most down-regulated gene in humans compared to chimpanzees. c. EVC2 expression across all hybrid cell samples showing a ~4-fold mean decrease in human compared to chimpanzee in iPSCs and a ~6-fold mean decrease in CNCCs. Dashed line shows mean expression. Paired t-test P-values are shown.
Figure 4.
Figure 4.. EVC2 down-regulation in humans is likely to have reduced Hh signaling output.
a. EVC2 RNA expression levels (parental CNCCs from the current study and from Prescott et al.) and protein expression levels (DPSCs from the current study). For EVC2 loss-of-function (Ellis-van Creveld patients), functional RNA and protein levels are presented. b. HH ligands bind and inhibit their receptor (PTCH), thereby allowing SMO to accumulate in primary cilia and engage the EVC-EVC2 complex at the cilia base. The EVC-EVC2 complex acts as a scaffold to facilitate SMO signaling to the GLI family of transcription factors. c. GLI1, the product of a direct Hh target gene, was measured across four induction levels by immunoblotting as a metric of signaling strength induced by the ligand Sonic Hedgehog (Shh) in cells expressing different levels of EVC2 protein. The samples derive from the same experiment and blots were processed in parallel.
Figure 5.
Figure 5.. Phenotypes driven by EVC2 KO are observed between humans and chimpanzees.
a. Micro-CT models of the control and Evc2 KO mice at day P28. Orange outline shows Evc2 control silhouette. Table shows the directional craniofacial phenotypes that differ between Evc2 KO and control mice, and their respective state in control and KO mice. +/− represent increased/decreased phenotype, respectively. b. The number of phenotypes that show the same directionality between Evc2 KO and control mice as they do between humans and chimpanzees. Two-sided binomial test P-values are shown. Phenotypic differences in Evc2 control vs KO mice resemble phenotypic differences in chimpanzee vs human.
Figure 6.
Figure 6.. Phenotypes driven by reduced levels of functional EVC2 are observed between humans and chimpanzees.
a. Directional craniofacial phenotypes in EVC2 loss-of-function, and their respective state in the syndrome and in healthy individuals. b. The number of phenotypes that show the same directionality between healthy and Ellis-van Creveld syndrome individuals as they do between humans and chimpanzees. Phenotypic differences between healthy and Ellis-van Creveld syndrome individuals resemble phenotypic differences between chimpanzees and humans. Two-sided binomial test P-values are shown. See Supplementary Table 22 for non-craniofacial phenotypes.

Comment in

References

References for main text

    1. Aiello L & Dean C An Introduction to Human Evolutionary Anatomy. (Elsevier, 2002).
    1. King MC & Wilson AC Evolution at two levels in humans and chimpanzees. Science 188, 107–116 (1975). - PubMed
    1. Enard D, Messer PW & Petrov DA Genome-wide signals of positive selection in human evolution. Genome Res. (2014). doi: 10.1101/gr.164822.113 - DOI - PMC - PubMed
    1. Fraser HB Gene expression drives local adaptation in humans. Genome Res. 23, 1089–1096 (2013). - PMC - PubMed
    1. Wittkopp PJ & Kalay G Cis-regulatory elements: Molecular mechanisms and evolutionary processes underlying divergence. Nature Reviews Genetics (2012). doi: 10.1038/nrg3095 - DOI - PubMed

Methods-only References

    1. Romero IG et al. A panel of induced pluripotent stem cells from chimpanzees: A resource for comparative functional genomics. Elife (2015). doi: 10.7554/eLife.07103.001 - DOI - PMC - PubMed
    1. Rada-Iglesias A et al. Epigenomic annotation of enhancers predicts transcriptional regulators of human neural crest. Cell Stem Cell (2012). doi: 10.1016/j.stem.2012.07.006 - DOI - PMC - PubMed
    1. Bajpai VK et al. Reprogramming Postnatal Human Epidermal Keratinocytes Toward Functional Neural Crest Fates. Stem Cells (2017). doi: 10.1002/stem.2583 - DOI - PMC - PubMed
    1. Ward MC et al. Silencing of transposable elements may not be a major driver of regulatory evolution in primate iPSCs. Elife (2018). doi: 10.7554/eLife.33084 - DOI - PMC - PubMed
    1. Marchetto MCN et al. Differential L1 regulation in pluripotent stem cells of humans and apes. Nature (2013). doi: 10.1038/nature12686 - DOI - PMC - PubMed

Publication types

MeSH terms

Substances