

Prospective Analysis Utilizing Intraoperative Neuromonitoring for the Evaluation of Inter-Burst Frequencies
- PMID: 33732016
- PMCID: PMC7959207
- DOI: 10.2147/JPR.S298797
Prospective Analysis Utilizing Intraoperative Neuromonitoring for the Evaluation of Inter-Burst Frequencies
Abstract
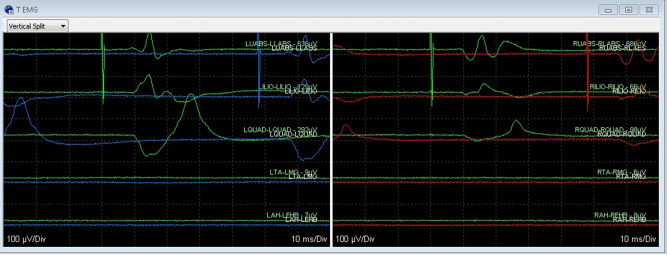
Background: Intraoperative neuromonitoring (IONM) for spinal cord stimulation (SCS) uses electromyography (EMG) responses to determine myotomal coverage as a marker for dermatomal coverage.
Objective: These responses can be utilized to evaluate the effects of stimulation platforms on the nervous system.
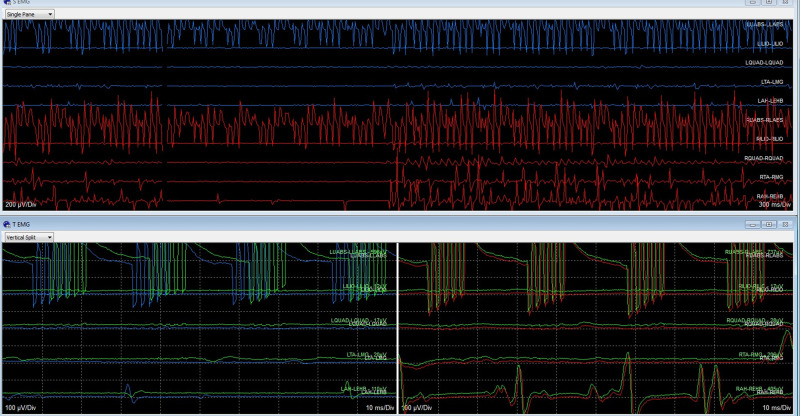
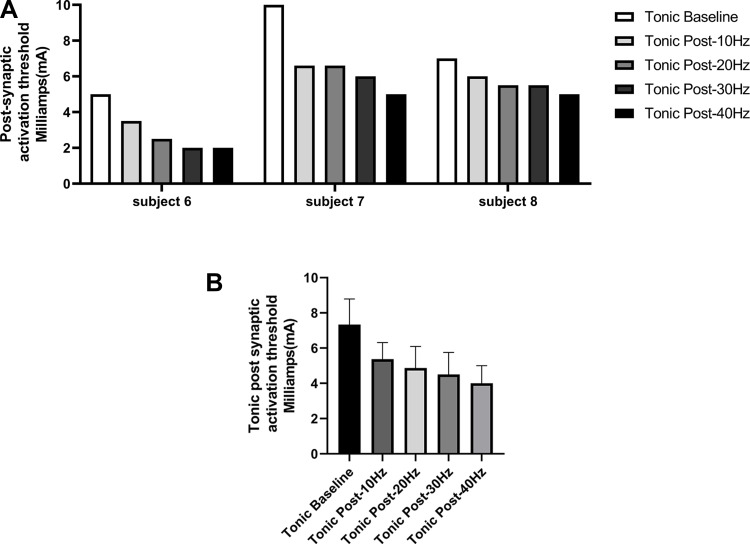
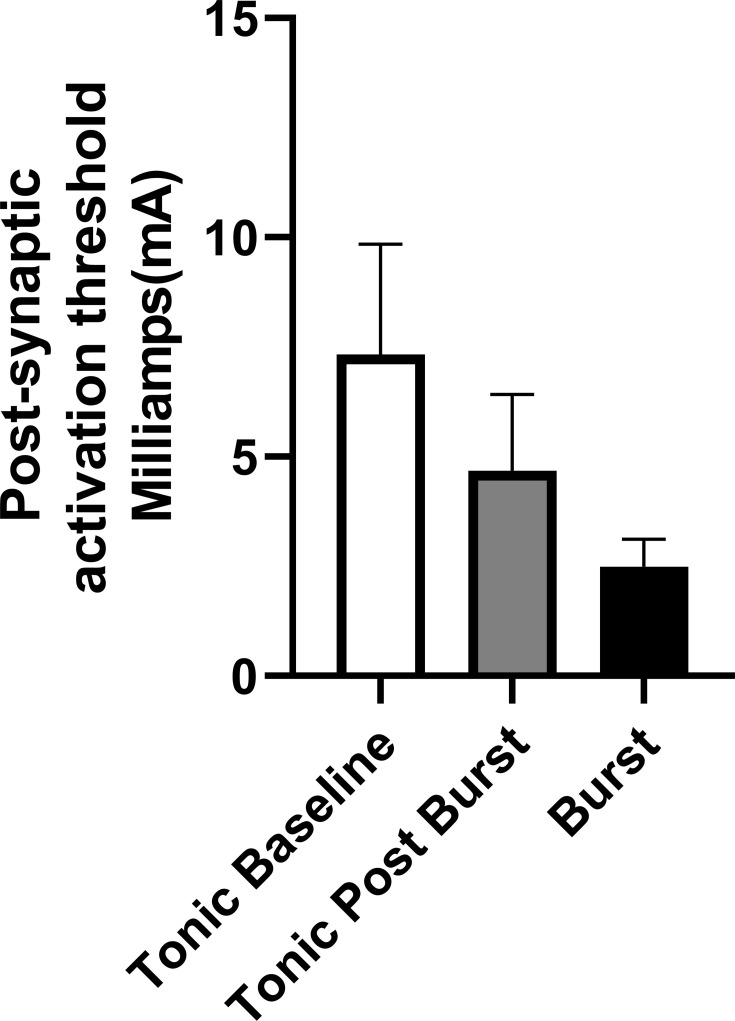
Methods: Eight patients were tested at inter-burst frequencies of 10 Hz, 20 Hz, 30 Hz, and 40 Hz using DeRidder Burst stimulation to determine the amplitude of onset of post-synaptic signal generation. Three patients had additional data recording amplitude of onset of tonic stimulation prior to and post DeRidder Burst stimulation at each inter-burst frequency. This represented post-synaptic excitability.
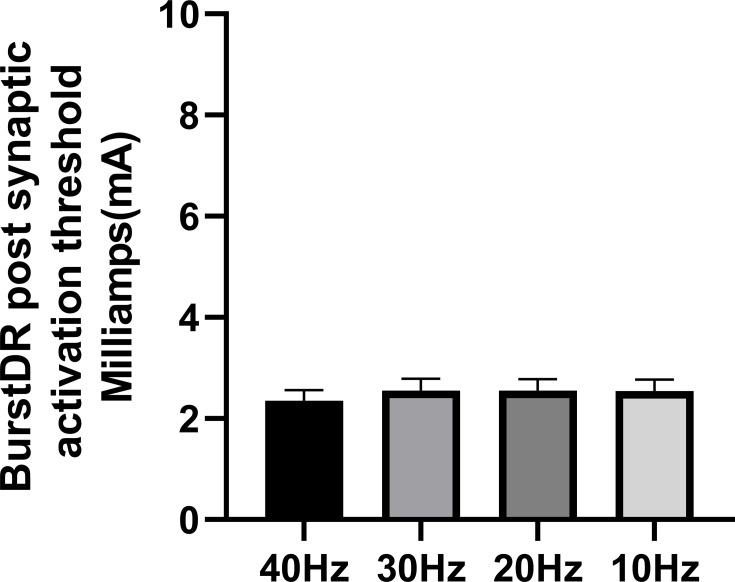
Results: In all patients, the DeRidder Burst waveform generated EMG responses under all inter-burst frequencies including temporal summation, deeper fiber recruitment, and compounded action potentials. There was a non-significant decrease of 7.6-7.8% in amplitudes to generate response under 40 Hz, compared to the other frequencies. However, there was a 73.1% reduction in energy requirements at 10 Hz. The enhanced post-synaptic excitability effect was demonstrated at all frequencies.
Conclusion: DeRidder Burst has similar effects of temporal summation, deeper fiber recruitment, and compounded action potentials under IONM at 40 Hz, 30 Hz, 20 Hz, and 10 Hz. In addition, the hyperexcitability phenomenon was also observed regardless of the frequency. This demonstrates that postsynaptic responses captured via IONM may be a sensitive biomarker to SCS mechanism of action. In addition, lower inter-burst frequencies may have a similar clinical effect on pain relief thus reducing power consumption even further than current dosing paradigms.
Keywords: Burst; DeRidder Burst; EMG; SCS; SSEPS; electromyogram; somatosensory evoked potentials; spinal cord stimulation.
© 2021 Falowski and Benison.
Conflict of interest statement
Steven Falowski consults for Abbott, Medtronic, Boston Scientific, Vertoss and Saluda. Research is performed with Abbott, Medtronic, Biotronik, Saluda, and Vertiflex. Equity positions held in Saluda, CornerLoc, SPR Therapeutics, Thermaquil, Stimgenics, SpineThera, Neural Integrative Solutions, and AGR. Alex Benison is an employee of Abbott. The authors report no other conflicts of interest in this work.
Figures
Similar articles
-
Prospective Six-Month Analysis of Multiarea Burst Spinal Cord Stimulation: Correlating Intraoperative Neuromonitoring With Postoperative Programming and Clinical Outcomes.Neuromodulation. 2024 Jul;27(5):899-907. doi: 10.1016/j.neurom.2024.02.003. Epub 2024 Mar 22. Neuromodulation. 2024. PMID: 38520459
-
Regional Coverage Differences With Single- and Multi-Area Burst Spinal Cord Stimulation for Treatment of Chronic Pain.Neuromodulation. 2023 Oct;26(7):1471-1477. doi: 10.1016/j.neurom.2023.01.015. Epub 2023 Mar 3. Neuromodulation. 2023. PMID: 36870935
-
An Observational Case Series of Spinal Cord Stimulation Waveforms Visualized on Intraoperative Neuromonitoring.Neuromodulation. 2019 Feb;22(2):219-228. doi: 10.1111/ner.12781. Epub 2018 Apr 29. Neuromodulation. 2019. PMID: 29707900
-
Spinal Cord Stimulation: Neuromodulation for Intraoperative Neuromonitoring Personnel.Neurodiagn J. 2025 May 13:1-23. doi: 10.1080/21646821.2025.2490307. Online ahead of print. Neurodiagn J. 2025. PMID: 40359312 Review.
-
Evaluation of Abbott's BurstDR stimulation device for the treatment of chronic pain.Expert Rev Med Devices. 2017 Jun;14(6):417-422. doi: 10.1080/17434440.2017.1330147. Expert Rev Med Devices. 2017. PMID: 28498725 Review.
Cited by
-
Improved Selectivity in Eliciting Evoked Electromyography Responses With High-Resolution Spinal Cord Stimulation.Neurosurgery. 2024 Aug 1;95(2):322-329. doi: 10.1227/neu.0000000000002878. Epub 2024 Feb 20. Neurosurgery. 2024. PMID: 38376181 Free PMC article.
-
A Call to Action Toward Optimizing the Electrical Dose Received by Neural Targets in Spinal Cord Stimulation Therapy for Neuropathic Pain.J Pain Res. 2021 Sep 7;14:2767-2776. doi: 10.2147/JPR.S323372. eCollection 2021. J Pain Res. 2021. PMID: 34522135 Free PMC article. Review.
References
-
- Mammis A, Mogilner AY. The use of intraoperative electrophysiology for the placement of spinal cord stimulator paddle leads under general anesthesia. Neurosurgery. 2012;70:ons230–ons236. - PubMed
LinkOut - more resources
Full Text Sources
Other Literature Sources
