

Monosynaptic Retrograde Tracing From Prelimbic Neuron Subpopulations Projecting to Either Nucleus Accumbens Core or Rostromedial Tegmental Nucleus
- PMID: 33732114
- PMCID: PMC7959753
- DOI: 10.3389/fncir.2021.639733
Monosynaptic Retrograde Tracing From Prelimbic Neuron Subpopulations Projecting to Either Nucleus Accumbens Core or Rostromedial Tegmental Nucleus
Abstract
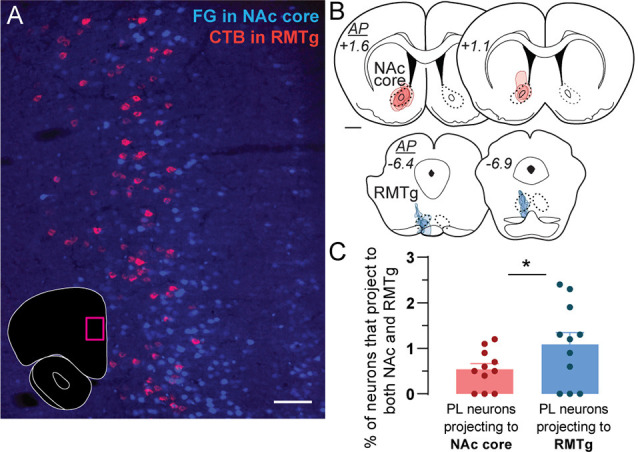
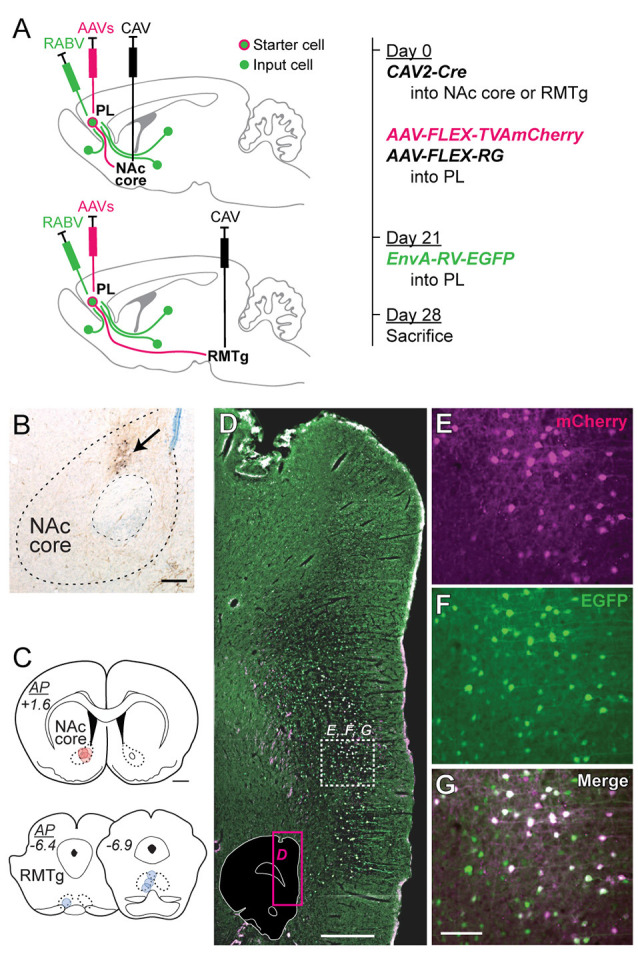
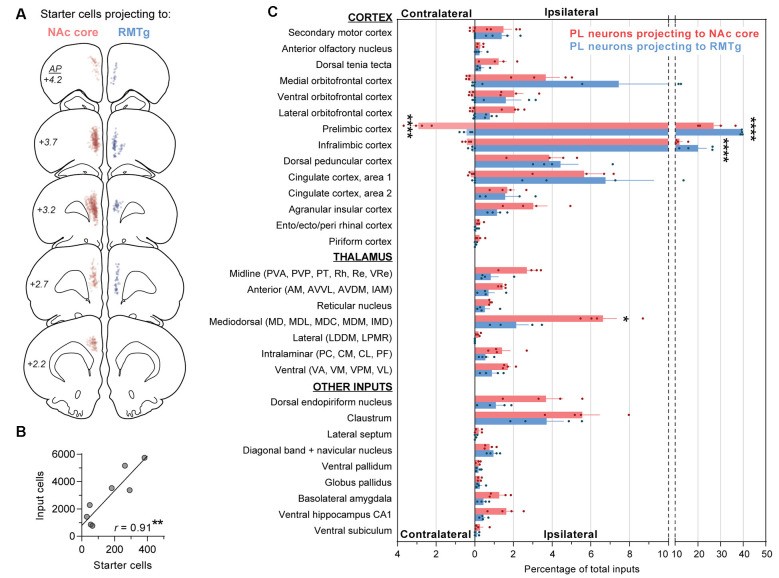
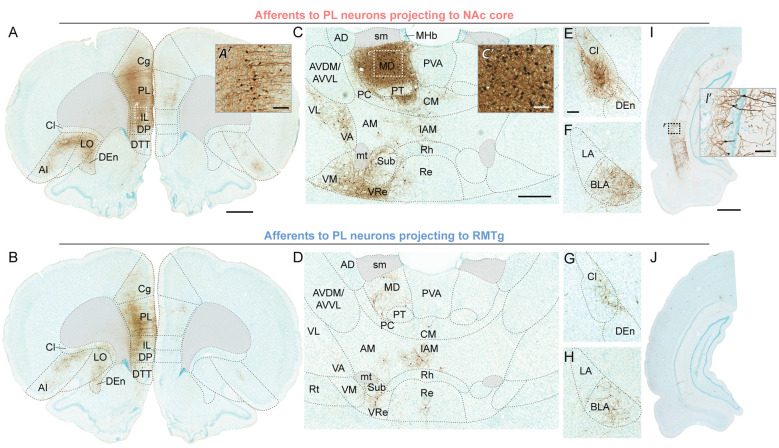
The prelimbic (PL) region of the medial prefrontal cortex (mPFC) has been implicated in both driving and suppressing motivated behaviors, including cocaine-seeking in rats. These seemingly opposing functions may be mediated by different efferent targets of PL projections, such as the nucleus accumbens (NAc) core and rostromedial tegmental nucleus (RMTg), which have contrasting roles in reward-seeking behaviors. We sought to characterize the anatomical connectivity differences between PL neurons projecting to NAc core and RMTg. We used conventional retrograde tracers to reveal distinct subpopulations of PL neurons projecting to NAc core vs. RMTg in rats, with very little overlap. To examine potential differences in input specificity for these two PL subpopulations, we then used Cre-dependent rabies virus (EnvA-RV-EGFP) as a monosynaptic retrograde tracer and targeted specific PL neurons via injections of retrograde CAV2-Cre in either NAc core or RMTg. We observed a similar catalog of cortical, thalamic, and limbic afferents for both NAc- and RMTg-projecting populations, with the primary source of afferent information arising from neighboring prefrontal neurons in ipsilateral PL and infralimbic cortex (IL). However, when the two subpopulations were directly compared, we found that RMTg-projecting PL neurons received a greater proportion of input from ipsilateral PL and IL, whereas NAc-projecting PL neurons received a greater proportion of input from most other cortical areas, mediodorsal thalamic nucleus, and several other subcortical areas. NAc-projecting PL neurons also received a greater proportion of contralateral cortical input. Our findings reveal that PL subpopulations differ not only in their efferent target but also in the input specificity from afferent structures. These differences in connectivity are likely to be critical to functional differences of PL subpopulations.
Keywords: RMTg; addiction; medial prefrontal cortex (mPFC); rabies; reinstatement.
Copyright © 2021 Cruz, Kim and Smith.
Conflict of interest statement
The authors declare that the research was conducted in the absence of any commercial or financial relationships that could be construed as a potential conflict of interest.
Figures
Similar articles
-
Prelimbic cortical projections to rostromedial tegmental nucleus play a suppressive role in cue-induced reinstatement of cocaine seeking.Neuropsychopharmacology. 2021 Jul;46(8):1399-1406. doi: 10.1038/s41386-020-00909-z. Epub 2020 Nov 23. Neuropsychopharmacology. 2021. PMID: 33230269 Free PMC article.
-
Increased Excitability and Synaptic Plasticity of Drd1- and Drd2-Expressing Prelimbic Neurons Projecting to Nucleus Accumbens after Heroin Abstinence Are Reversed by Cue-Induced Relapse and Protein Kinase A Inhibition.J Neurosci. 2023 May 31;43(22):4019-4032. doi: 10.1523/JNEUROSCI.0108-23.2023. Epub 2023 Apr 24. J Neurosci. 2023. PMID: 37094933 Free PMC article.
-
Chronic ethanol exposure produces long-lasting, subregion-specific physiological adaptations in RMTg-projecting mPFC neurons.Neuropharmacology. 2024 Nov 15;259:110098. doi: 10.1016/j.neuropharm.2024.110098. Epub 2024 Aug 6. Neuropharmacology. 2024. PMID: 39117106 Free PMC article.
-
Interactions among the medial prefrontal cortex, hippocampus and midline thalamus in emotional and cognitive processing in the rat.Neuroscience. 2006 Sep 29;142(1):1-20. doi: 10.1016/j.neuroscience.2006.06.027. Epub 2006 Aug 2. Neuroscience. 2006. PMID: 16887277 Review.
-
Differential roles of medial prefrontal subregions in the regulation of drug seeking.Brain Res. 2015 Dec 2;1628(Pt A):130-46. doi: 10.1016/j.brainres.2014.12.024. Epub 2014 Dec 18. Brain Res. 2015. PMID: 25529632 Free PMC article. Review.
Cited by
-
Molecular characteristics and laminar distribution of prefrontal neurons projecting to the mesolimbic system.Elife. 2022 Sep 5;11:e78813. doi: 10.7554/eLife.78813. Elife. 2022. PMID: 36063145 Free PMC article.
-
Involvement of cortical input to the rostromedial tegmental nucleus in aversion to foot shock.Neuropsychopharmacology. 2023 Sep;48(10):1455-1464. doi: 10.1038/s41386-023-01612-5. Epub 2023 May 23. Neuropsychopharmacology. 2023. PMID: 37221326 Free PMC article.
-
Structural and functional organization of the midline and intralaminar nuclei of the thalamus.Front Behav Neurosci. 2022 Aug 23;16:964644. doi: 10.3389/fnbeh.2022.964644. eCollection 2022. Front Behav Neurosci. 2022. PMID: 36082310 Free PMC article.
-
Determining the neuronal ensembles underlying sex-specific social impairments following adolescent intermittent ethanol exposure.Neuropharmacology. 2023 Nov 1;238:109663. doi: 10.1016/j.neuropharm.2023.109663. Epub 2023 Jul 8. Neuropharmacology. 2023. PMID: 37429543 Free PMC article.
-
Activation of the tail of the ventral tegmental area in response to pup predicting cues in maternal rats.Brain Struct Funct. 2025 Jul 24;230(7):121. doi: 10.1007/s00429-025-02987-5. Brain Struct Funct. 2025. PMID: 40705119 Free PMC article.
References
-
- Balcita-Pedicino J. J., Omelchenko N., Bell R., Sesack S. R. (2011). The inhibitory influence of the lateral habenula on midbrain dopamine cells: ultrastructural evidence for indirect mediation via the rostromedial mesopontine tegmental nucleus. J. Comp. Neurol. 519, 1143–1164. 10.1002/cne.22561 - DOI - PMC - PubMed
Publication types
MeSH terms
Substances
Grants and funding
LinkOut - more resources
Full Text Sources
Other Literature Sources