. 2021 Mar 1:12:633654.
doi: 10.3389/fimmu.2021.633654. eCollection 2021.

The SWI/SNF-Related, Matrix Associated, Actin-Dependent Regulator of Chromatin A4 Core Complex Represses Respiratory Syncytial Virus-Induced Syncytia Formation and Subepithelial Myofibroblast Transition

Affiliations

The SWI/SNF-Related, Matrix Associated, Actin-Dependent Regulator of Chromatin A4 Core Complex Represses Respiratory Syncytial Virus-Induced Syncytia Formation and Subepithelial Myofibroblast Transition

Xiaofang Xu et al. Front Immunol. .

Abstract

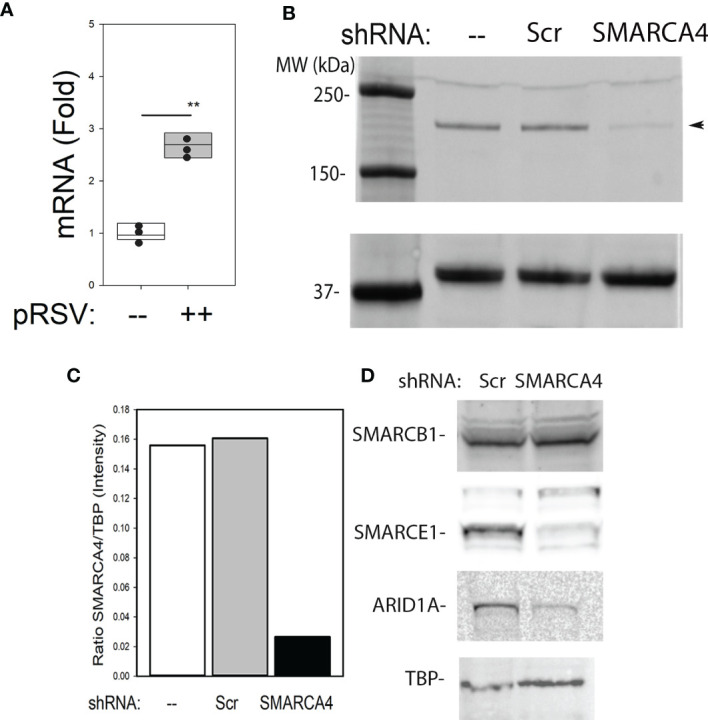
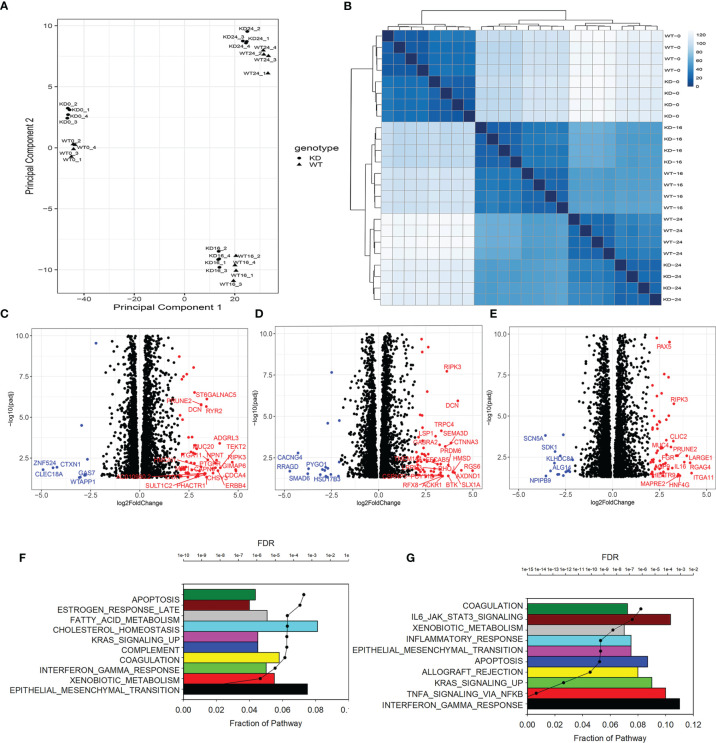
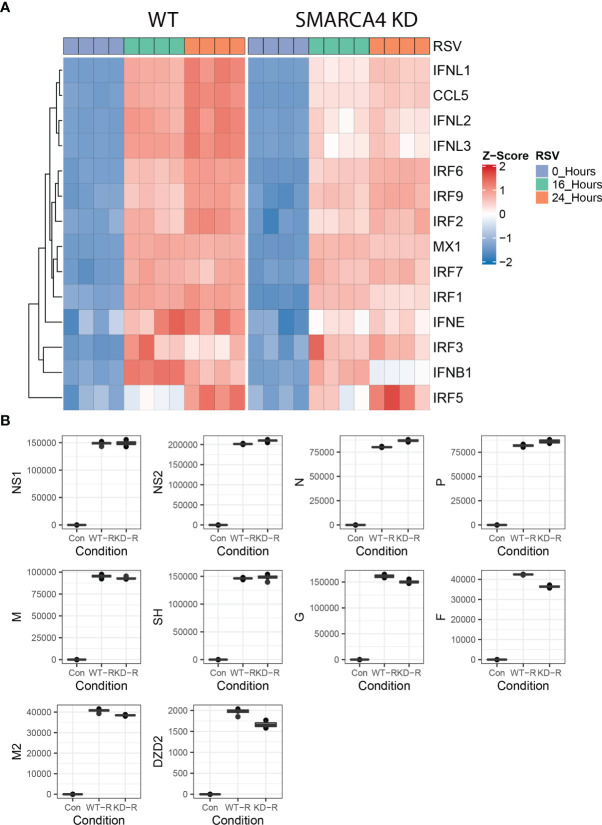
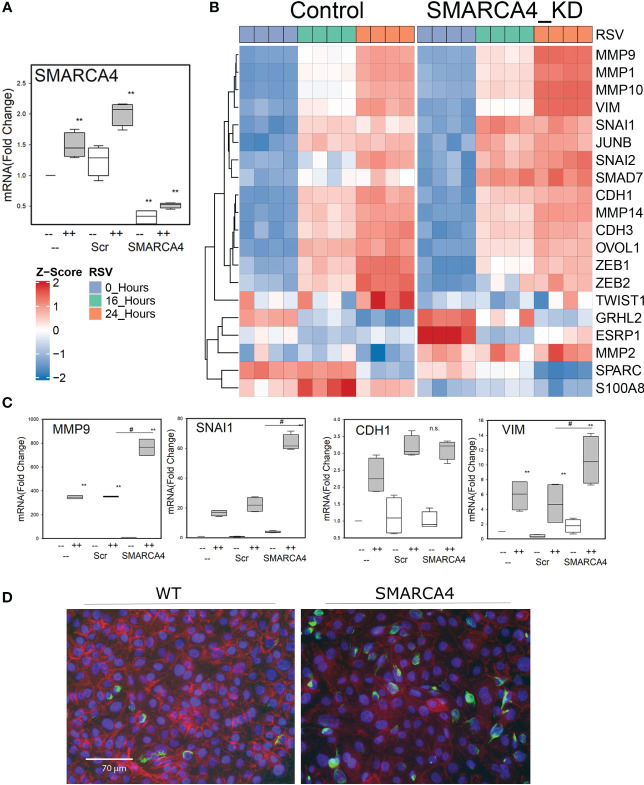
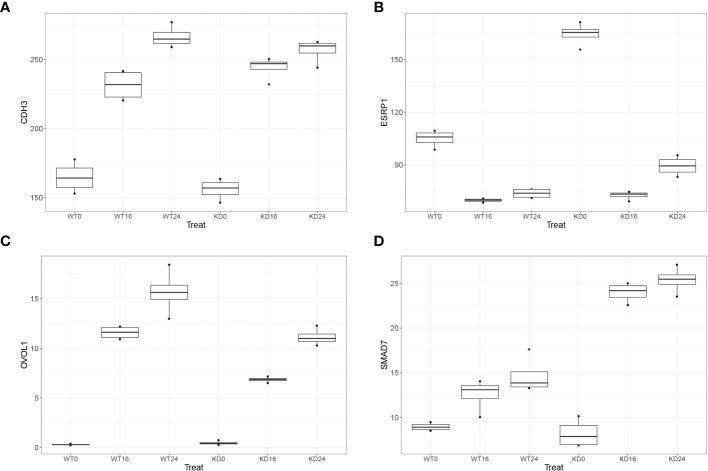
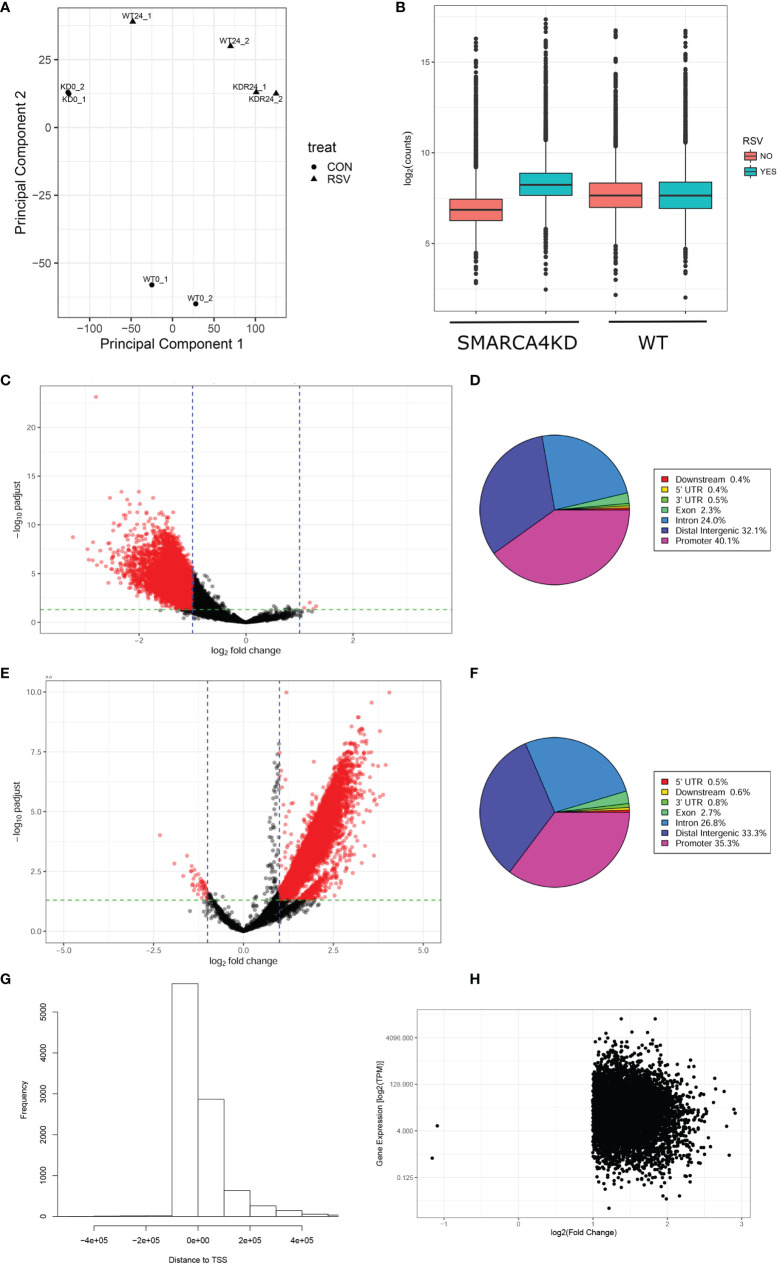
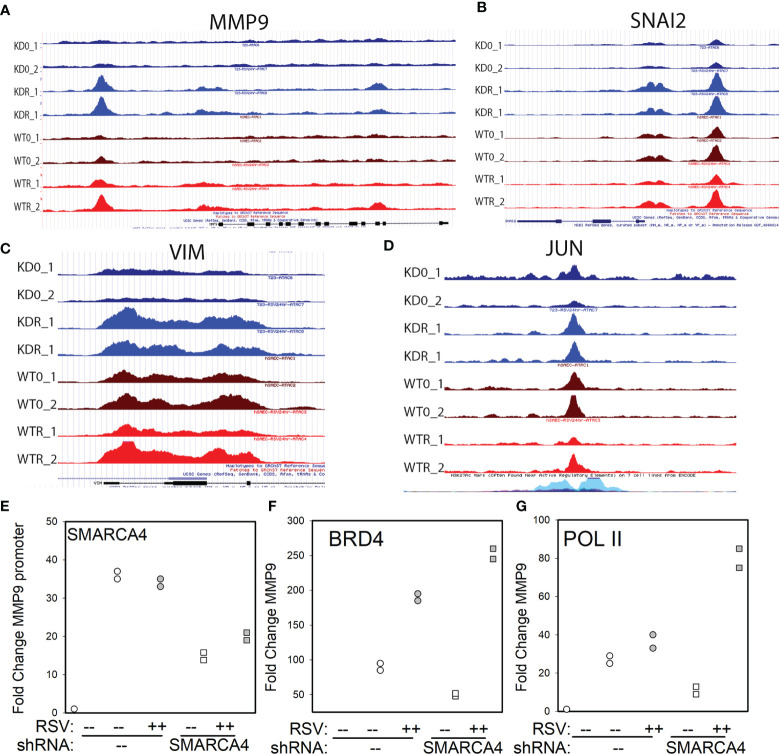
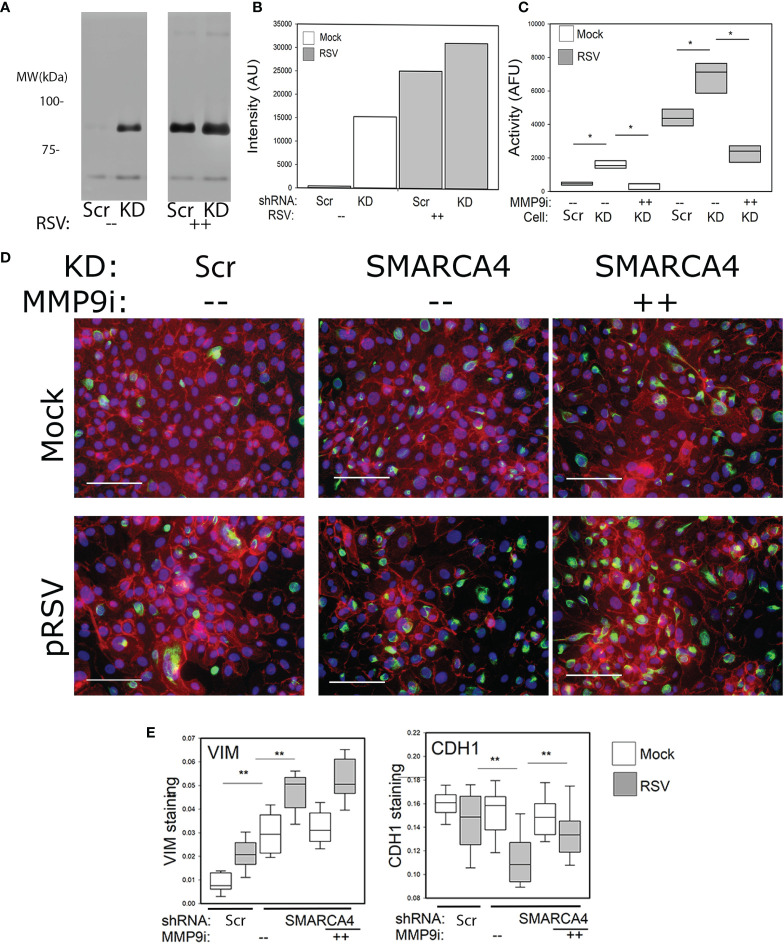
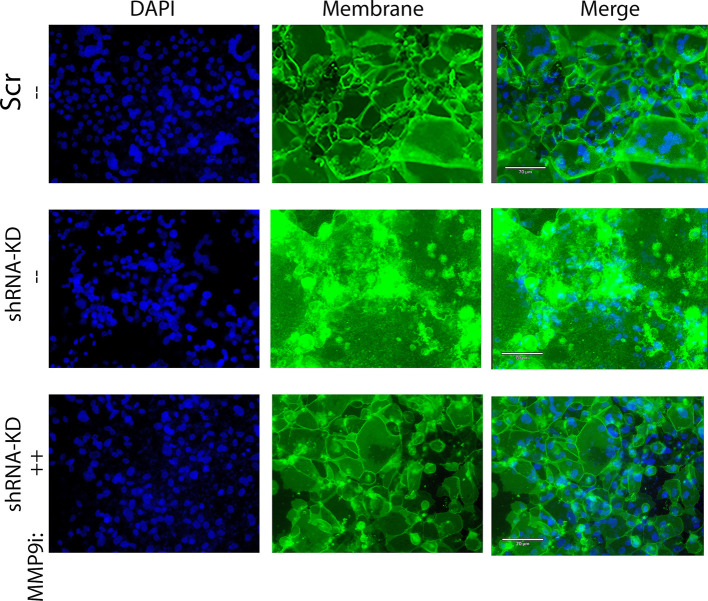
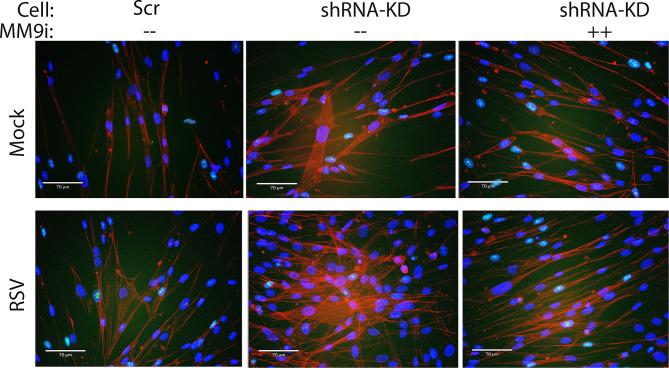
Epigenetics plays an important role in the priming the dynamic response of airway epithelial cells to infectious and environmental stressors. Here, we examine the epigenetic role of the SWI/SNF Related, Matrix Associated, Actin Dependent Regulator of Chromatin A4 (SMARCA4) in the epithelial response to RSV infection. Depletion of SMARCA4 destabilized the abundance of the SMARCE1/ARID1A SWI/SNF subunits, disrupting the innate response and triggering a hybrid epithelial/mesenchymal (E/M) state. Assaying SMARCA4 complex-regulated open chromatin domains by transposase cleavage -next generation sequencing (ATAC-Seq), we observed that the majority of cleavage sites in uninfected cells have reduced chromatin accessibility. Paradoxically, SMARCA4 complex-depleted cells showed enhanced RSV-inducible chromatin opening and gene expression in the EMT pathway genes, MMP9, SNAI1/2, VIM, and CDH2. Focusing on the key MMP9, we observed that SMARCA4 complex depletion reduced basal BRD4 and RNA Polymerase II binding, but enhanced BRD4/Pol II binding in response to RSV infection. In addition, we observed that MMP9 secretion in SMARCA4 complex deficient cells contributes to mesenchymal transition, cellular fusion (syncytia) and subepithelial myofibroblast transition. We conclude the SMARCA4 complex is a transcriptional repressor of epithelial plasticity, whose depletion triggers a hybrid E/M state that affects the dynamic response of the small airway epithelial cell in mucosal remodeling via paracrine MMP9 activity.

Keywords: airway remodeling; epithelial mesenchymal transition; extracellular matrix; matrix metalloproteinase (MMP); myofibroblast transition.


Conflict of interest statement

The authors declare that the research was conducted in the absence of any commercial or financial relationships that could be construed as a potential conflict of interest.

Figures

Figure 1
Figure 1
Induction and disruption of the SMARCA4 complex. (A) Wild type (WT) human small airway epithelial cells (hSAECs) were mock or pRSV infected (MOI=1). Q-RT-PCR was performed for SMARCA4 and PPIA mRNAs. Shown is fold change of SMARCA4 mRNA normalized to PPIA. **p < 0.01, 2 tailed T test. (B) Western immunoblot of SMARC A4 in WT, CON, and SMARCA4-shRNA expressing hSAECs. Left, molecular weight markers (in kDa). TATA binding protein (TBP) is internal control. (C) Quantification of individual western blot lanes in (B). Fluorescence intensity was quantified using ImageJ and presented as ratio of SMARCA4/TBP (arbitrary fluorescence units). Reproduced in three biological replicates. (D) Effect of SMARCA4 depletion on SWI/SNF core complex. Western blot of SMARCE1, SMARCB1, and ARID1A. TBP is internal loading control. Abundance of SMARCE1 and ARID1A were depleted by 50%, reproduced in n=3 experiments.
Figure 2
Figure 2
Effect of SMARCA4 complex depletion on RSV-inducible genes. (A) Multidimensional scaling of short-read RNA seq. Each point represents independent replicate. KD, SMARCA4 knockdown; WT, wild type. (B) Unsupervised clustered image maps of RNA-Seq data. Each row represents an RNA-seq result from CON or RSV infected hSAEC ± SMARCA4-shRNA. (C) Volcano plot of differentially expressed genes (DEGs) in uninfected WT vs SMARCA4 KD cells. X axis, log2Fold Change of transcripts/million (TPM). Y axis, -log10(adjusted p value using benjamini-hochberg, padj). (D) Volcano plot of DEGs of 16 h RSV-infected WT vs SMARCA4 KD cells. (E) Volcano plot of DEGs of 16 h RSV infected WT vs SMARCA4 KD cells. (F) Gene Set Enrichment Analysis (GSEA) of uninfected cells. Genes with 4-fold change in TPM and adjusted p-value of < 0.01 were compared. For each gene set, the fraction of genes represented in the pathway and the significance (false discovery rate, FDR) are plotted. Shown are the top 10 overrepresented pathways. (G) GSEA for 24 h RSV-infected cells. Data are shown as above.
Figure 3
Figure 3
SMARCA4 complex depletion affects type III IFN response without affecting viral transcription. (A) Hierarchical cluster of type II and type III IFN genes in WT and SMARCA4 depleted cells. Genes are organized by row, treatment conditions by column. Color indicates row-wise Z-score. Dendrogram is Euclidian distance. (B) Quantitation of RSV transcripts. TPM values of short-read RNA seq are plotted by quartile (25%–75%) box plot. Horizontal line is mean value. For each transcript group comparisons are significantly different (2 way-Anova p<0.05) with virus infection vs mock-infected (con) contrast p<0.01 post-hoc Tukey’s. DZD2, RNA-dependent RNA polymerase; F, fusion protein; G, glycoprotein; M, matrix protein; N, nucleoprotein; NS, non-structural protein; P, phosphoprotein; SH, small hydrophobic protein.
Figure 4
Figure 4
Effect of the SMARCA4 complex depletion on the EMT program. (A) Q-RT-PCR for SMARCA4 knockdown. RNA was prepared from uninfected or 24 h infected scrambled or SMARCA4 knockdown cells. Data is normalized to internal control PP1A and expressed as fold change relative to uninfected WT cells. *p <0.01, ANOVA, with contrast using post-hoc Tukeys. (B) Hierarchical clustering of EMT signature genes. Expression patterns of signature epithelial or mesenchymal genes in the time course were z-score–normalized and subjected to hierarchical clustering using Euclidian distance. Abbreviations used are: MMP, matrix metalloproteinase; SNAI1, Snail Family Transcriptional Repressor 1; JunB, JunB Proto-Oncogene; CDH, Cadherin; VIM, vimentin; SPARC, Secreted Protein Acidic And Cysteine Rich; ITGB3, integrin Subunit Beta 3; TWIST, Twist Family BHLH Transcription Factor; S100A8, S100 Calcium Binding Protein A8; ZEB: Zinc finger E-box binding homeobox. (C) Q-RT-PCR for EMT pathway “signature genes”- MMP9, VIM, SNAI1, CDH2, and CDH1. RNA was prepared from uninfected or 24 h infected cells (MOI 1). Data is normalized to internal control PP1A and expressed as fold change relative to uninfected WT cells. **p <0.01, ANOVA, with contrast using post-hoc Tukeys. #p<0.01 compared to Scr. (D) Immunofluorescent staining of SMARCA4-depleted cells. Cells were stained with VIM (green) and CDH1 (red). Note the loss of cell surface CDH1 and the accumulation of VIM in the SMARCA4 complex-depleted cells, characteristic of pEMT.
Figure 5
Figure 5
SMARCA4 depletion dysregulates MET programs. Quantitative RNA-seq profiles of key MET regulators are plotted for wild type and SMARCA4 KD cells for 0, 16, and 24 h of RSV infection (all are significant at p<0.05, FDR using DESeq2). (A) CDH3; (B) ESRP1; (C) OVOL1; (D) SMAD7.
Figure 6
Figure 6
Effects of SMARCA4 complex depletion on chromatin accessibility. (A) PCA analysis. PC1 and PC2 explain 76.7% and 13.0% of total variances respectively. (B) Distributions of log-transformed count abundance by cell type. (C, E) Volcano plots for differentially accessible peaks. (C) Uninfected SMARCA4 KD vs. WT cells. (D) RSV infection effects between KD and WT. X axis, log2(fold change); Y axis, -log10(adjusted p-value). (D, F) Regions of significant ATAC-seq peaks relative to annotated gene bodies. ATAC-seq peaks with 2-fold change and adjusted p value of <0.05 were mapped onto gene bodies (hg19). The distribution of peaks (percent of significant peaks) is shown for each region in the pie chart. Enriched motifs are shown in the Supporting Material, Figures S3, S4. (G) Histogram of location of significant ATAC-Seq peaks relative to gene body annotations. (H) Correlation of RSV induced changes in ATAC-Seq peaks in 7,329 promoters with changes in RNA expression (TPM). Note that increases in RSV-induced changes chromatin accessibility are associated with increased gene expression.
Figure 7
Figure 7
SMARCA4 depletion induces transcription factor loading EMT pathway genes. (A) Integrated Genomics Viewer of the individual ATAC seq peaks for uninfected and RSV infected WT and SMARCA4-shRNA KD cells for the MMP9 gene. Each track is shown individually. Location of MMP9 exons and direction of transcription are shown at bottom. (B), IGV of SNAI2 gene. (C) IGV of VIM gene. (D) IGV view of extragenic enhancer upstream of JUN. H3K27Ac peaks, characteristic of an active enhancer are shown at bottom. (E) XChIP for SMARCA4 on the MMP9 proximal promoter. For each IP, Q-gPCR of MMP9 promoter abundance was performed. Data are presented as fold change over IgG. Individual symbols are biological replicates. Each symbol is the means of technical replicates. (F) Q-gPCR of XChIP for BRD4 –long isoform (BRD4-L). (G) Q-gPCR for RNA Pol II.
Figure 8
Figure 8
Enhanced cytopathic effect in SMARCA4 complex depleted genes is partially mediated by MMP9. (A) In gel zymography of MMP isoforms. Shown is an inverted image of a cell culture supernatant from Scr or SMARCA4 knockdown (KD) cells in the absence or presence of RSV infection (MOI 1, 24 h). After fractionation, proteins were rehydrated and gelatinase activity observed by cleared bands. Approximate migration of molecular weight standards are shown at left. Note the major gelatinase activity is ~90 kDa, corresponding to MMP9. *p<0.05. (B) Quantitation of zymogram. Images were analyzed using FIJI and plotted. (C) Fluorescent MMP1/9 enzymatic assay. Cell culture supernatants were incubated with MMP1/9 fluorogenic peptide. Fluorescence activity was measured in n=3 lysates. (D) Immunofluorescence microscopy. Cells were treated as in (A) and stained with CDH1 (red) and VIM (green). Note the dramatic loss of CDH1 in the SMARCA4 complex-depleted cells and increase in VIM. The RSV-induced depletion of CDH1 is reversed by the MM9 inhibitor. (E) Quantitation of VIM and CDH1 staining using ImageJ. **p<0.05 Scr vs SMARCA4 shRNA.
Figure 9
Figure 9
Enhanced syncytia formation by SMARCA4 complex-depleted cells is potentiated by MMP9. To examine responses in a physiological system, where normal epithelial-fibroblast interactions could occur, epithelial cells were co cultured in transwell inserts with submerged NHLFs. Control Scr- or SMARCA4-shRNA cells were infected (pRSV, MOI =0.5, 72 h); SMARCA4-shRNA KD cells were separately treated with MMP9 Inhibitor I (5 µM). Cells were fixed and plasma membrane visualized by staining with CellBright (green) and nuclei stained with DAPI (blue). Note the presence of multiple nuclei within a cellular boundary indicating the formation of a multinucleated giant cell.
Figure 10
Figure 10
SMARCA4 complex depletion results in enhanced subepithelial myofibroblast formation. Control-Scr shRNA or SMARCA4-shRNA cells cultured in transwell inserts separated from normal human lung fibroblasts (NHLFs) underneath in submerged culture. Eptihelial cells were mock or infected with pRSV (MOI = 0.5, 72 h) in the absence or presence of MMP9 Inhibitor I. NHLFs grown were fixed and stained with phalloidin (red) or DAPI (nuclei) to identify stress fibers. Note the phenotypic change of cell widening and enhanced stress fiber formation in the fibroblasts co-cultured with SMARCA4-shRNA cells and potentiation of stress fiber formation by epithelial RSV infection.

Similar articles

Cited by

References

    1. Crystal RG, Randell SH, Engelhardt JF, Voynow J, Sunday ME. Airway epithelial cells: current concepts and challenges. Proc Am Thorac Soc (2008) 5(7):772–7. 10.1513/pats.200805-041HR - DOI - PMC - PubMed
    1. Knight DA, Holgate ST. The airway epithelium: structural and functional properties in health and disease. Respirology (2003) 8(4):432–46. 10.1046/j.1440-1843.2003.00493.x - DOI - PubMed
    1. Brasier AR. Mechanisms how mucosal innate immunity affects progression of allergic airway disease. Expert Rev Respir Med (2019) 13(4):349–56. 10.1080/17476348.2019.1578211 - DOI - PMC - PubMed
    1. Hogg JC, Chu F, Utokaparch S, Woods R, Elliott WM, Buzatu L, et al. . The Nature of Small-Airway Obstruction in Chronic Obstructive Pulmonary Disease. N Engl J Med (2004) 350(26):2645–53. 10.1056/NEJMoa032158 - DOI - PubMed
    1. Harvey B-G, Heguy A, Leopold PL, Carolan BJ, Ferris B, Crystal RG. Modification of gene expression of the small airway epithelium in response to cigarette smoking. J Mol Med (2007) 85(1):39–53. 10.1007/s00109-006-0103-z - DOI - PubMed

Publication types

MeSH terms