. 2021 Feb 25:9:632303.
doi: 10.3389/fcell.2021.632303. eCollection 2021.

HOXA5 Participates in Brown Adipose Tissue and Epaxial Skeletal Muscle Patterning and in Brown Adipocyte Differentiation

Affiliations

HOXA5 Participates in Brown Adipose Tissue and Epaxial Skeletal Muscle Patterning and in Brown Adipocyte Differentiation

Miriam A Holzman et al. Front Cell Dev Biol. .

Abstract

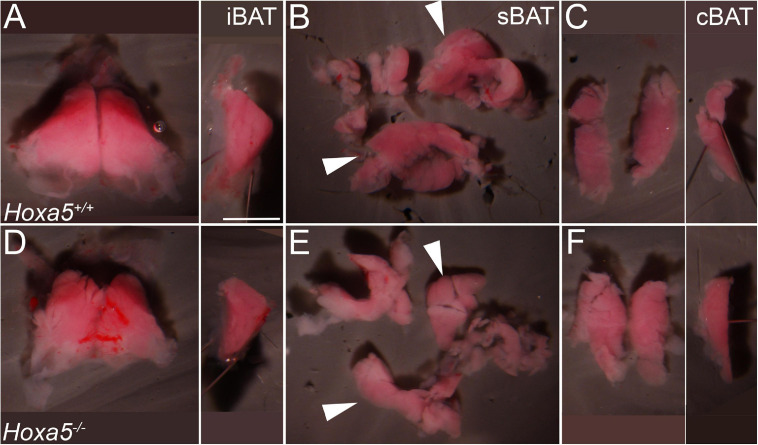
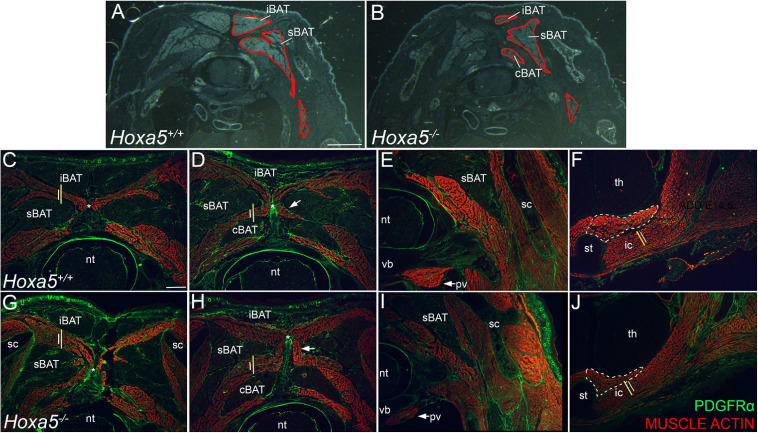
Brown adipose tissue (BAT) plays critical thermogenic, metabolic and endocrine roles in mammals, and aberrant BAT function is associated with metabolic disorders including obesity and diabetes. The major BAT depots are clustered at the neck and forelimb levels, and arise largely within the dermomyotome of somites, from a common progenitor with skeletal muscle. However, many aspects of BAT embryonic development are not well understood. Hoxa5 patterns other tissues at the cervical and brachial levels, including skeletal, neural and respiratory structures. Here, we show that Hoxa5 also positively regulates BAT development, while negatively regulating formation of epaxial skeletal muscle. HOXA5 protein is expressed in embryonic preadipocytes and adipocytes as early as embryonic day 12.5. Hoxa5 null mutant embryos and rare, surviving adults show subtly reduced iBAT and sBAT formation, as well as aberrant marker expression, lower adipocyte density and altered lipid droplet morphology. Conversely, the epaxial muscles that arise from a common dermomyotome progenitor are expanded in Hoxa5 mutants. Conditional deletion of Hoxa5 with Myf5/Cre can reproduce both BAT and epaxial muscle phenotypes, indicating that HOXA5 is necessary within Myf5-positive cells for proper BAT and epaxial muscle development. However, recombinase-based lineage tracing shows that Hoxa5 does not act cell-autonomously to repress skeletal muscle fate. Interestingly, Hoxa5-dependent regulation of adipose-associated transcripts is conserved in lung and diaphragm, suggesting a shared molecular role for Hoxa5 in multiple tissues. Together, these findings establish a role for Hoxa5 in embryonic BAT development.

Keywords: Hoxa5; adipose development; brown adipose tissue; differentiation; skeletal muscle development.


Conflict of interest statement

The authors declare that the research was conducted in the absence of any commercial or financial relationships that could be construed as a potential conflict of interest.

Figures

FIGURE 1
FIGURE 1
HOXA5 expression in embryonic and adult BAT. (A) HOXA5 is expressed throughout BAT from the first stage it becomes morphologically identifiable at E14.5 (white outline). (B–D) BAT adipocyte nuclei, identified based on expression of EBF2, co-express HOXA5. (E) HOXA5 continues to be expressed in BAT (white outline) at E16.5, shown here in sBAT. (F,G) HOXA5 is apparent in nuclei of round adipocytes (arrows) and sickle-shaped fibroblasts (arrowheads) within BAT. Inset in (G) shows that BAT fibroblasts are co-labeled with HOXA5 and PDGFRα. (H) By E18.5, cytoplasmic GFP reveals expression of Hoxa5 in adipocytes (arrows) of a TgHoxa5Cre/GFP embryo, also shown in sBAT. (I,J) At 3-months of age, Hoxa5 expression in BAT remains detectable by GFP accumulation in a TgHoxa5Cre/GFP adult mouse, and is mostly restricted to adipocytes that co-labeled with PPARγ- (arrows). Panel (J) is an inset of (I), as indicated. (K,L) Hoxa5 is also expressed in PDGFRα-positive fibroblasts (arrowheads). b, BAT; m, epaxial skeletal muscle; sc, scapula. Scale bars: 100 μm (A,E,I,K), 50 μm (B–D), 10 μm (F,G), 200 μm (H), 20 μm (J,L). In all images, dorsal is up and lateral is to the right.
FIGURE 2
FIGURE 2
Co-localization of HOXA5 with BAT markers EBF2 and PRDM16 at E12.5. (A–D) The myotome, labeled with Myosin 4 (MYO) (A), is flanked by mesenchyme that co-expresses HOXA5 and EBF2 (B–D), and extends laterally to the scapula and medially to the neural tube. Panels (E-L) show higher magnification views of the area surrounding myotome; indicated insets in (E,I) are shown in (F–H,J–L). (E–H) Epaxial myotome (dotted red outline in (E) is flanked by mesenchyme co-expressing HOXA5 and EBF2 (white arrows). While neither protein is expressed in muscle, co-expression is observed in prospective muscle connective tissue fibroblasts within the myotome (red arrowheads). (I–L) PRDM16 and HOXA5 are co-expressed in mesenchyme lateral to the epaxial myotome. The epaxial myotome is surrounded by a dotted red outline, and area of nuclear PRDM16 expression by the dotted white outline in (I). Co-expression of nuclear HOXA5 in PRDM16 domain is marked by white arrows (L). Note in contrast to EBF2 and HOXA5, PRDM16 is not expressed in muscle connective tissue fibroblasts (red arrowheads). However, cytoplasmic PRDM16 is expressed in skeletal muscle. d, dorsal root ganglion, na, neural arch; nt, neural tube; sc, scapula. Scale bars: 200 μm (A–D), 100 μm (E,I), 50 μm (F–H,J–L). In all images, dorsal is up and lateral is to the left.
FIGURE 3
FIGURE 3
iBAT and sBAT reduction in E18.5 Hoxa5 homozygous mutant embryos. BAT depots were dissected from Hoxa5+/+ (A–C) and Hoxa5–/– (D–F) littermates. (A,D) iBAT was reduced but otherwise morphologically similar in a Hoxa5 null embryo compared to the control. This is evident in ventral view (left) or in a medial view of one lobe (right image; anterior is up and dorsal is to the left). (B,E) sBAT was also reduced, particularly in the thickest part (white arrowheads) located just medial to the scapular blades. (C,F) cBAT appears similar in both genotypes, in frontal (left) or medial (right) views. iBAT, interscapular BAT; sBAT, scapular BAT, cBAT, cervical BAT. Scale bar: 2 mm.
FIGURE 4
FIGURE 4
BAT reduction and epaxial skeletal muscle expansion in Hoxa5 null embryos at E18.5. (A,B) Pseudo-darkfield micrographs through position-matched C7 segments show reduced BAT area in a Hoxa5 null embryo compared to a littermate control. Depots are outlined in red on the right side only. (C–J) Epaxial muscles are expanded concomitant with BAT reduction, while some hypaxial muscles are reduced in Hoxa5 null embryos. Skeletal muscles are stained with actin, and PDGFRα counterstains connective tissue fibroblasts within muscle and BAT, tendon, ligament, dermis. Wild type vs. Hoxa5 null littermates were compared in position-matched sections through C7 and T1 segments. Lines reproduced in (C,G) compare the rhomboid height in wild-type (white) vs. Hoxa5 null (yellow) at the same position. Similar lines in (D,H) compare relative splenius height. Both are larger in Hoxa5 null embryos. The nuchal ligament is marked by an asterisk in (C,D,G,H). Hypaxial muscles show reduced size, including the prevertebral muscle (arrows, E,I), the sternothyroid muscle (white dotted outline, F,J) and first intercostal muscle [white lines in F,J are reproduced at the same size to compare wild-type (white) and Hoxa5 null (yellow) littermates]. cBAT, cervical BAT; iBAT, interscapular BAT; ic, intercostal muscle; nt, neural tube; pv, prevertebral muscle; sBAT, scapular BAT; sc, scapula; st, sternum; th, thymus; vb, vertebral body. Scale bars: (A,F) 2 mm; all other panels: 400 μm.
FIGURE 5
FIGURE 5
Cellular phenotypes of Hoxa5 mutant BAT at E18.5. Nuclear adipocyte marker PPARγ (A,B,F,G) shows adipocytes are less dense in Hoxa5 null BAT compared to littermate controls. (C,D,H,I) Lipid droplets (white arrowheads) visualized by Perilipin, which accumulation at their peripheries and/or the fluorescent lipid dye BODIPY are reduced in number and disorganized in Hoxa5 null compared to control iBAT. BAT-specific inner mitochondrial membrane protein UCP1 showed similar accumulation in Hoxa5 null compared to control BAT (E,J). (K) Mean iBAT nuclear density indicates a trend toward reduction in Hoxa5 null embryos (n = 6 littermate pairs). (L) qRT-PCR on dissected E18.5 sBAT shows expression of key markers in Hoxa5 mutants. Color coded lines and abbreviations indicate transcript markers for specific cell types, including markers for fibroblasts/pre-adipocytes (p/f), transcriptional markers for all adipocytes (ad), transcriptional markers of brown adipocytes (bw ad), transcripts associated with mitochondrial biogenesis and thermogenic function (mito), transcripts associated with fatty acid uptake and storage (FA), with white adipocytes (wh ad), myogenic precursors (pink), differentiated muscle (red) (myo). All markers were quantified relative to the Rpl19 control and normalized to the average value from control embryos. Mean and SEM of n = 5–6 embryo pairs shown. p < 0.05, ∗∗p < 0.01, two-tailed t-test. Scale bars: 50 μm. (A,F are at the same scale; all other panels are at the same scale shown in F).
FIGURE 6
FIGURE 6
Hoxa5 null BAT phenotypes persist in adults. Rare Hoxa5–/– animals that survived embryonic lethality were compared to Hoxa5+/+or ± littermate controls. (A,B) iBAT or sBAT is reduced in Hoxa5 null adults across a range of ages. iBAT is shown in ventral view (A) and sBAT in dorsal view (B), with anterior up. (C) Relative weights of these organs in Hoxa5–/– animals compared to controls, normalized for whole-animal body weight, also showed reduction for both iBAT and sBAT. Measurements were pooled across 4 littermate controls of various ages. See also Supplementary Table 3. (D–M) sBAT sections were compared in a 2-month adult littermate pair; insets indicated in (D,I) are shown in (E,F,J,K). BAT cell density visualized by DAPI (E,J) appeared reduced in Hoxa5–/– animals, similar to what was observed in embryos. In addition, lipid droplets were smaller and less organized in null compared to control sBAT, visualized with the lipophilic dye BODIPY (F,G vs. K,L) or with PERILIPIN IF (H,M). Arrowheads in (G,H) indicate large, well defined lipid droplets stained by BODIPY and outlined by PERILIPIN that are common in wild-type but not in Hoxa5 null iBAT. Scale bars: panels (A,B) 2 mm; (D–F,I–K) 50 μm; (G,H,L,M) 20 μm.
FIGURE 7
FIGURE 7
Hoxa5 deletion in the Myf5 lineage recapitulates BAT reduction and epaxial muscle expansion of Hoxa5 null embryos. Control heterozygous (A,D–G) and conditionally Hoxa5 deleted (B,H–K) E18.5 embryos of the genotypes indicated were examined for BAT and skeletal muscle phenotypes (A,B) Pseudo-darkfield micrographs through position-matched segments show reduced BAT area in Hoxa5 null embryo compared to littermate control. Depots are outlined in red on the right side only. (C) Measurement of BAT area on tissue sections, as described in the text, shows it is significantly reduced following either complete deletion or Myf5 conditional deletion of Hoxa5. Lines show mean BAT ratio of 69% for Hoxa5 null embryos compared to controls, and 73% for embryos in which Hoxa5 is conditionally deleted with Myf5/Cre. Asterisk indicates p < 0.05, paired t-test; n = 3 littermate pairs. (B,C,G,H) A reciprocal expansion of epaxial muscles was also observed. White and yellow lines duplicated in (D,E) and (H,I) compare epaxial muscle width in controls (white lines) vs. Hoxa5 conditional deletion (yellow lines). The top lines mark the width of the rhomboid (note the trapezius overlying the rhomboid is not included). Bottom lines mark the splenius. The nuchal ligament is marked by an asterisk. (F,G,J,K) Hypaxial muscles show no difference following conditional Hoxa5 deletion, including the prevertebral muscle (arrows, F,J), the sternothyroid muscle (white dotted outline, G,K) and first intercostal muscle (white line in G,K is reproduced at the same size in each panel). Abbreviations: cBAT, cervical BAT; iBAT, interscapular BAT; ic, intercostal muscle; nt, neural tube; pv, prevertebral muscle; sBAT, scapular BAT; sc, scapula; st, sternum; th, thymus; vb, vertebral body. Scale bars for (A,F) 2 mm; for all other panels, 400 μm.
FIGURE 8
FIGURE 8
Hoxa5 plays an early role in BAT development, but likely not in BAT versus skeletal muscle lineage specification. (A–D) Hoxa5 null embryo shows smaller BAT area (dotted outline in A,C) and reduced adipocyte density (compare B,D) at E14.5, the earliest stage at which BAT is morphologically distinguished from skeletal muscle. (E) Dissected C3-T2 segments from E12.5–E13.5 Hoxa5 null embryos at earlier stages show reduced expression of some early adipocyte transcripts, suggesting fewer specified BAT progenitors at this early stage. These transcripts were also reduced in Hoxa5 null respiratory tissues, suggesting a conserved regulatory role for HOXA5 across tissues. Markers were quantified relative to the rpl19 control and normalized to the average value from control embryos. Mean and SEM of n = 6 embryo pairs shown. p < 0.05, ∗∗p < 0.01, two-tailed t-test. (F–I) Hoxa5 -descendant cells show identical tissue-restriction in Hoxa5 null embryos compared to controls, indicating Hoxa5 is not necessary to cell-autonomously repress skeletal muscle fate. Hoxa5 descendant cells (cells activating the Hoxa5 promoter) were labeled with nuclear YFP (nYFP) to determine their tissue contribution in controls (TgHoxa5Cre; Rosa26nYFP/+; Hoxa5±, F–G) compared to Hoxa5 null littermates (TgHoxa5Cre; Rosa26nYFP/+; Hoxa5–/–; H–I). In both genotypes, cells descended from Hoxa5 expressing cells contributed substantially to all three BAT depots (labeled sBAT adipocytes indicated by arrows). Further, Hoxa5 descendant cells contributed to most musculoskeletal tissue types except skeletal muscle, as previously reported. Labeled cells were found within muscle connective tissue fibroblasts (arrowheads), as previously reported for wild-type embryos. Together, this indicates Hoxa5 is not necessary to cell-autonomously repress skeletal muscle fate. iBAT, interscapular BAT; sBAT, scapular BAT; cBAT, cervical BAT. Arrows indicate the nuchal ligament at the midline. Scale bars: (A,C,F–I) 200 μm, (B,D) 100 μm.

References

    1. An Y., Wang G., Diao Y., Long Y., Fu X., Weng M., et al. (2017). A molecular switch regulating cell fate choice between muscle progenitor cells and brown adipocytes. Dev. Cell 41 382.e5–391.e5. 10.1016/j.devcel.2017.04.012 - DOI - PubMed
    1. Atit R., Sgaier S. K., Mohamed O. A., Taketo M. M., Dufort D., Joyner A. L., et al. (2006). β-catenin activation is necessary and sufficient to specify the dorsal dermal fate in the mouse. Dev. Biol. 296 164–176. 10.1016/j.ydbio.2006.04.449 - DOI - PubMed
    1. Bérubé-Simard F. A., Jeannotte L. (2014). Hoxa5/Cre transgenic mice: novel tools for regional deletion along the anterior-posterior axis. Genesis 52 149–156. 10.1002/dvg.22733 - DOI - PubMed
    1. Borensztein M., Viengchareun S., Montarras D., Journot L., Binart N., Lombès M., et al. (2012). Double Myod and Igf2 inactivation promotes brown adipose tissue development by increasing Prdm16 expression. FASEB J. 26 4584–4591. 10.1096/fj.12-208496 - DOI - PubMed
    1. Buckingham M., Rigby P. W. J. (2014). Gene regulatory networks and transcriptional mechanisms that control myogenesis. Dev. Cell 28 225–238. 10.1016/j.devcel.2013.12.020 - DOI - PubMed

LinkOut - more resources