

Cofeeding tolerance in chimpanzees depends on group composition: a longitudinal study across four communities
- PMID: 33733060
- PMCID: PMC7940988
- DOI: 10.1016/j.isci.2021.102175
Cofeeding tolerance in chimpanzees depends on group composition: a longitudinal study across four communities
Erratum in
-
Erratum: Cofeeding tolerance in chimpanzees depends on group composition: A longitudinal study across four communities.iScience. 2021 Apr 29;24(5):102453. doi: 10.1016/j.isci.2021.102453. eCollection 2021 May 21. iScience. 2021. PMID: 33997714 Free PMC article.
Abstract
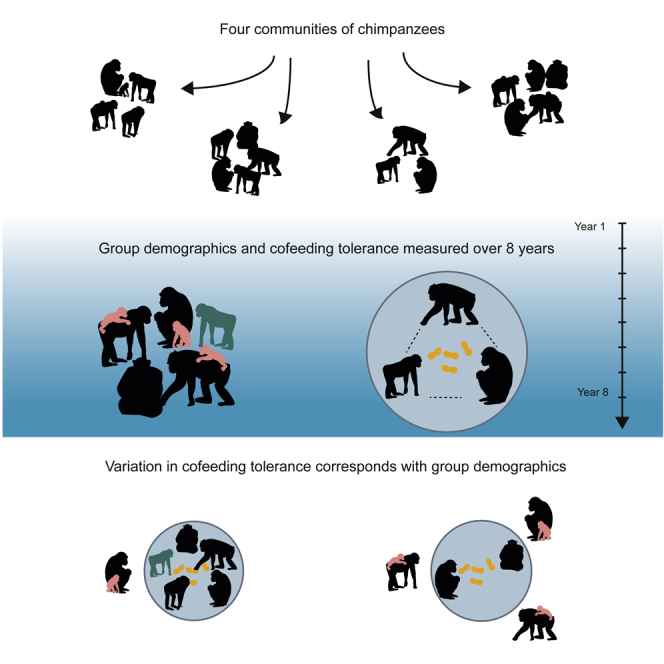
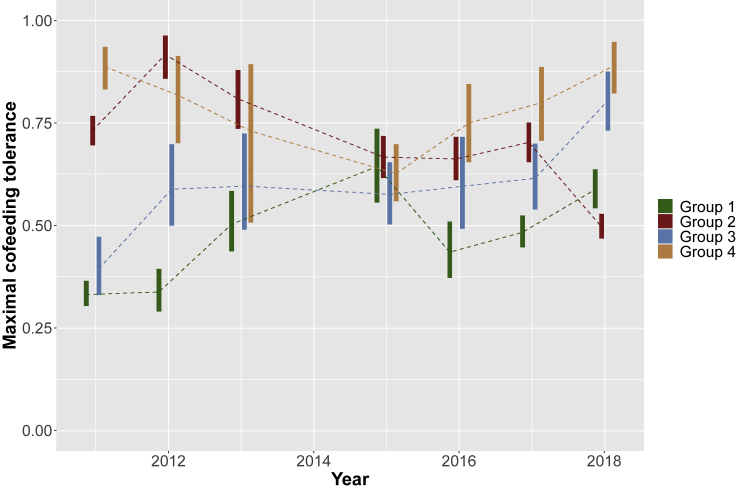
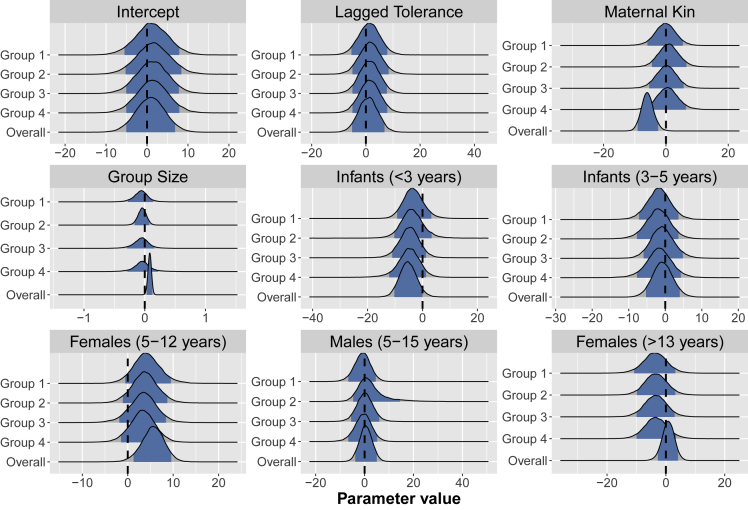
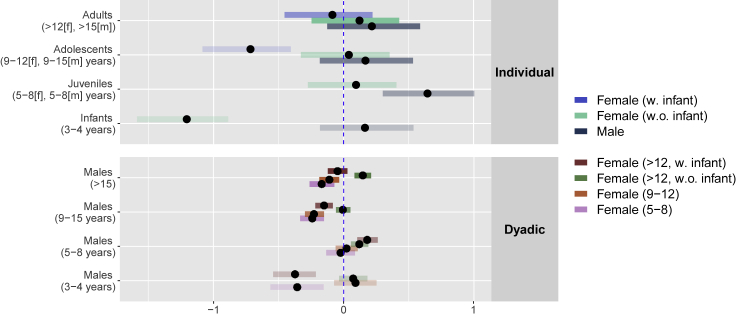
Social tolerance is generally treated as a stable, species-specific characteristic. Recent research, however, has questioned this position and emphasized the importance of intraspecific variation. We investigate the temporal stability of social tolerance in four groups of sanctuary-housed chimpanzees over eight years using a commonly employed measure: experimental cofeeding tolerance. We then draw on longitudinal data on the demographic composition of each group to identify the factors associated with cofeeding tolerance. We find appreciable levels of variation in cofeeding tolerance across both groups and years that correspond closely to changes in group-level demographic composition. For example, cofeeding tolerance is lower when there are many females with young infants. These results suggest that social tolerance may be a "responding trait" of chimpanzee sociality, reflecting individual-level behavioral responses to social changes. Additional, experimental research is needed to better model the causal drivers of social tolerance within and among species.
Keywords: Animals; Evolutionary Biology; Zoology.
© 2021 The Author(s).
Conflict of interest statement
The authors declare no competing interests.
Figures
References
-
- Amici F., Call J., Aureli F. Aversion to violation of expectations of food distribution: the role of social tolerance and relative dominance in seven primate species. Behaviour. 2012;149:345–368.
-
- Atsalis S., Videan E. Reproductive aging in captive and wild common chimpanzees: factors influencing the rate of follicular depletion. Am. J. Primatology. 2009;71:271–282. - PubMed
-
- Balasubramaniam K.N., Beisner B.A., Berman C.M., De Marco A., Duboscq J., Koirala S., Majolo B., MacIntosh A.J., McFarland R., Molesti S. The influence of phylogeny, social style, and sociodemographic factors on macaque social network structure. Am. J. Primatology. 2018;80:e22727. - PubMed
-
- Balasubramaniam K.N., Dittmar K., Berman C.M., Butovskaya M., Cooper M.A., Majolo B., Ogawa H., Schino G., Thierry B., de Waal F.B.M. Hierarchical steepness, counter-aggression, and macaque social style scale. Am. J. Primatology. 2012;74:915–925. - PubMed
-
- Bengston S.E., Jandt J.M. The development of collective personality: the ontogenetic drivers of behavioral variation across groups. Front. Ecol. Evol. 2014;2:1–13.
LinkOut - more resources
Full Text Sources
Other Literature Sources
