

Forecasting and Evaluating Multiple Interventions for COVID-19 Worldwide
- PMID: 33733158
- PMCID: PMC7861333
- DOI: 10.3389/frai.2020.00041
Forecasting and Evaluating Multiple Interventions for COVID-19 Worldwide
Abstract
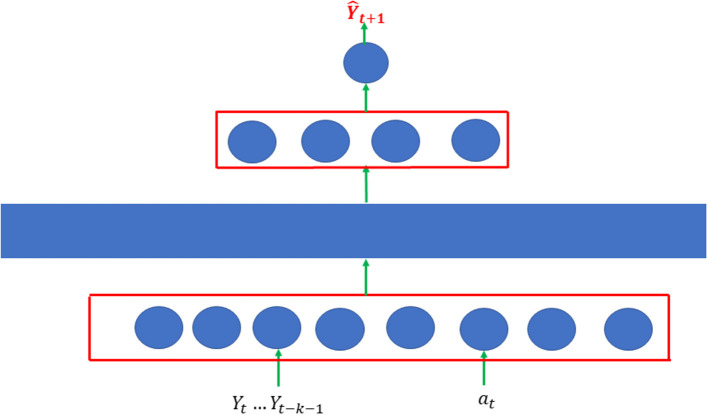
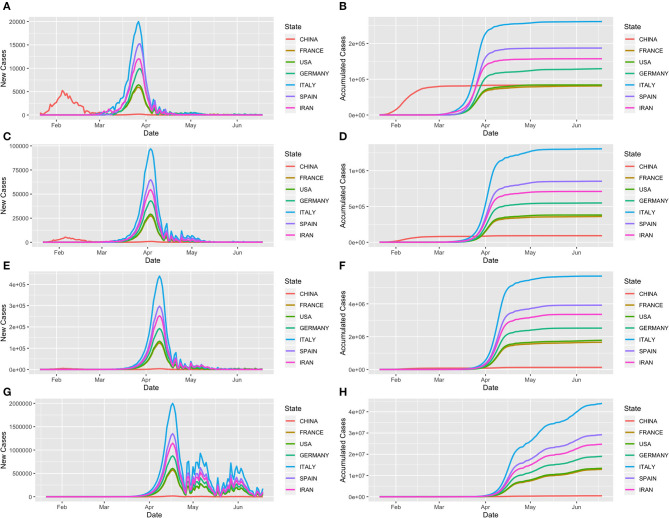
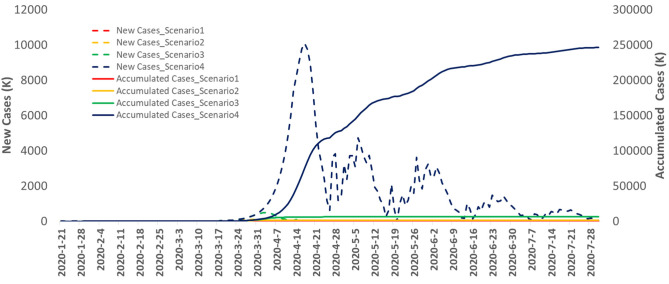
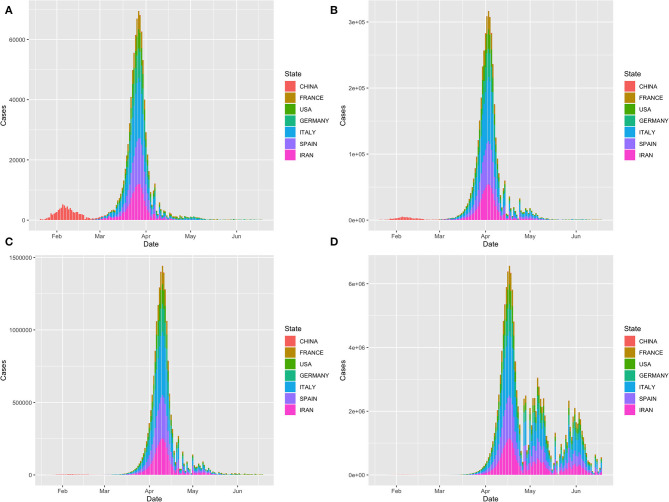
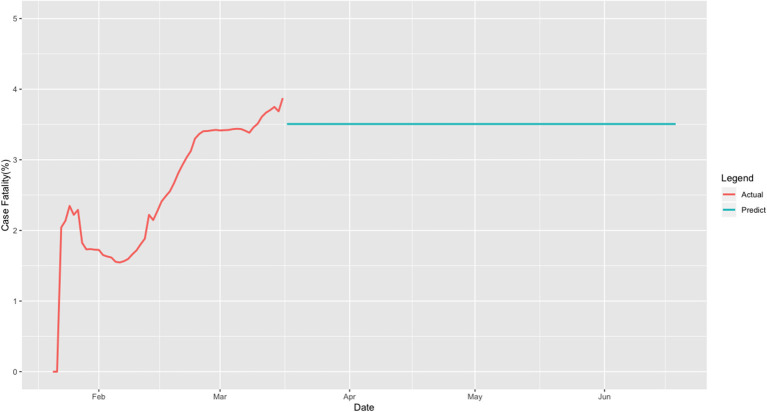
As the Covid-19 pandemic surges around the world, questions arise about the number of global cases at the pandemic's peak, the length of the pandemic before receding, and the timing of intervention strategies to significantly stop the spread of Covid-19. We have developed artificial intelligence (AI)-inspired methods for modeling the transmission dynamics of the epidemics and evaluating interventions to curb the spread and impact of COVID-19. The developed methods were applied to the surveillance data of cumulative and new COVID-19 cases and deaths reported by WHO as of March 16th, 2020. Both the timing and the degree of intervention were evaluated. The average error of five-step ahead forecasting was 2.5%. The total peak number of cumulative cases, new cases, and the maximum number of cumulative cases in the world with complete intervention implemented 4 weeks later than the beginning date (March 16th, 2020) reached 75,249,909, 10,086,085, and 255,392,154, respectively. However, the total peak number of cumulative cases, new cases, and the maximum number of cumulative cases in the world with complete intervention after 1 week were reduced to 951,799, 108,853 and 1,530,276, respectively. Duration time of the COVID-19 spread was reduced from 356 days to 232 days between later and earlier interventions. We observed that delaying intervention for 1 month caused the maximum number of cumulative cases reduce by -166.89 times that of earlier complete intervention, and the number of deaths increased from 53,560 to 8,938,725. Earlier and complete intervention is necessary to stem the tide of COVID-19 infection.
Keywords: COVID-19; artificial intelligence; auto-encoder; forecasting; time series; transmission dynamics.
Copyright © 2020 Hu, Ge, Li, Boerwinkle, Jin and Xiong.
Figures
References
-
- Charte D., Charte F., García S., Jesus M. J. D., Herrera F. (2019). A practical tutorial on autoencoders for nonlinear feature fusion: taxonomy, models, software and guidelines. Informat. Fusion. 44, 78–96. 10.1016/j.inffus.2017.12.007 - DOI
-
- Hellewell J., Abbott S., Gimma A., Bosse N. I., Jarvis C. I., Russell T. W., et al. (2020). Centre for the Mathematical Modelling of Infectious Diseases COVID-19 Working Group, Funk S1, Eggo RM2. Feasibility of controlling COVID-19 outbreaks by isolation of cases and contacts. Lancet Glob Health 8, e488–e496. 10.1016/S2214-109X(20)30074-7 - DOI - PMC - PubMed
LinkOut - more resources
Full Text Sources
Research Materials