

Q-Finder: An Algorithm for Credible Subgroup Discovery in Clinical Data Analysis - An Application to the International Diabetes Management Practice Study
- PMID: 33733209
- PMCID: PMC7861304
- DOI: 10.3389/frai.2020.559927
Q-Finder: An Algorithm for Credible Subgroup Discovery in Clinical Data Analysis - An Application to the International Diabetes Management Practice Study
Abstract
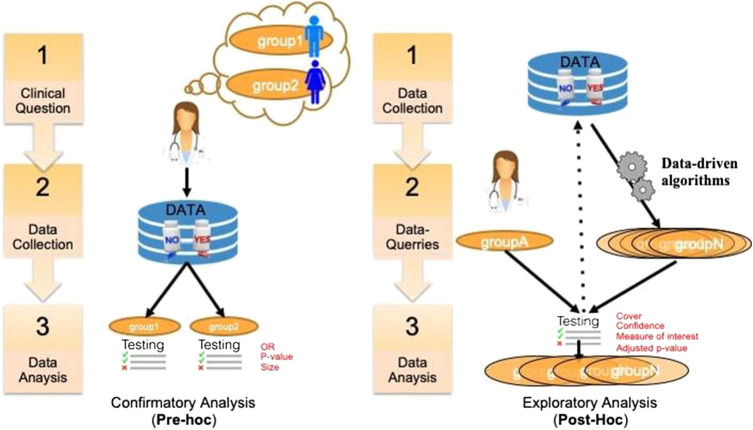
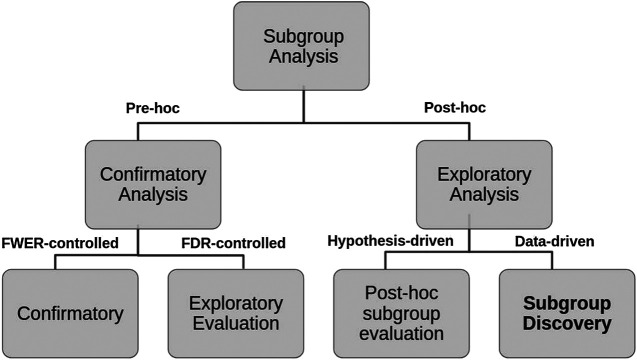
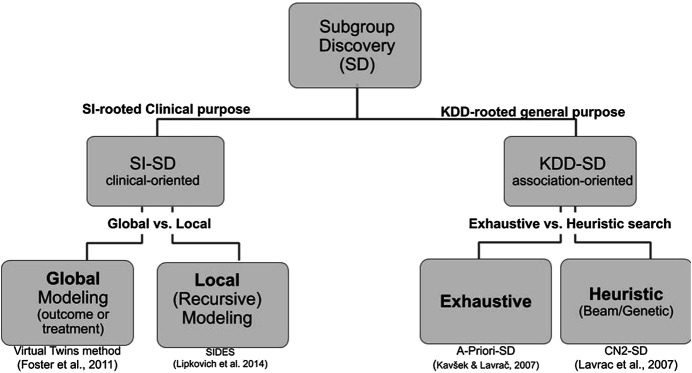
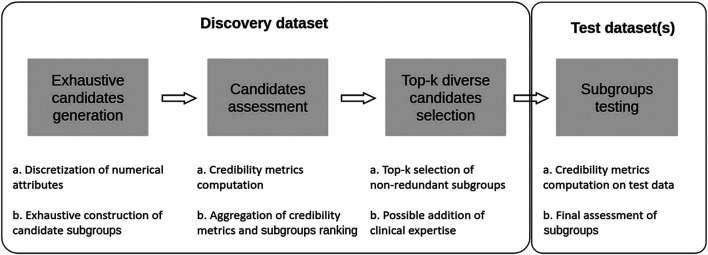
Addressing the heterogeneity of both the outcome of a disease and the treatment response to an intervention is a mandatory pathway for regulatory approval of medicines. In randomized clinical trials (RCTs), confirmatory subgroup analyses focus on the assessment of drugs in predefined subgroups, while exploratory ones allow a posteriori the identification of subsets of patients who respond differently. Within the latter area, subgroup discovery (SD) data mining approach is widely used-particularly in precision medicine-to evaluate treatment effect across different groups of patients from various data sources (be it from clinical trials or real-world data). However, both the limited consideration by standard SD algorithms of recommended criteria to define credible subgroups and the lack of statistical power of the findings after correcting for multiple testing hinder the generation of hypothesis and their acceptance by healthcare authorities and practitioners. In this paper, we present the Q-Finder algorithm that aims to generate statistically credible subgroups to answer clinical questions, such as finding drivers of natural disease progression or treatment response. It combines an exhaustive search with a cascade of filters based on metrics assessing key credibility criteria, including relative risk reduction assessment, adjustment on confounding factors, individual feature's contribution to the subgroup's effect, interaction tests for assessing between-subgroup treatment effect interactions and tests adjustment (multiple testing). This allows Q-Finder to directly target and assess subgroups on recommended credibility criteria. The top-k credible subgroups are then selected, while accounting for subgroups' diversity and, possibly, clinical relevance. Those subgroups are tested on independent data to assess their consistency across databases, while preserving statistical power by limiting the number of tests. To illustrate this algorithm, we applied it on the database of the International Diabetes Management Practice Study (IDMPS) to better understand the drivers of improved glycemic control and rate of episodes of hypoglycemia in type 2 diabetics patients. We compared Q-Finder with state-of-the-art approaches from both Subgroup Identification and Knowledge Discovery in Databases literature. The results demonstrate its ability to identify and support a short list of highly credible and diverse data-driven subgroups for both prognostic and predictive tasks.
Keywords: IDMPS; credibility criteria; exploratory subgroup analysis; hypothesis generation; precision medicine; predictive factor; prognostic factor; subgroup discovery.
Copyright © 2020 Esnault, Gadonna, Queyrel, Templier and Zucker.
Conflict of interest statement
The authors declare the following competing interests. Employment: CE, MG, MQ, and AT are employed by Quinten. Financial support: The development of Q-Finder has been fully funded by Quinten. This article has been funded by Quinten with the help of Sanofi who provided the dataset, and contributed to the revisions.
Figures
References
LinkOut - more resources
Full Text Sources
Other Literature Sources