. 2021 Jul;14(7):e202000377.
doi: 10.1002/jbio.202000377. Epub 2021 Apr 10.

A computationally efficient Monte-Carlo model for biomedical Raman spectroscopy

Affiliations

A computationally efficient Monte-Carlo model for biomedical Raman spectroscopy

Alexander P Dumont et al. J Biophotonics. 2021 Jul.

Abstract

Monte Carlo (MC) modeling is a valuable tool to gain fundamental understanding of light-tissue interactions, provide guidance and assessment to optical instrument designs, and help analyze experimental data. It has been a major challenge to efficiently extend MC towards modeling of bulk-tissue Raman spectroscopy (RS) due to the wide spectral range, relatively sharp spectral features, and presence of background autofluorescence. Here, we report a computationally efficient MC approach for RS by adapting the massively-parallel Monte Carlo eXtreme (MCX) simulator. Simulation efficiency is achieved through "isoweight," a novel approach that combines the statistical generation of Raman scattered and Fluorescence emission with a lookup-table-based technique well-suited for parallelization. The MC model uses a graphics processor to produce dense Raman and fluorescence spectra over a range of 800 - 2000 cm-1 with an approximately 100× increase in speed over prior RS Monte Carlo methods. The simulated RS signals are compared against experimentally collected spectra from gelatin phantoms, showing a strong correlation.

Keywords: GPU; Monte Carlo method; Raman spectroscopy; parallel computing.


Figures

FIGURE 1
FIGURE 1
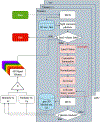
Flowchart depicting the pipeline for running the RS MC model. Excitation photons are propagated through the standard MCX to generate a 3D excitation flux distribution. The excitation distribution informs the “isoweight” calculation, depicted in Figure 2, which generates emission photons that are then propagated through MCX to create a generalized emission distribution. The emission distribution is multiplied by separate Raman(κR(λ)) and Fluorescence(κF(λ)) coefficients, resulting in the final model output.
FIGURE 2
FIGURE 2
(a) 3D excitation flux for a 2-label sample (b) 1D serialized representation of the entire 3D excitation flux volume separated by label (blue, label 1; red, label 2) and the corresponding normalized cumulative summation of the volume flattened excitation flux. (c) The inverse of the normalized cumulative flux is bound on the x-axis between 0 to 1 inclusive, which can then be queried by a randomly generated number ϵ. An example of the left-hand binary search is shown, where a value of ϵ is transformed into a label index, and then mapped to a position within the 3D tissue model at which a new emission photon is launched and propagated via the regular MCX platform.
FIGURE 3
FIGURE 3
(a) A schematic of the Raman probe used to capture signals experimentally.(b) A schematic showing an HAP capsule embedded in gelatin as used in simulations. (c) Empirical measurements of Raman coefficients for HAP powder and gelatin mixture.
FIGURE 4
FIGURE 4
(a) Experimental RS signals at three inclusion depths. (b) Simulated signal at the matching depths. (c) Correlation between experimental and simulated at the several prominent peaks related to HAP and gelatin phantoms.
FIGURE 5
FIGURE 5
(a) Experimental RS signals for three relative concentrations of HAP/dry gelatin powder. (b) Simulated Raman signals at the matching concentrations. (c) Correlation between experimental and simulated for the selected peaks.Points corresponding to 33,50, and 66 percent relative HAP concentration are labelled for phosphate v1PO43 and carbonate v1CO32 only for clarity. While phosphate peaks increase with HAP concentration, all other peaks, which are more prominent in gelatin, decrease.
FIGURE 6
FIGURE 6
(a) Experimentally captured net signal (background not removed) for two different flavored gelatin phantoms (b) Simulated net signal (Fluorescence + Raman) for the same two flavors. (c) Correlation of all peaks from the simulated space compared to the experimental, showing a high level of agreement. The R2 for strawberry experimental vs. modeled over the 201 data samples was 0.9831, and the R2 for cherry flavor was 0.9920.

References

    1. Wang Lihong, Jacques Steven L, Zheng Liqiong, Computer methods and programs in biomedicine 1995,47 (2), 131–146. - PubMed
    1. Zhu Caigang, Liu Quan, Journal of biomedical optics 2013,18 (5), 050902. - PubMed
    1. Periyasamy V, Pramanik M, IEEE Reviews in Biomedical Engineering 2017, 10, 122–135. - PubMed
    1. Fang Qianqian, Boas David A, Optics express 2009, 17 (22), 20178–20190. - PMC - PubMed
    1. Alerstam Erik, Svensson Tomas, Andersson-Engels Stefan, Journal of biomedical optics 2008, 13 (6), 060504. - PubMed

Publication types

LinkOut - more resources