. 2021 May;13(3):479-497.
doi: 10.4168/aair.2021.13.3.479.

ATP6V0d2 Suppresses Alveoli Macrophage Alternative Polarization and Allergic Asthma via Degradation of PU.1

Affiliations

ATP6V0d2 Suppresses Alveoli Macrophage Alternative Polarization and Allergic Asthma via Degradation of PU.1

Na Liu et al. Allergy Asthma Immunol Res. 2021 May.

Abstract

Purpose: Macrophages are important regulators of environmental allergen-induced airway inflammation and asthma. ATP6V0d2 is a subunit of vacuolar ATPase highly expressed in macrophages. However, the functions of ATP6V0d2 in the regulation of pathogenesis of allergic asthma remain unclear. The aim of this study is to determine the function and related molecular mechanisms of macrophage protein ATP6V0d2 in allergic asthma.

Methods: We compared the disease severity between female C57BL/6 wild-type and ATP6V0d2-/- mice in an ovalbumin (OVA)-induced asthma model. We also investigated the association of expression of ATP6V0d2, PU.1 and CCL17 with disease severity among asthmatic patients.

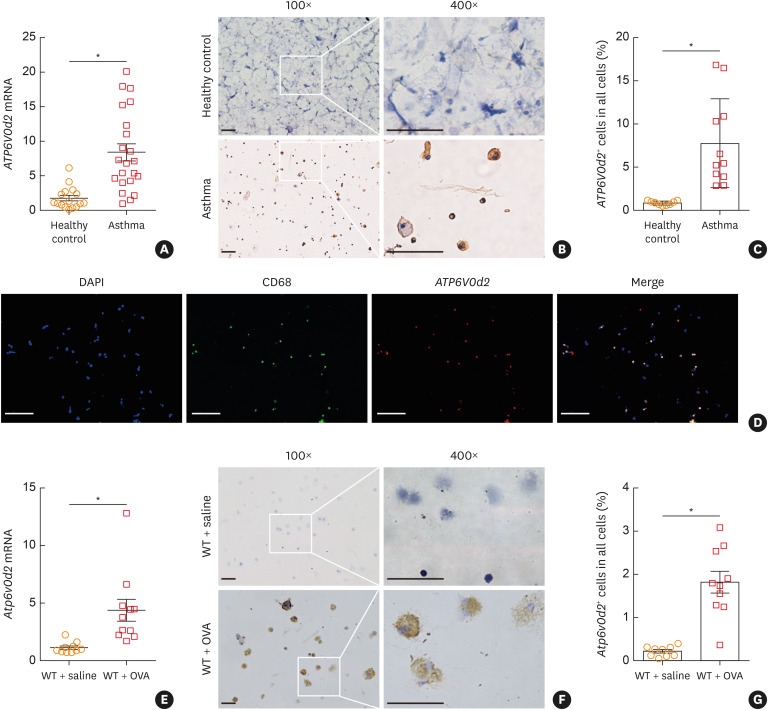
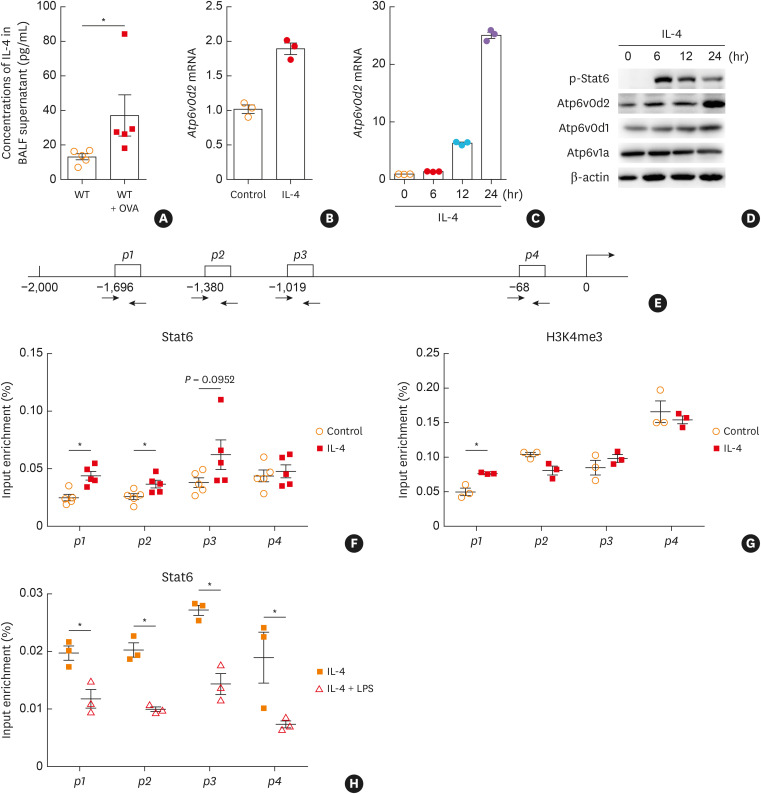
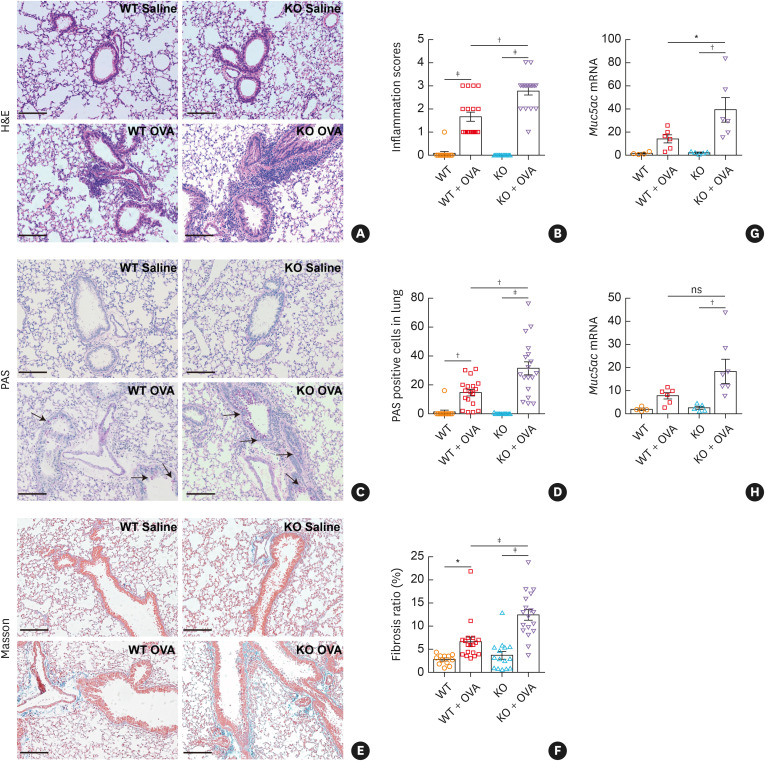
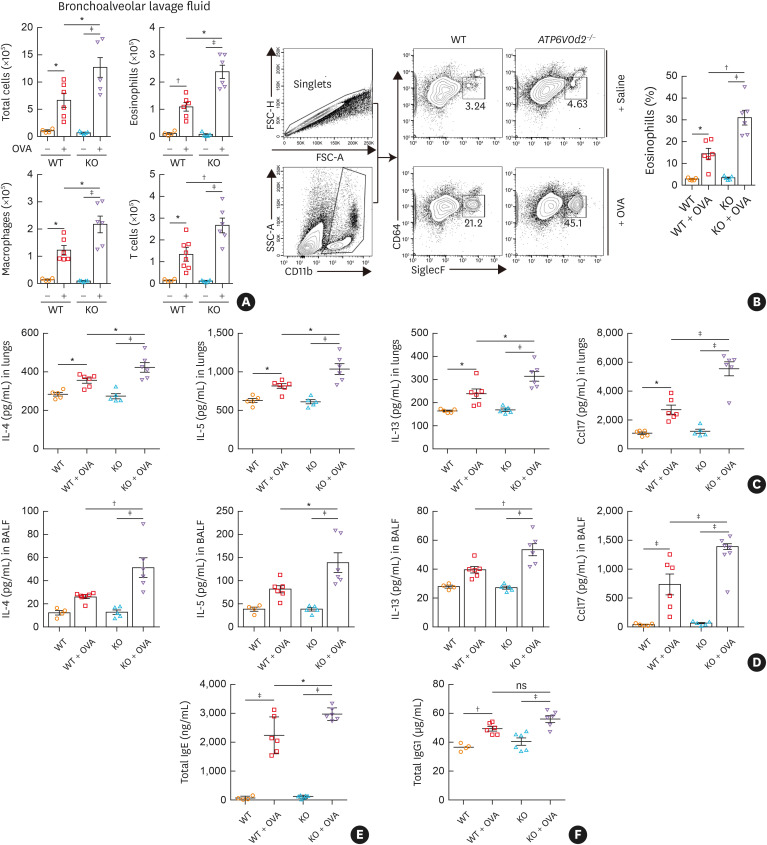
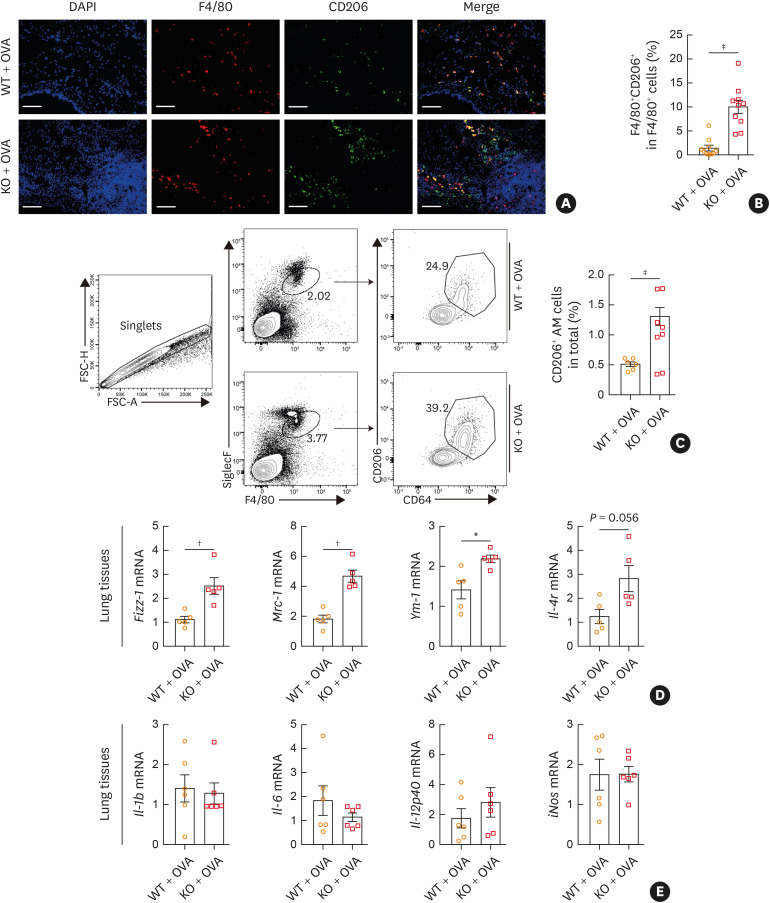
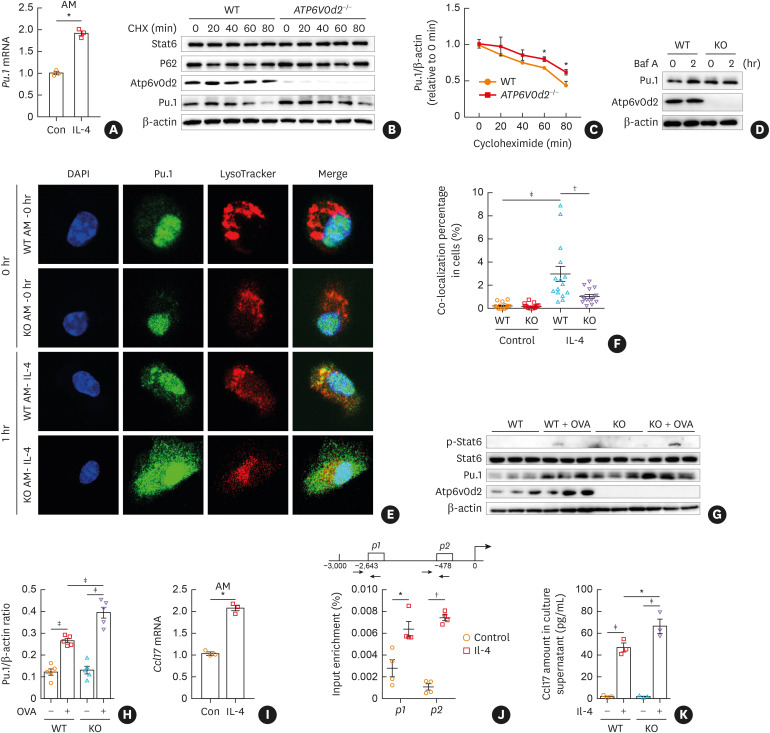
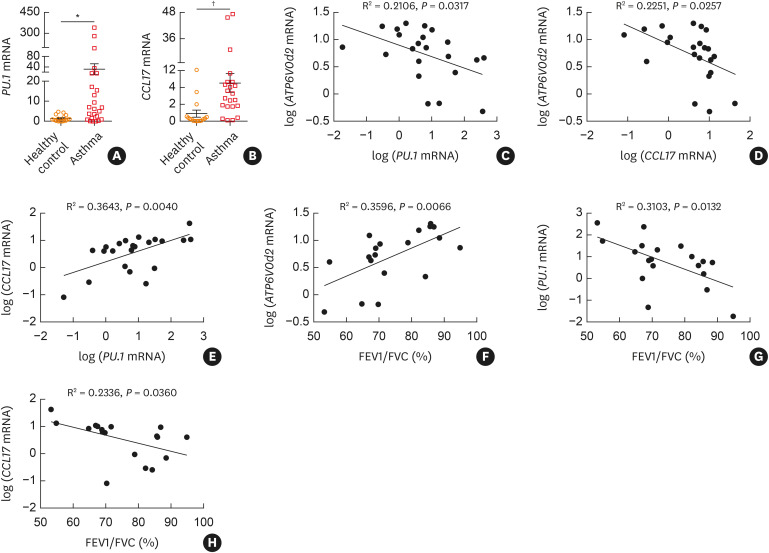
Results: The expression of ATP6V0d2 in sputum cells of asthmatic patients and in the lungs of OVA-challenged mice was enhanced compared to healthy subjects and their counterparts, respectively. However, ATP6V0d2-deficient mice exaggerated inflammatory cell infiltration as well as enhanced alternative activated macrophage (AAM) polarization and mucus production in an OVA-induced asthma model. Furthermore, we found that Atp6v0d2 promoted lysosomal degradation of Pu.1, which induced AAM polarization and Ccl17 production. Among asthma patients, ATP6V0d2 expression was inversely associated with disease severity, whereas PU.1 and CCL17 expression was positively associated with disease severity.

Conclusions: Our results identify macrophage Atp6v0d2, as an induced feedback inhibitor of asthma disease severity by promoting Pu.1 lysosomal degradation, which may in turn leads to reduced AAM polarization and Ccl17 production.

Keywords: Asthma; Pu.1 protein; V-type ATPase; alveolar macrophage.


Conflict of interest statement

There are no financial or other issues that might lead to conflict of interest.

Figures

Fig. 1
Fig. 1. ATP6V0d2 expression is increased in the sputum cells of asthmatic patients and in the lung tissues and BALF cells of OVA-challenged mice. (A) qPCR analysis of ATP6V0d2 expression in sputum samples from asthmatic patients (n = 22) and healthy controls (n = 16). (B, C) A representative image of IHC analysis of ATP6V0d2 in the sputum samples from healthy donors and asthmatic patients as well as quantification of the percentages of ATP6V0d2-positive cells in each sputum sample in healthy controls and asthmatic patients. (D) Immunofluorescence staining of isolated sputum cells from asthmatic patients' saliva with DAPI (blue), anti-CD68 (green), and anti-ATP6V0d2 (red). (E) The expression of Atp6v0d2 in the lungs of mice after OVA sensitization (n = 10–11). (F, G) A representative image of IHC analysis of Atp6v0d2 in the BALF between WT mice and OVA-induced mice and the percentages of Atp6v0d2-positive cells in BALF cells sample were analyzed (scale bar: 100 µm). The percentage of ATP6V0d2 in sputum samples from human (n = 9–11) or in BALF from mice (n = 9–10) was analyzed by ImageJ software, and the mean value of 3 image fields per slides was plotted. Data are shown as the ratio compared to Gapdh or β-ACTIN to 2−ΔCt for mRNA levels. Data were assessed by the Mann-Whitney U test and are presented as mean ± standard error of the mean.
BALF, bronchoalveolar lavage fluid; OVA, ovalbumin; qPCR, quantitative polymerase chain reaction; IHC, immunohistochemistry; DAPI, 4',6-diamidino-2-phenylindole; WT, wild-type. *P < 0.001.
Fig. 2
Fig. 2. ATP6V0d2 expression is induced by IL-4 through activation of Stat6 in macrophages. (A) IL-4 concentrations were measured in control animals and OVA-treated mice. (B) BALF cells isolated form control mice were stimulated with IL-4 (20 ng/mL) for 3 hours and the expression of Atp6v0d2 was detected by qPCR. (C) Macrophages were stimulated with IL-4 (20 ng/mL) for the indicated time and the expression of Atp6v0d2 was determined by qPCR. (D) Immunoblotting of p-Stat6, Atp6v0d2, Atp6v0d1 and Atp6v1a in macrophages stimulated with IL-4 (20 ng/mL) for the indicated time. (E) Schematic representation showing primers used for the CHIP analysis. (F, G) Chromatin immunoprecipitation analysis of Stat6 and H3K4me3 occupancy to the Atp6v0d2 locus in macrophages that were stimulated with IL-4 for 2 hours. Precipitated DNA was amplified by qPCR for primer sites p1p4 and results were presented relative to input DNA. (H) Chromatin immunoprecipitation analysis for Stat6 occupancy to the Atp6v0d2 locus in macrophages that were stimulated with IL-4 plus LPS (100 ng/mL) for 2 hours. Data are representative of 3 independent experiments. Data were assessed by unpaired Student's t-test and are presented as mean ± standard error of the mean.
OVA, ovalbumin; BALF, bronchoalveolar lavage fluid; qPCR, quantitative polymerase chain reaction; LPS, lipopolysaccharide. *P < 0.05; P < 0.01; P < 0.001.
Fig. 3
Fig. 3. ATP6V0d2-deficient mice were more susceptible to OVA-induced asthma. (A, B) Hematoxylin and eosin staining of lung tissues in WT and ATP6V0d2−/− mice after saline or OVA treatment, and the mean scores of inflammation were analyzed. (C, D) PAS staining on lung tissues in WT and ATP6V0d2−/− mice after saline or OVA treatment and the PAS-positive cells were counted. (E, F) Masson trichrome staining of lung tissues in WT and ATP6V0d2−/− mice after saline or OVA treatment, and the positive areas were quantified. (G, H) qRCR analysis of muc5ac and muc5b in the lung tissues from WT and ATP6V0d2−/− mice after saline or OVA treatment (scale bar: 100 µm). Data are representative of 2 independent experiments, and shown as the ratio compared to Gapdh to 2−ΔCt for mRNA levels. Quantification was analyzed for 3 randomly selected visual fields per slide (n = 4–6). Data were assessed by one-way analysis of variance with Turkey's test and are presented as mean ± standard error of the mean.
OVA, ovalbumin; WT, wild-type; PAS, Periodic acid-Schiff; qPCR, quantitative polymerase chain reaction; KO, knockout. *P < 0.05; P < 0.01; P < 0.001.
Fig. 4
Fig. 4. Deletion of Atp6v0d2 exacerbated lung inflammation and elevated production of inflammatory mediators upon asthma induction. (A) Numbers of total cells or different types of immune cells, including eosinophils, macrophages, and T cells, in BALF of saline or OVA-treated WT and ATP6V0d2−/− mice. (B) Flow cytometry analysis eosinophils in the lungs from WT and ATP6V0d2−/− mice after saline or OVA treatment. (C, D) The levels of IL-4, IL-5, IL-13 and Ccl17 in the lungs and BALF, respectively, were determined by ELISA (n = 4–6). (E, F) Serum levels of total IgE and IgG1were determined in WT and ATP6V0d2−/− mice treated with saline or OVA using ELISA (n = 4-6). Data are representative of 2 independent experiments. Data were assessed by one-way analysis of variance with Turkey's test and are presented as mean ± standard error of the mean.
BALF, bronchoalveolar lavage fluid; OVA, ovalbumin; WT, wild-type; ELISA, enzyme-linked immunosorbent assay; Ig, immunoglobulin; KO, knockout. *P < 0.05; P < 0.01; P < 0.001.
Fig. 5
Fig. 5. ATP6V0d2-deficiency enhanced AAM polarization in the OVA asthma model. (A, B) Whole-mount immunofluorescence staining of DAPI (blue), F4/80 (red), and CD206 (green) in the lung tissues of WT and ATP6V0d2−/− mice treated with OVA and the percentages of F4/80+CD206+ among F4/80+ were quantified with 2 randomly selected visual fields per slide (n = 5). (C) Flow cytometry analysis of singlets, SiglecF+F4/80+, and CD206+CD64+ cells in lungs from OVA-challenged WT and ATP6V0d2−/− mice and histogram plots of percentages of CD206+CD64+ alveolar macrophages among total cells. (D, E) Expression of AAM-related markers (Fizz-1, Mrc-1, Ym-1, and Il-4r) and CAM-related markers (Il-1b, Il-6, Il-12p40 and iNos) in lungs from OVA-treated WT and ATP6V0d2−/− mice was determined by qPCR (n = 4–6) (scale bar: 100 µm). Data are representative of 2 independent experiments and shown as the ratio compared to Gapdh to 2ΔCt for mRNA levels. Data were assessed by the Mann-Whitney U test and are presented as mean ± standard error of the mean.
AAM, alternative activated macrophage; OVA, ovalbumin; DAPI, 4',6-diamidino-2-phenylindole; WT, wild-type; CAM, classic activated macrophage; qPCR, quantitative polymerase chain reaction; KO, knockout. *P < 0.05; P < 0.01; P < 0.001.
Fig. 6
Fig. 6. Deletion of Atp6v0d2 led to Pu.1 accumulation that promotes Ccl17 production. (A) BALF cells isolated from control mice were stimulated with IL-4 (20 ng/mL) for 3 hours and the expression of Pu.1 was determined by qPCR. (B, C) Immunoblotting of Stat6, P62, Pu.1 and Atp6v0d2 in WT and ATP6V0d2−/− BMDMs that were incubated with cycloheximide (100 µg/mL) for the indicated time and band intensities relative to β-actin were plotted. (D) WT and ATP6V0d2−/− BMDMs were untreated or treated with bafilomycin A (100 nM) for 2 hours. The amounts of Pu.1 and Atp6v0d2 were determined by immunoblotting. (E, F) BALF cells from control mice were treated with or without IL-4 (20 ng/mL) for 1 hour. Cells were stained with anti-Pu.1 (green) and LysoTracker (red); and percentages of Pu.1 co-localized with LysoTracker among PU.1-positive cells were quantified. Fifteen randomly visual fields were chosen for quantification. (G, H) Immunoblotting of p-Stat6, Stat6, Pu.1 and Atp6v0d2 in lungs from OVA-challenged WT and ATP6V0d2−/− mice and the band intensities relative to β-actin were quantified. (I) BALF cells isolated from control mice were stimulated with IL-4 (20 ng/mL) for 3 hours and the expression of Ccl17 was determined by qPCR. (J) Schematic presentation of the Ccl17 locus and primers location. The amounts of Pu.1 bound to the Ccl17 in unstimulated or Il-4 (20 ng/mL, 2h) stimulated WT and ATP6V0d2−/− BMDMs were determined by chromatin immunoprecipitation. (K) WT and Atp6v0d2−/− BMDMs were stimulated with IL-4 (20 ng/mL) for 48 hours; the amounts of Ccl17 secreted in the supernatants were determined by enzyme-linked immunosorbent assay. Data are representative of 3 independent experiments. Data were assessed by one-way analysis of variance with Turkey's test (F, H, and K) and unpaired Student's t test (A, C and I), and are presented as mean ± standard error of the mean.
BALF, bronchoalveolar lavage fluid; qPCR, quantitative polymerase chain reaction; WT, wild-type; BMDM, bone marrow-derived macrophage; KO, knockout. *P < 0.05; P < 0.01; P < 0.001.
Fig. 7
Fig. 7. Data were assessed by one-way ANOVA with Turkey's test (F, H, and K) and unpaired Student's t-test (A, C and I), and are presented as mean ± SEM. Expression in induced sputum from patients was inversely associated with the severity of asthma. (A, B) qRCR analysis of PU.1 and CCL17 expression in sputum samples from healthy subjects (n = 16) and asthma patients (n = 22). (C-E) Pearson correlation assay for expression of ATP6V0d2 versus PU.1. Data were assessed by one-way ANOVA with Turkey's test (F, H, and K) and unpaired Student's t-test (A, C, and I), and are presented as mean ± SEM. CCL17 and PU.1 versus CCL17 in sputum cells from asthma patients. (F-H) Correlation analysis of FEV1/FVC ratio versus expression of ATP6V0d2, PU.1 and CCL17 in sputum cells from asthmatic patients. Data were assessed by Mann-Whitney U test (A, B) and Pearson correlation test (C-G). Data are presented as mean ± SEM.
ANOVA, analysis of variance; SEM, standard error of the mean; FEV1, forced expiratory volume in 1 second; FVC, forced vital capacity. *P < 0.05; P < 0.01.

Similar articles

Cited by

References

    1. Lambrecht BN, Hammad H. The immunology of asthma. Nat Immunol. 2015;16:45–56. - PubMed
    1. Mukherjee M, Nair P. Autoimmune responses in severe asthma. Allergy Asthma Immunol Res. 2018;10:428–447. - PMC - PubMed
    1. Byrne AJ, Mathie SA, Gregory LG, Lloyd CM. Pulmonary macrophages: key players in the innate defence of the airways. Thorax. 2015;70:1189–1196. - PubMed
    1. Fricker M, Gibson PG. Macrophage dysfunction in the pathogenesis and treatment of asthma. Eur Respir J. 2017;50:1700196. - PubMed
    1. Zasłona Z, Przybranowski S, Wilke C, van Rooijen N, Teitz-Tennenbaum S, Osterholzer JJ, et al. Resident alveolar macrophages suppress, whereas recruited monocytes promote, allergic lung inflammation in murine models of asthma. J Immunol. 2014;193:4245–4253. - PMC - PubMed