Review
. 2021 Oct 1;101(4):1561-1607.
doi: 10.1152/physrev.00040.2020. Epub 2021 Mar 18.

Energy metabolism design of the striated muscle cell

Affiliations
Review

Energy metabolism design of the striated muscle cell

Brian Glancy et al. Physiol Rev. .

Abstract

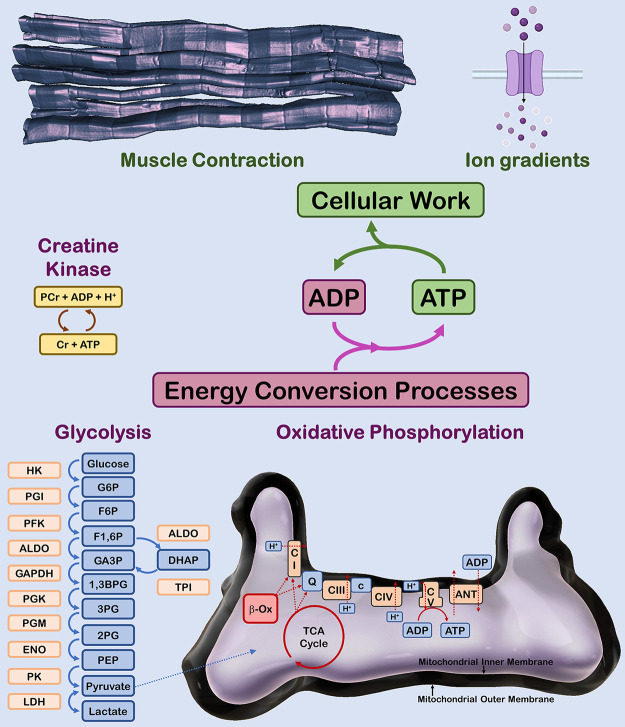
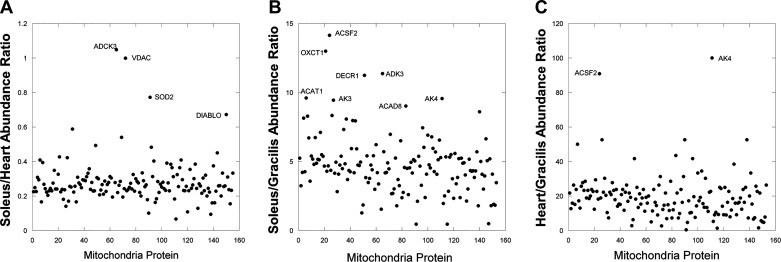
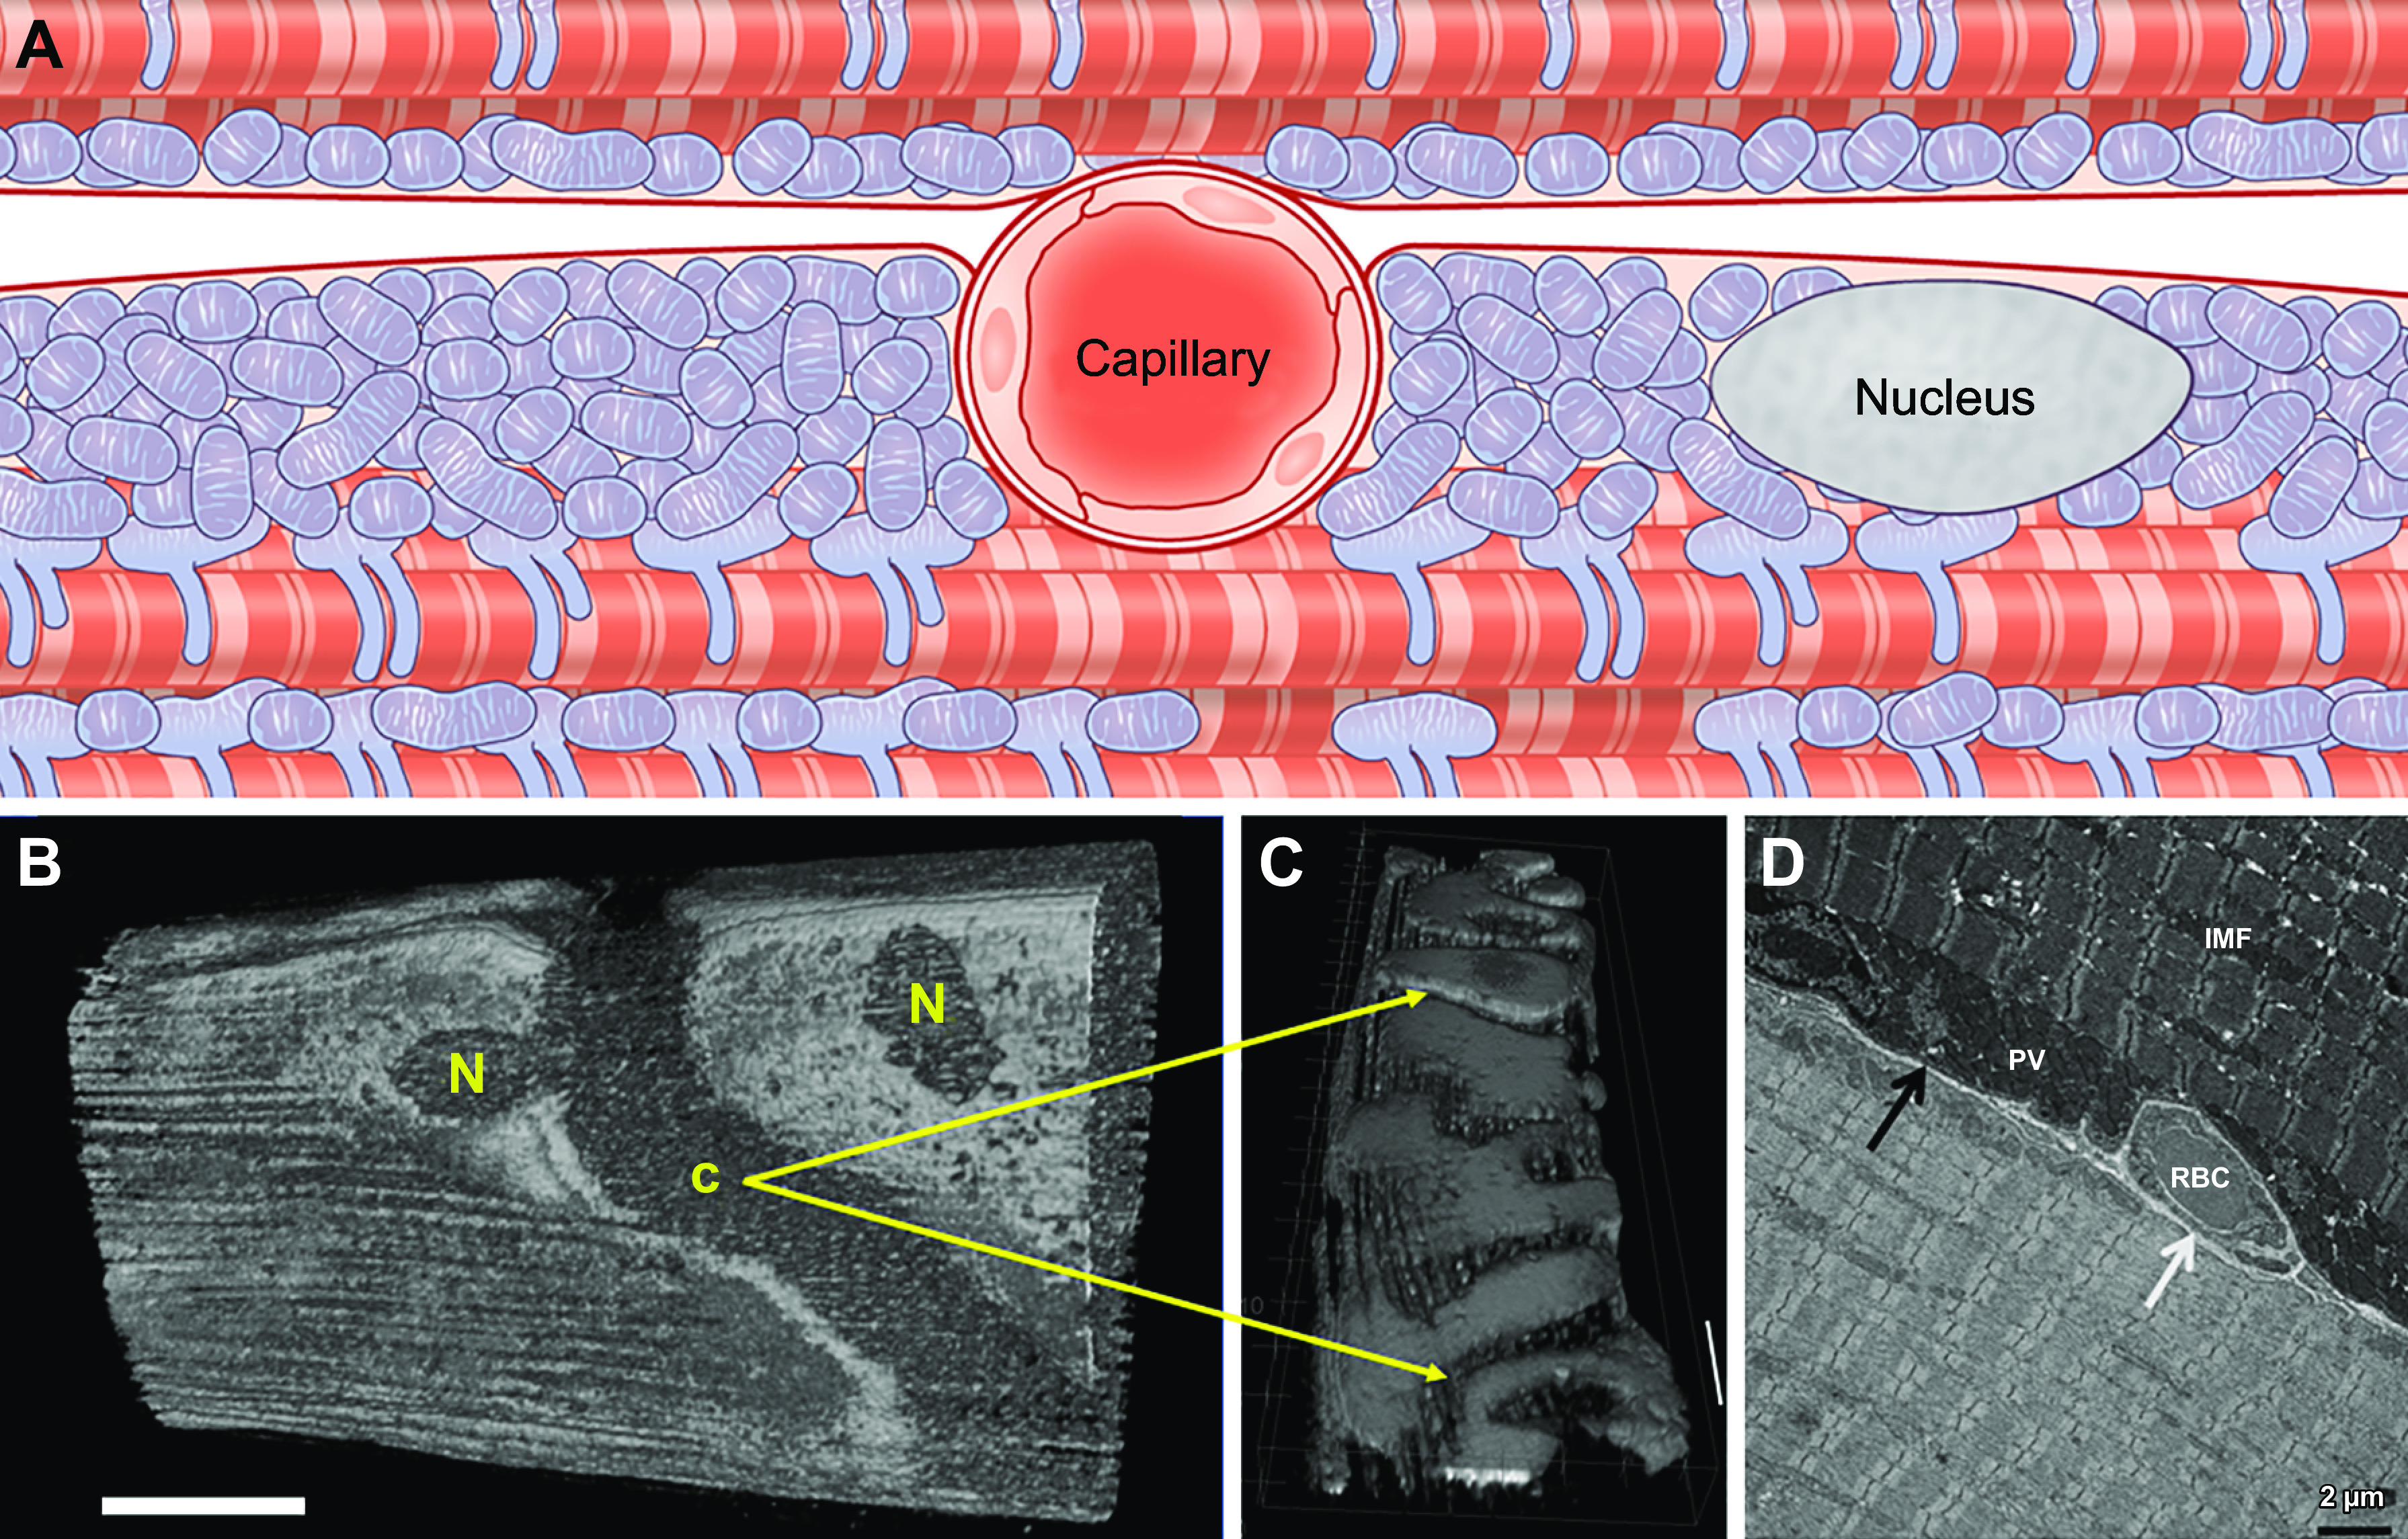
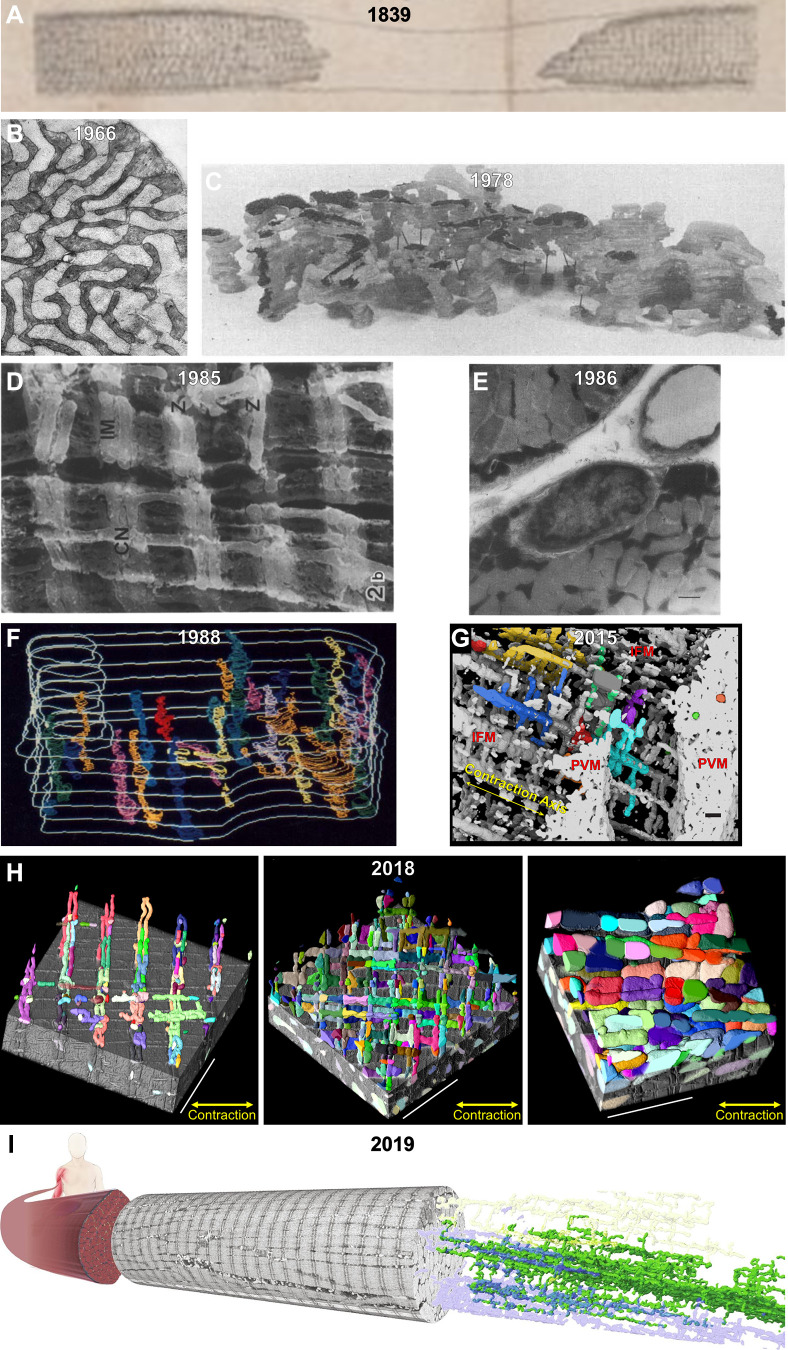
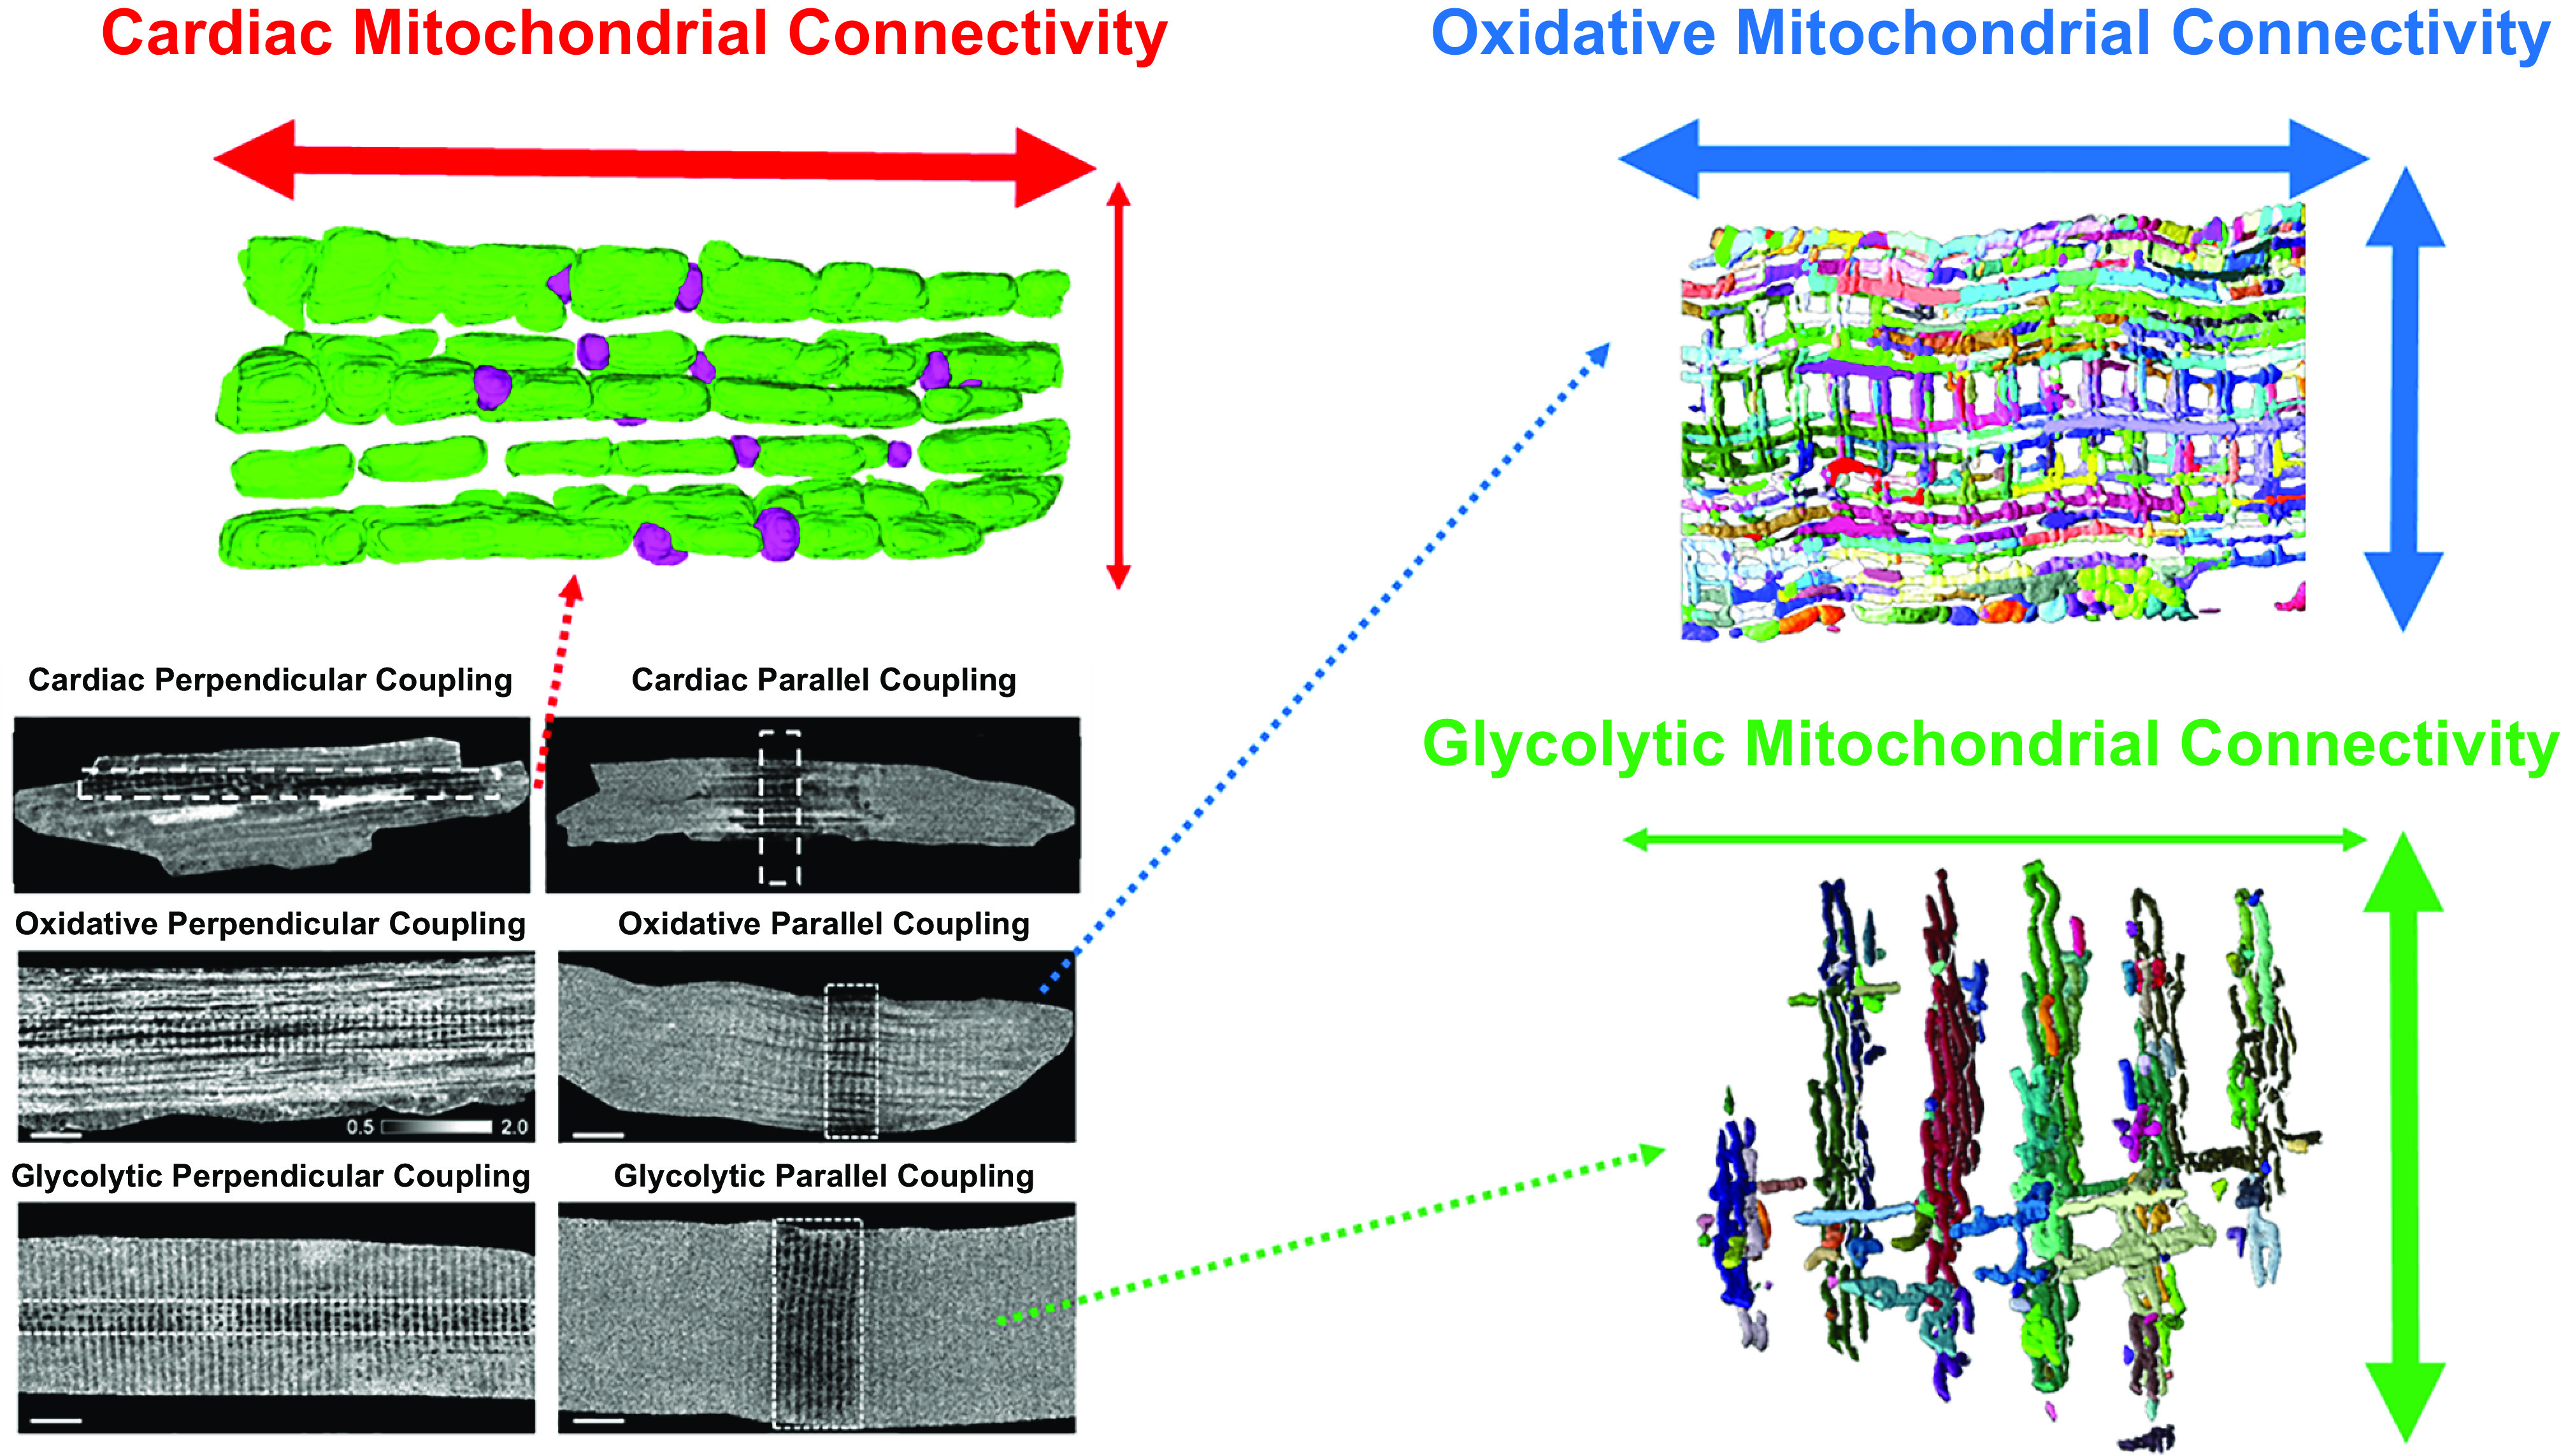
The design of the energy metabolism system in striated muscle remains a major area of investigation. Here, we review our current understanding and emerging hypotheses regarding the metabolic support of muscle contraction. Maintenance of ATP free energy, so called energy homeostasis, via mitochondrial oxidative phosphorylation is critical to sustained contractile activity, and this major design criterion is the focus of this review. Cell volume invested in mitochondria reduces the space available for generating contractile force, and this spatial balance between mitochondria acontractile elements to meet the varying sustained power demands across muscle types is another important design criterion. This is accomplished with remarkably similar mass-specific mitochondrial protein composition across muscle types, implying that it is the organization of mitochondria within the muscle cell that is critical to supporting sustained muscle function. Beyond the production of ATP, ubiquitous distribution of ATPases throughout the muscle requires rapid distribution of potential energy across these large cells. Distribution of potential energy has long been thought to occur primarily through facilitated metabolite diffusion, but recent analysis has questioned the importance of this process under normal physiological conditions. Recent structural and functional studies have supported the hypothesis that the mitochondrial reticulum provides a rapid energy distribution system via the conduction of the mitochondrial membrane potential to maintain metabolic homeostasis during contractile activity. We extensively review this aspect of the energy metabolism design contrasting it with metabolite diffusion models and how mitochondrial structure can play a role in the delivery of energy in the striated muscle.

Keywords: cellular energy distribution; mitochondria; mitochondrial networks; mitochondrial reticulum; oxidative phosphorylation.


Conflict of interest statement

No conflicts of interest, financial or otherwise, are declared by the authors.

Figures

None
Graphical abstract
FIGURE 1.
FIGURE 1.
Major adenosine triphosphate (ATP) production and utilization processes in striated muscle. Muscle contraction and maintenance of ion gradients across membranes are the major ATP utilizing work processes in striated muscle cells. Metabolic homeostasis is maintained by ATP production through the creatine kinase, glycolysis, and oxidative phosphorylation energy conversion processes. PCr, phosphocreatine; Cr, creatine; ADP, adenosine diphosphate; HK, hexokinase; PGI, phosphoglucose isomerase; PFK, phosphofructokinase; ALDO, aldolase; GAPDH, glyceraldehyde 3-phosphate dehydrogenase; TPI, triose phosphate isomerase; PGK, phosphoglycerate kinase; PGM, phosphoglycerate mutase; ENO, enolase; PK, pyruvate kinase; LDH, lactate dehydrogenase; G6P, glucose 6-phosphate; F6P, fructose 6-phosphate; F1,6BP, fructose 1,6-bisphosphate; GA3P, glyceraldehyde 3-phosphate; DHAP, dihdroxyacetone phosphate; 1,3BPG, 1,3-bisphosphoglycerate; 3PG, 3-phosphoglycerate; 2PG, 2-phosphoglycerate; PEP, phosphoenolpyruvate; β-Ox, fatty acid β-oxidation; TCA, tricarboxylic; CI, complex I (NADH dehydrogenase); Q, ubiqinone; CIII, complex III (ubiquinol-cytochrome c reductase); c, cytochrome c; CIV, complex IV (cytochrome oxidase); CV, complex V (ATP synthase); ANT, adenine nucleotide translocase.
FIGURE 2.
FIGURE 2.
Mitochondrial protein composition is remarkably similar across striated muscle types. Ratio of mitochondrial protein contents normalized to total protein content between tissues from whole muscle mass spectroscopy data. One-hundred fifty-two of the highest abundant proteins are plotted with labels applied to the proteins with large increases beyond the mean. All proteins are identified along with tabulated data in Supplemental Table S1. A: soleus muscle vs. heart. B: soleus vs. gracilis. C: heart vs. gracilis.
FIGURE 3.
FIGURE 3.
Capillary embedding within sarcolemmal grooves provides additional control over oxygen delivery capacity to specific muscle cells. A: schematic figure of a capillary located between a glycolytic (top) and oxidative (bottom) muscle fiber. Mitochondria and nuclei locate laterally to the capillary sitting in a sarcolemmal groove and increasing surface area contact with the oxidative fiber. Adapted from Ref. . B: 3-dimensional (3-D) rendering of mitochondrial structure in an intact Tibialis anterior muscle cell showing voids where capillary grooves (C) and nuclei (N) are located. Adapted from Ref. . C: 3-D rendering of mitochondrial structure in an isolated, live soleus muscle fiber. Grooves in the sarcolemma remain even after removal of capillaries through collagenase digestion. Adapted from Ref. . D: transmission electron microscopy image of a capillary (white arrow; IMF, intermyofibrillar; PV, paravascular) embedded in a sarcolemmal groove in the upper but not lower muscle fiber. RBC, red blood cells. Adapted from Ref. .
FIGURE 4.
FIGURE 4.
A visual history of muscle mitochondrial reticulum structure. A: interstitial granules within a muscle cell imaged through a light microscope in 1839 (297). B: cross-sectional 2-dimensional image of the mitochondrial reticulum in rat diaphragm oxidative muscle imaged by transmission electron microscopy (TEM) in 1966 (322). C: 3-dimensional (3-D) rendering of the rat diaphragm oxidative muscle mitochondrial reticulum imaged by serial section TEM in 1978 (299). D: scanning electron microscopy (SEM) image of the rat hindlimb oxidative muscle mitochondrial reticulum from 1985 (300). CN, thin mitochondrial column; IM, I-band limited mitochondria; Z, Z-disk. E: high-voltage TEM projection image of rat hindlimb muscle mitochondrial reticulum in 1986 (301). F: 3-D rendering of horse muscle mitochondrial reticulum imaged by serial section TEM in 1988 (302). G: 3-D rendering of the oxidative mouse muscle mitochondrial reticulum imaged by focused ion beam (FIB)-SEM in 2015 (169). H: 3-D renderings of the mitochondrial reticulum in glycolytic (left), oxidative (middle), and cardiac (right) mouse muscles imaged by FIB-SEM in 2018 (303). IFM, intrafibillar mitochondria; PVM, paravascular mitrochondria. I: 3-D rendering of the human oxidative muscle mitochondrial reticulum imaged by FIB-SEM in 2019 (304).
FIGURE 5.
FIGURE 5.
Muscle mitochondrial network protection system. A: schematic of the putative electrical and physical disconnection processes upon localized damage to the muscle mitochondrial reticulum. B and C: 3-dimensional renderings of the connected (green) and disconnected (red) regions of the muscle mitochondrial reticulum upon localized depolarization in a MitoDendra2 mouse muscle fiber and cardiomyocyte, respectively. D: raw membrane potential voltage image from a mouse soleus muscle fiber before depolarization. E: post/preratiometric image of mitochondrial membrane potential voltage immediately after localized depolarization in the middle of cell from D. Dark signal indicates decreased voltage. F: post/preratiometric image of mitochondrial membrane potential voltage 55 s after localized uncoupling showing continued depolarization in the irradiated region and repolarization back to baseline in the adjacent regions. All images adapted from Ref. 167).
FIGURE 6.
FIGURE 6.
Distribution of oxidative phosphorylation complexes in striated muscle cells. A: 3-dimensional rendering of an oxidative skeletal muscle cell cross-section immunostained for complexes IV and V and nuclei (blue). Complex IV and V are present throughout the cell, but complex IV is relatively higher in abundance (green) near the periphery and complex V is relatively higher in abundance (red) in the interior. Adapted from Ref. . B: overlay of the relative complex IV (green) and V (red) distributions on a super-resolution microscopy rendering of a soleus muscle fiber demonstrating the grid-like physical properties of the mitochondrial reticulum. Adapted from (365). C: complex IV (green, left) and complex V (red, middle) distributions in cardiomyocyte cross sections showing homogenous complex IV/V ratios (right) throughout the heart cell. Adapted from Ref. .
FIGURE 7.
FIGURE 7.
Capacity for energy distribution between mitochondria and myofibrils. Top left: 3-dimensional (3-D) rendering of the diffusive energy distribution capacity within the paravascular and intrafibrillar regions of the muscle mitochondrial reticulum. Mitochondria are colored based on the minumum distance to the nearest myofibril. Bottom left: 3-D rendering of the conductive energy distribution capacity within the paravascular and intrafibrillar regions of the muscle mitochondrial reticulum. Mitochondria are colored based on the minimum distance to the nearest myofibril of the closest mitochondria within a connected network. Top right: raw 2-dimensioanl oxidative muscle electron micrograph overlayed with tracings of several paravascular mitochondria. Bottom right: 3-D rendering of the mitochondria from the image above showing the wire-like projections from the paravascular space into the intrafibrillar regions of the muscle cell. All images adapted from Ref. .
FIGURE 8.
FIGURE 8.
Proposed hypothesis for current generation along mitochondrial tubules. In the paravascular region of a mitochondrion (at right), protons are pumped out by the electron transport chain and then recycled back across the inner mitochondrial membrane through a high abundance sodium or potassium/proton exchanger. In the interior region of the mitochondrion, protons are brought into the mitochondrion through complex V and sent back out through a sodium or potassium/proton exchanger. Current thus proceeds from the interior to the paravascular regions of the mitochondrion through the high concentration sodium or potassium ions. Adapted from Ref. .
FIGURE 9.
FIGURE 9.
Intermitochondrial junctions couple adjacent mitochondrial structures. A: electron tomogram of a mouse left ventricle showing intermitochondrial junctions (yellow arrows) between adjacent mitochondria. Adapted from Ref. . B: sequential images of the electron tomogram series from the boxed region in A showing direct physical contact between adjacent mitochondria within intermitochondrial junctions. Adapted from Ref. . C: schematic of the intermitochondrial junction-based coupling of the paravascular mitochondria and transitional mitochondria into the intrafibrillar region of the muscle cell. D: prevalence of paravascular mitochondrial coupling (purple dots) and transitional mitochondria (green) linking the paravascular and intrafibrillar regions of the mitochondrial reticulum. Adapted from Ref. .
FIGURE 10.
FIGURE 10.
Structural and functional connectivity of striated muscle mitochondrial networks. Top left: structural and functional connectivity of cardiac muscle mitochondrial reticulum is primarily parallel to the axis of contraction. Top right: Structural and functional connectivity of oxidative muscle mitochondrial reticulum occurs both parallel and perpendicular to the axis of contraction. Bottom right: structural and functional connectivity of glycolytic muscle mitochondrial reticulum is primarily perpendicular to the axis of contraction. Bottom left: ratiometric mitochondrial membrane potential voltage maps in response to localized depolarization along each axis in cardiac, oxidative, and glycolytic muscles as in FIGURE 5. Adapted from Refs. 167, 303).

References

    1. Suga H. Ventricular energetics. Physiol Rev 70: 247–277, 1990. doi: 10.1152/physrev.1990.70.2.247. - DOI - PubMed
    1. Mommaerts WF. Energetics of muscular contraction. Physiol Rev 49: 427–508, 1969. doi: 10.1152/physrev.1969.49.3.427. - DOI - PubMed
    1. Joyner MJ, Casey DP. Regulation of increased blood flow (hyperemia) to muscles during exercise: a hierarchy of competing physiological needs. Physiol Rev 95: 549–601, 2015. doi: 10.1152/physrev.00035.2013. - DOI - PMC - PubMed
    1. Lopaschuk GD, Ussher JR, Folmes CD, Jaswal JS, Stanley WC. Myocardial fatty acid metabolism in health and disease. Physiol Rev 90: 207–258, 2010. doi: 10.1152/physrev.00015.2009. - DOI - PubMed
    1. Flagg TP, Enkvetchakul D, Koster JC, Nichols CG. Muscle KATP channels: recent insights to energy sensing and myoprotection. Physiol Rev 90: 799–829, 2010. doi: 10.1152/physrev.00027.2009. - DOI - PMC - PubMed

Publication types

LinkOut - more resources