. 2021 Mar 18:10:e65857.
doi: 10.7554/eLife.65857.

Whole-organism eQTL mapping at cellular resolution with single-cell sequencing

Affiliations

Whole-organism eQTL mapping at cellular resolution with single-cell sequencing

Eyal Ben-David et al. Elife. .

Abstract

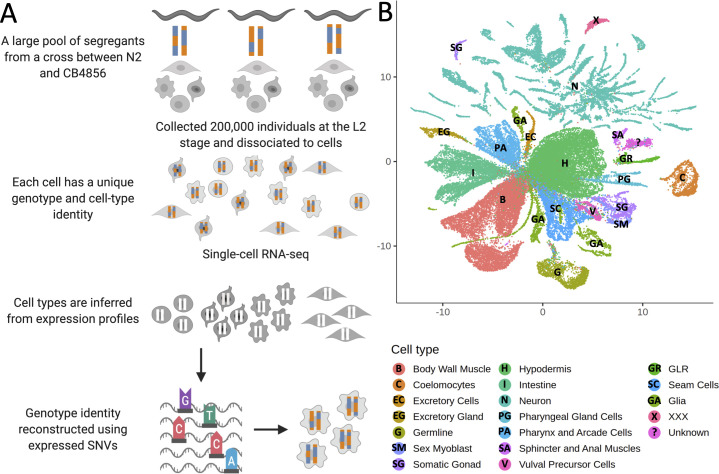
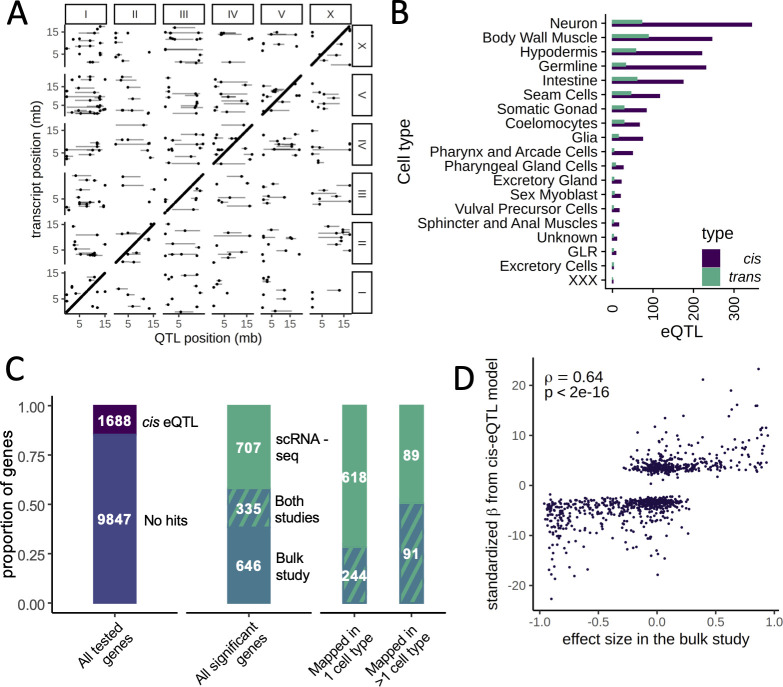
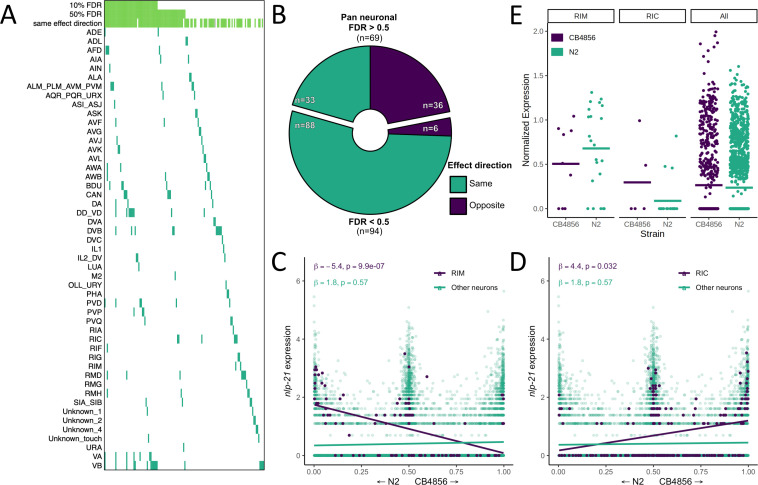
Genetic regulation of gene expression underlies variation in disease risk and other complex traits. The effect of expression quantitative trait loci (eQTLs) varies across cell types; however, the complexity of mammalian tissues makes studying cell-type eQTLs highly challenging. We developed a novel approach in the model nematode Caenorhabditis elegans that uses single-cell RNA sequencing to map eQTLs at cellular resolution in a single one-pot experiment. We mapped eQTLs across cell types in an extremely large population of genetically distinct C. elegans individuals. We found cell-type-specific trans eQTL hotspots that affect the expression of core pathways in the relevant cell types. Finally, we found single-cell-specific eQTL effects in the nervous system, including an eQTL with opposite effects in two individual neurons. Our results show that eQTL effects can be specific down to the level of single cells.

Keywords: C. elegans; cell-types; eqtl; genetics; genomics; mapping; rna-seq; single-cell.

Plain language summary

DNA sequences that differ between individuals often change the activation pattern of genes. That is, they change how, when, or why genes switch on and off. We call such DNA sequences 'expression quantitative trait loci', or eQTLs for short. Many of these eQTLs affect biological traits, but their effects are not always easy to predict. In fact, these effects can change with time, with different stress levels, and even in different types of cells. This makes studying eQTLs challenging, especially in organisms with many different types of cells. Standard methods of studying eQTLs involve separately measuring which genes switch on or off under every condition and in each cell. However, a technology called single cell sequencing makes it possible to profile many cells simultaneously, determining which genes are switched on or off in each one. Applying this technology to eQTL discovery could make a challenging problem solvable with a straightforward experiment. To test this idea, Ben-David et al. worked with the nematode worm Caenorhabditis elegans, a frequently-used experimental animal which has a small number of cells with well-defined types. The experiment included tens of thousands of cells from tens of thousands of genetically distinct worms. Using single cell sequencing, Ben-David et al. were able to find eQTLs across all the different cell types in the worms. These included many eQTLs already identified using traditional approaches, confirming that the new method worked. To understand the effects of some of these eQTLs in more detail, Ben-David et al. took a closer look at the cells of the nervous system. This revealed that eQTL effects not only differ between cell types, but also between individual cells. In one example, an eQTL changed the expression of the same gene in opposite directions in two different nerve cells. There is great interest in studying eQTLs because they provide a common mechanism by which changes in DNA can affect biological traits, including diseases. These experiments highlight the need to compare eQTLs in all conditions and tissues of interest, and the new technique provides a simpler way to do so. As single-cell technology matures and enables profiling of larger numbers of cells, it should become possible to analyze more complex organisms. This could one day include mammals.


Conflict of interest statement

EB, JB, LG, SZ, JB, LK No competing interests declared

Figures

Figure 1.
Figure 1.. Whole-organism expression quantitative trait loci mapping with single-cell RNA-sequencing (scRNA-seq).
(A) A large population of segregants is dissociated to single cells. Each cell in the suspension has an unknown genotype and cell-type identity. The suspension is profiled using scRNA-seq. Cell-type identity is inferred by clustering cells and comparing the expression of known marker genes. Genotypes are reconstructed from expressed single-nucleotide variants. (B) The Uniform Manifold Approximation and Projection of 55,508 scRNA-seq expression profiles from approximately 200,000 C. elegans F4 segregants collected at the L2 larval stage is shown. Cells are colored based on the inferred cell type.
Figure 1—figure supplement 1.
Figure 1—figure supplement 1.. Observed representation of cell types in our dataset compared to expected.
The expected number of cells was calculated by manually curating the cellular lineage information available at https://www.wormatlas.org/ for the L2 stage.
Figure 2.
Figure 2.. Probabilistic genotyping using a hidden Markov model.
A cell with the median (69) number of unique genotype-informative single-nucleotide variant (SNV) unique molecular identifier (UMI) counts is shown for illustration. The trace is a summation of the probability of a CB4856 homozygous genotype and half the probability of CB4856 heterozygous genotype at each position. Each vertical line is a count for an SNV, and colors correspond to the count depth. Vertical lines pointing upwards denote counts supporting the CB4856 variant, while lines pointing downwards are counts supporting the N2 variant.
Figure 3.
Figure 3.. Expression quantitative trait loci (eQTL) mapping in cell types.
(A) A genome-wide map of eQTLs across all cell types is shown. The position of the eQTLs is shown on the x-axis, while the y-axis shows the position of the associated transcripts. Points along the diagonal are cis eQTLs (those mapping to nearby genes). (B) The number of cis and trans eQTLs mapped in each cell type. (C) The overlap between a previous study that mapped eQTLs in whole worms in a panel of recombinant inbred lines and our dataset. (Left) The proportion of genes with a cis eQTL in at least one dataset out of all genes tested. (Middle) Of the 1688 significant cis eQTL genes, 355 had a cis eQTL in both datasets, representing a highly significant enrichment. (Right) Hits mapped in more than one cell type were more likely to also be found in the whole-worm (‘bulk’) dataset. (D) Quantitative comparison between normalized effect sizes in our dataset and in the whole-worm dataset.
Figure 3—figure supplement 1.
Figure 3—figure supplement 1.. cis expression quantitative trait loci (eQTLs) reflect gene expression differences in the parent strains.
Comparison between cis eQTLs mapped across all cell types and gene expression differences in a dataset of 6721 N2 and 3104 CB4856 cells. For cis eQTLs mapped in multiple cell types, effect sizes were combined using Stouffer’s weighted-Z method (Whitlock, 2005). Differential gene expression between N2 and CB4856 was calculated using R package DEsingle.
Figure 3—figure supplement 2.
Figure 3—figure supplement 2.. Correlation between cell-type cis expression quantitative trait loci signal and differential gene expression between the parental strains.
The data corresponds to Figure 3—figure supplement 1, split out by each cell type separately.
Figure 4.
Figure 4.. Cell-type-specific trans expression quantitative trait loci (eQTLs) hotspots.
A genome-wide map of eQTLs in seam cells (A), neurons (B), body-wall muscle cells (C), and intestinal cells (D) is shown. The position of the eQTLs is shown on the x-axis, while the y-axis shows the position of the associated transcripts. The dotted line marks the peak position of the hotspot, while targets of each hotspot are colored.
Figure 4—figure supplement 1.
Figure 4—figure supplement 1.. Cell-type expression of genes that form troponin complexes.
Size of circles corresponds to the percentage of cells expressing each gene in each cell type, and the color corresponds to average expression. Of the four troponin genes strongly expressed in the body wall muscle, three are affected by a trans expression quantitative trait loci hotspot on Chr. I.
Figure 5.
Figure 5.. Neuron-specific expression quantitative trait loci (eQTL) mapping.
(A) cis eQTLs mapped in single neuronal subtypes (sn-eQTLs) are shown. The top three rows indicate whether the eQTL was mapped pan-neuronally at a 10% false discovery rate (FDR) threshold (row 1), at a 50% FDR threshold (row 2), and whether the sign of the effect estimate (‘effect direction’) was the same in the pan-neuronal and single-cell mapping (row 3). (B) Comparing the effect direction between the sn-eQTL mapping and mapping in a set of neurons excluding the sn-eQTL neuron shows evidence for subtype-specific effects. The number of genes showing the same (‘purple’) or opposite (‘turquoise’) effect directions is shown for genes with pan-neuronal FDR > 50% (top) and <50% (bottom). (C, D) An eQTL with antagonistic effects in two neurons. Higher expression of the gene nlp-21 in the RIM neuron is associated with the N2 allele (C), while higher expression in the RIC neuron is associated with the CB4856 allele (D). In (C) and (D), a linear fit is shown for illustration. All p-values are FDR-corrected. Read counts were normalized to the number of UMIs in each cell and log-transformed. (E) Expression of nlp-21 in the parental dataset. The direction of effect is concordant between the left panel and (C) (RIM neuron) and between the middle panel and (D) (RIC neuron). Horizontal lines are averages.
Figure 5—figure supplement 1.
Figure 5—figure supplement 1.. Uniform Manifold Approximation and Projection of 12,468 neurons.
Each cluster is labeled based on the neuronal identity. Clusters represent either single neurons or few neurons with shared function.

References

    1. Albert FW, Bloom JS, Siegel J, Day L, Kruglyak L. Genetics of trans-regulatory variation in gene expression. eLife. 2018;7:e35471. doi: 10.7554/eLife.35471. - DOI - PMC - PubMed
    1. Albert FW, Kruglyak L. The role of regulatory variation in complex traits and disease. Nature Reviews Genetics. 2015;16:197–212. doi: 10.1038/nrg3891. - DOI - PubMed
    1. Andersen EC, Bloom JS, Gerke JP, Kruglyak L. A variant in the neuropeptide receptor npr-1 is a major determinant of Caenorhabditis elegans growth and physiology. PLOS Genetics. 2014;10:e1004156. doi: 10.1371/journal.pgen.1004156. - DOI - PMC - PubMed
    1. Andersen EC, Shimko TC, Crissman JR, Ghosh R, Bloom JS, Seidel HS, Gerke JP, Kruglyak L. A Powerful New Quantitative Genetics Platform, Combining Caenorhabditis elegans High-Throughput Fitness Assays with a Large Collection of Recombinant Strains. G3: Genes, Genomes, Genetics. 2015;5:911–920. doi: 10.1534/g3.115.017178. - DOI - PMC - PubMed
    1. Arends D, Prins P, Jansen RC, Broman KW. R/qtl: high-throughput multiple QTL mapping: Fig. 1. Bioinformatics. 2010;26:2990–2992. doi: 10.1093/bioinformatics/btq565. - DOI - PMC - PubMed

Publication types

MeSH terms

Associated data