. 2021 Mar 18:10:e66160.
doi: 10.7554/eLife.66160.

PomX, a ParA/MinD ATPase activating protein, is a triple regulator of cell division in Myxococcus xanthus

Affiliations

PomX, a ParA/MinD ATPase activating protein, is a triple regulator of cell division in Myxococcus xanthus

Dominik Schumacher et al. Elife. .

Abstract

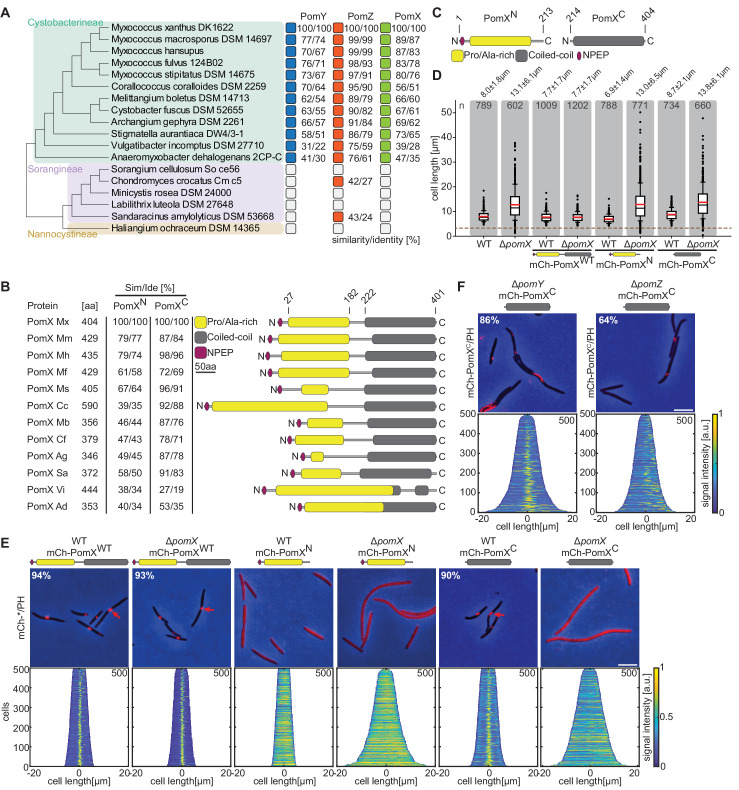
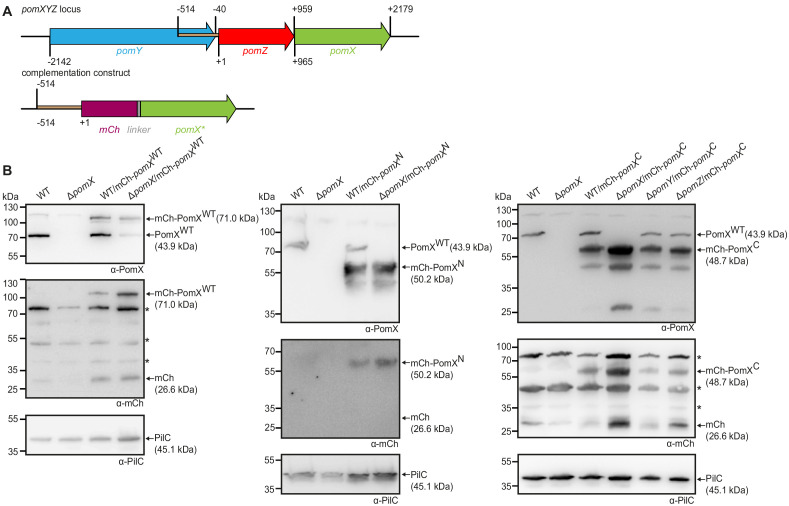
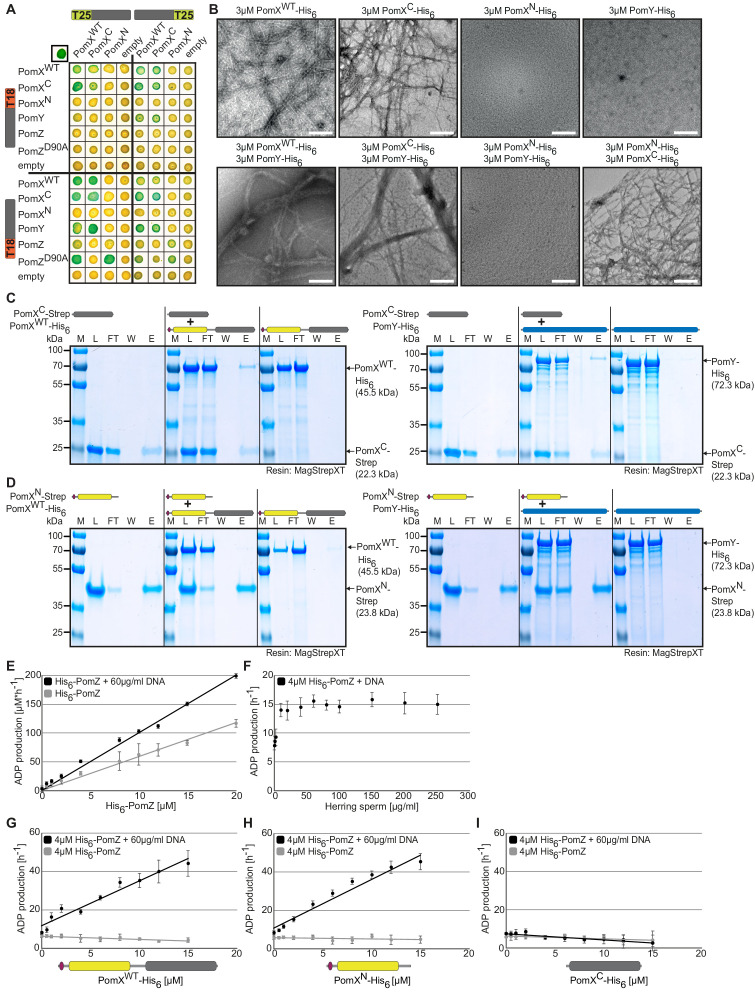
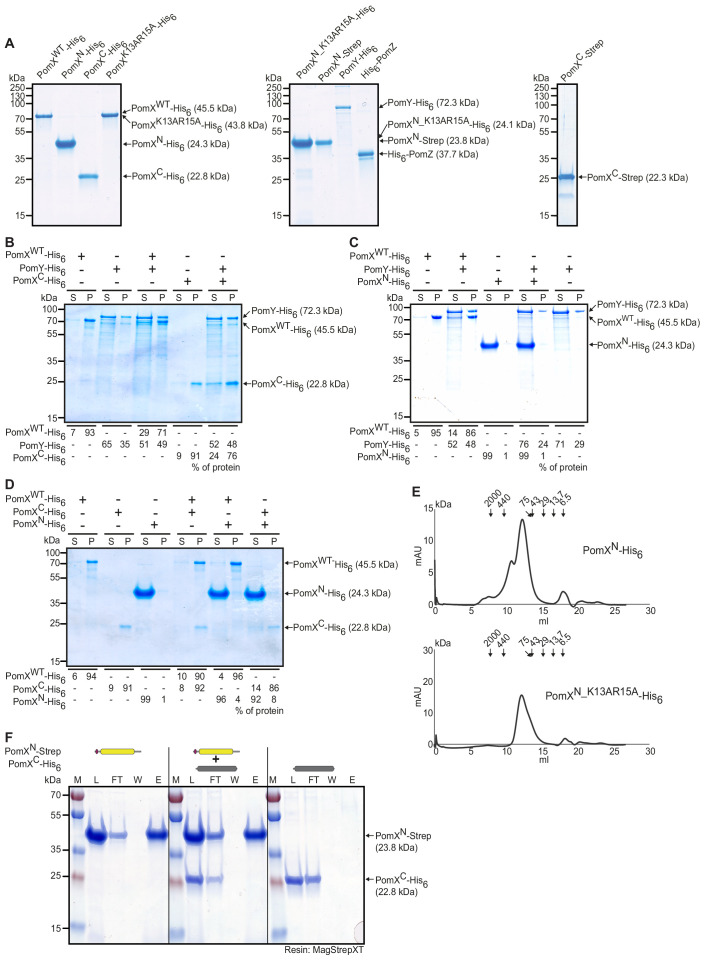
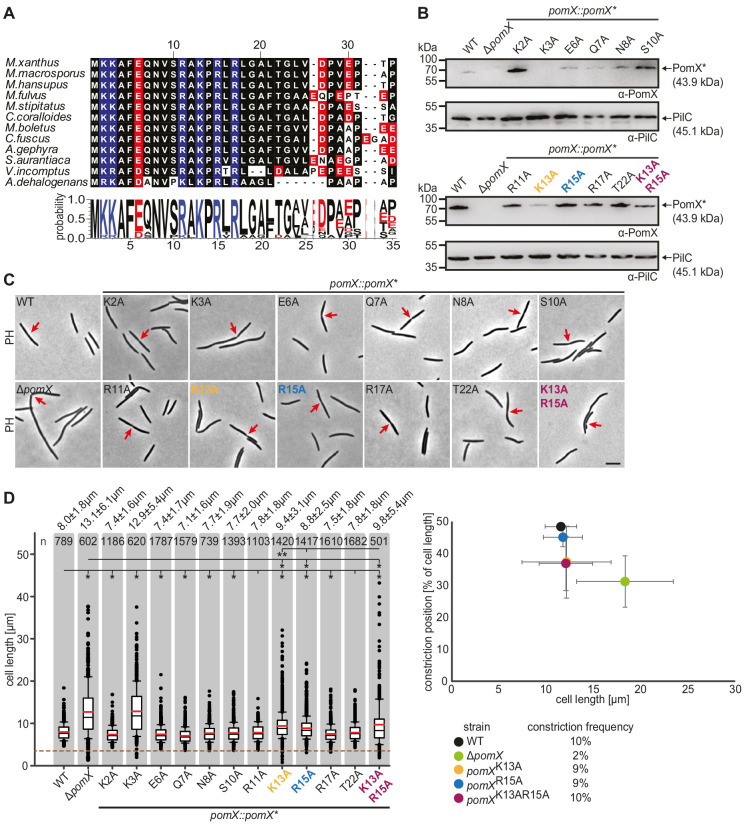
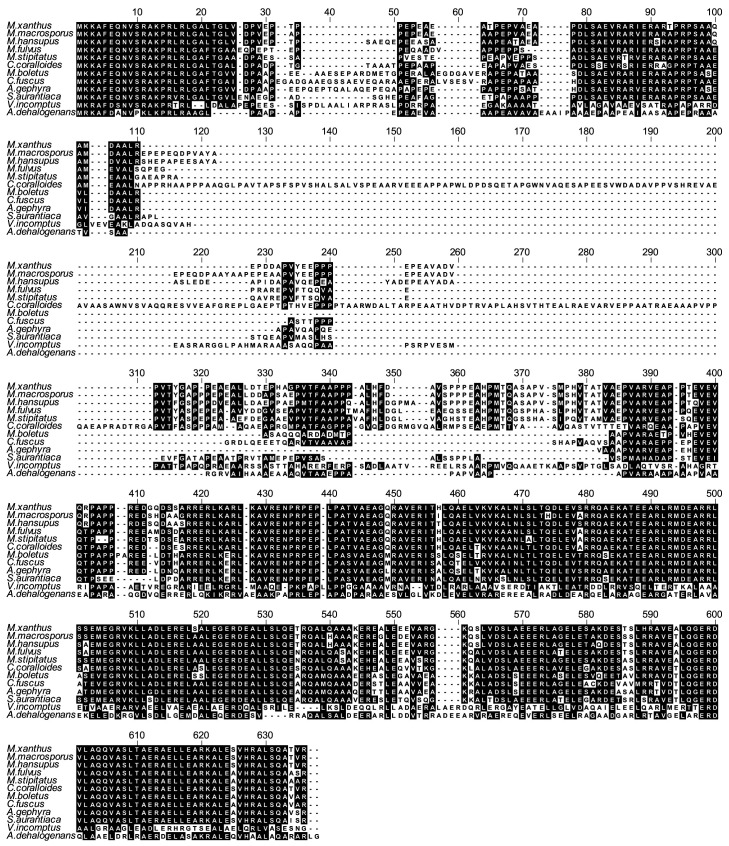
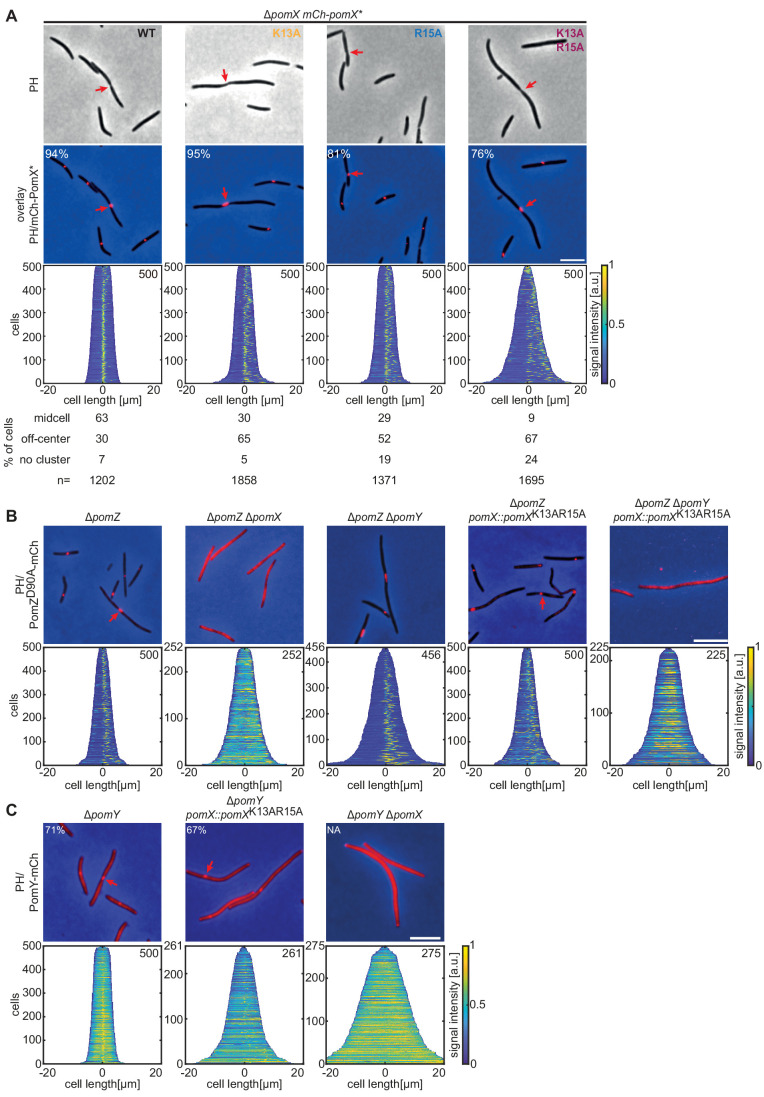
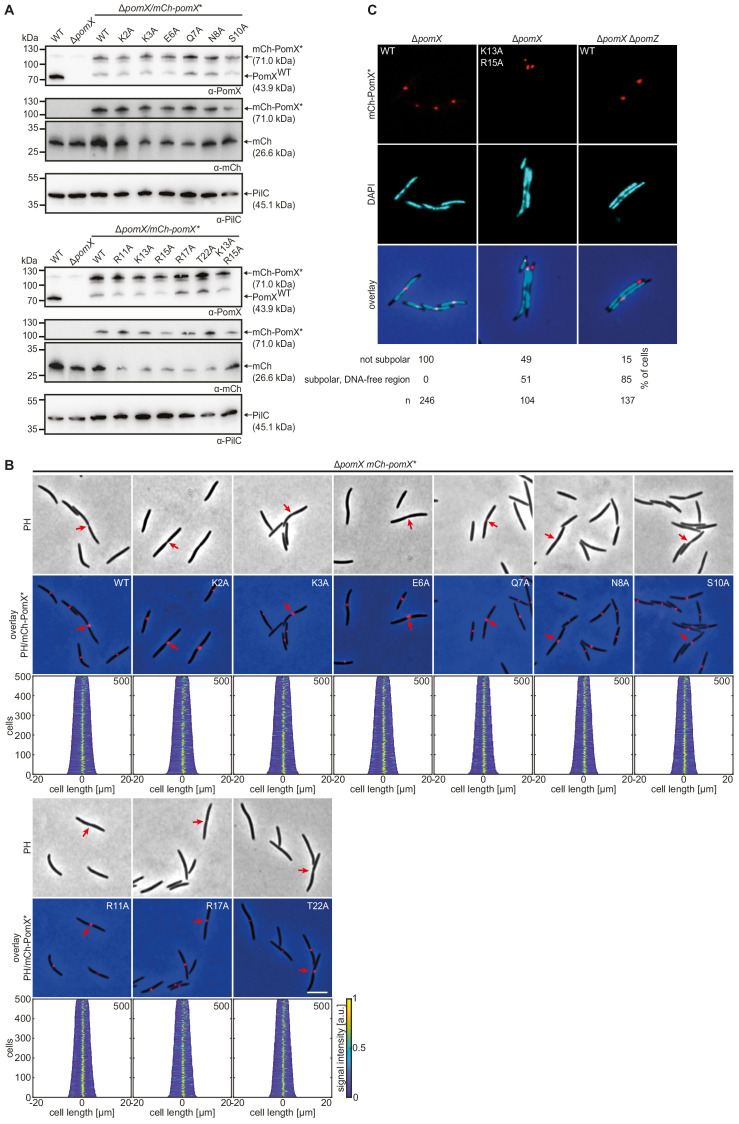
Cell division site positioning is precisely regulated but the underlying mechanisms are incompletely understood. In the social bacterium Myxococcus xanthus, the ~15 MDa tripartite PomX/Y/Z complex associates with and translocates across the nucleoid in a PomZ ATPase-dependent manner to directly position and stimulate formation of the cytokinetic FtsZ-ring at midcell, and then undergoes fission during division. Here, we demonstrate that PomX consists of two functionally distinct domains and has three functions. The N-terminal domain stimulates ATPase activity of the ParA/MinD ATPase PomZ. The C-terminal domain interacts with PomY and forms polymers, which serve as a scaffold for PomX/Y/Z complex formation. Moreover, the PomX/PomZ interaction is important for fission of the PomX/Y/Z complex. These observations together with previous work support that the architecturally diverse ATPase activating proteins of ParA/MinD ATPases are highly modular and use the same mechanism to activate their cognate ATPase via a short positively charged N-terminal extension.

Keywords: FtsZ; MinD; MinE; ParA; ParB; bacterial cell division; cell biology; infectious disease; microbiology.


Conflict of interest statement

DS, AH, SB, EF, LS No competing interests declared

Figures

Figure 1.
Figure 1.. PomX consists of two domains that are both required for function.
(A) Similarity and identity analysis of PomX, PomY, and PomZ homologs. The three Myxococcales suborders are indicated. An open box indicates that a homolog is not present. (B) Similarity and identity of PomX domains in different PomX homologs. Similarity and identity were calculated based on the domains of M. xanthus PomX shown in C. (C) PomX truncations used in this study. Numbers on top indicate the start and stop positions of the truncations relative to full-length PomXWT. (D) Cell length distribution of cells of indicated genotypes. Cells below stippled line are minicells. Numbers indicate mean cell length±STDEV. In the boxplots, boxes include the 25th and the 75th percentile, whiskers data points between the 10% and 90% percentile, outliers are shown as black dots. Black and red lines indicate the median and mean, respectively. Number of analyzed cells is indicated. In the complementation strains, pomX alleles were expressed from plasmids integrated in a single copy at the attB site. (E) Fluorescence microscopy of cells of indicated genotypes. Phase-contrast and fluorescence images of representative cells were overlayed. Numbers indicate fraction of cells with fluorescent clusters. Demographs show fluorescence signals of analyzed cells sorted according to length and with off-center signals to the right. Numbers in upper right indicate number of cells used to create demographs. Scale bar, 5 µm. (F) Fluorescence microscopy of cells of indicated genotypes. Images of representative cells and demographs were created as in (E). Scale bar, 5 µm. For experiments in D, E and F similar results were obtained in two independent experiments.
Figure 1—figure supplement 1.
Figure 1—figure supplement 1.. PomX variants accumulate in M.xanthus.
(A) Schematic of pomXYZ locus (upper panel) and the construct used for ectopic expression of mCh-pomX and its variants from the attB site (lower panel). The brown region upstream of pomZ was used as a promoter for the expression of mCh-pomX variants. All coordinates are relative to the first nucleotide in pomZ start codon (+1). (B) Western blot analysis of mCh-PomX (71.0 kDa), mCh-PomXN (50.2 kDa), and mCh-PomXC (48.7 kDa) accumulation in indicated strains. Protein from the same number of cells was loaded per lane. Molecular mass markers are indicated on the left and analyzed proteins on the right including calculated MW. The same blots were sequentially analyzed with α-PomX (top panel), α-mCh (middle panel), and α-PilC (lower panel). PilC was used as a loading control. Note PomXWT (43.9 kDa) does not migrate at the expected size in SDS-PAGE but as a protein of a molecular weight of ~72 kDa. Similarly, mCh-PomXWT, mCh-PomXN, and mCh-PomXC migrate at ~110 kDa, ~60 kDa, and ~62 kDa, respectively. Note that the three bands labeled * in the right and left α-mCh western blot of (B) are unspecific bands that sometimes appear in the western blots with α-mCh antibodies.
Figure 2.
Figure 2.. PomXC interacts with PomX and PomY while PomXN stimulates PomZ ATPase activity.
(A) BACTH analysis of interactions between Pom proteins. The indicated protein fragments were fused to T18 and T25 as indicated. Blue colony indicates an interaction, white no interaction. Positive control in upper left corner, leucine zipper of GCN4 fused to T25 and T18. For negative controls, co-transformations with empty plasmids were performed. Images show representative results and were performed in three independent experiments. (B) TEM images of negatively stained purified proteins. Proteins were applied to the EM grids alone or after mixing in a 1:1 molar ratio as indicated before staining. Scale bar, 200 nm. Images show representative results of several independent experiments. (C, D) In vitro pull-down experiments with purified PomXC-Strep, PomXN-Strep, PomXWT-His6, and PomY-His6. Instant Blue-stained SDS-PAGE shows load (L), flow-through (FL), wash (W), and elution (E) fractions using MagStrep XT beads in pull-down experiments with 10 µM of indicated proteins alone or pre-mixed as indicated on top. Molecular size markers are shown on the left and proteins analyzed on the right together with their calculated MW. Note that PomXWT-His6 (Schumacher et al., 2017) and PomXN-Strep migrate aberrantly and according to a higher MW. All samples in a panel were analyzed on the same gel and black lines are included for clarity. Experiments were repeated in two independent experiments with similar results. (E–I) His6-PomZ ATPase activity. ADP production rate was determined in an NADH-coupled photometric microplate assay in the presence of 1 mM ATP at 32°C. DNA and PomX variants were added as indicated. Spontaneous ATP hydrolysis and NADH consumption was accounted for by subtracting the measurements in the absence of His6-PomZ. Data points show the mean±STDEV calculated from six independent measurements.
Figure 2—figure supplement 1.
Figure 2—figure supplement 1.. Purification and analysis of Pom proteins.
(A) SDS-PAGE analysis of purified proteins used in this study. Molecular size markers are shown on the left and the purified proteins including calculated MW on the right. Two µg per protein was loaded. Note that PomXWT-His6, PomXN-His6, PomXK12AR15A-His6, PomXN_K13AR15A-His6, and PomXN-Strep do not separate according to their calculated MW. (B–D) Sedimentation assays with indicated proteins. The indicated proteins were mixed at final concentrations of 3 µM as indicated. Following high-speed ultracentrifugation, the supernatant (S) and pellet (P) fractions were separated by SDS-PAGE. Molecular size markers are shown on the left and analyzed proteins on the right. Numbers below show the quantification of indicated protein in the different fractions in %. Similar results were observed in two independent experiments. (E) Size exclusion chromatography elution profile of PomXN-His6 and PomXN_K13AR15A-His6. The elution pattern of PomXN-His6 and PomXN_K13AR15A-His6 from a Superdex 200 10/300 GL gel filtration column was measured at 280 nm. Arrows indicate elution maxima of protein standards of the indicated size in kDa. The same results were observed in two independent experiments. (F) In vitro pull-down experiments with purified PomXN-Strep and PomXC-His6. Instant Blue-stained SDS-PAGE shows load (L), flow-through (FL), wash (W), and elution (E) fractions using MagStrep XT beads in pull-down experiments with 10 µM of indicated proteins alone or pre-mixed as indicated on top. Molecular size markers are shown on the left and proteins analyzed on the right together with their calculated MW. All samples in a panel were analyzed on the same gel and black lines are included for clarity. Experiments were repeated in two independent experiments with similar results.
Figure 3.
Figure 3.. PomXN harbors a conserved N-terminal peptide crucial for cell division site positioning at midcell.
(A) Multiple sequence alignment of the conserved PomX N-terminus. Black background indicates similar amino acids. Positively and negatively charged residues are indicated in blue and red, respectively. Weblogo consensus sequence is shown below. (B) Western blot analysis of accumulation of PomX variants. Protein from the same number of cells was loaded per lane. Molecular mass markers are indicated on the left. PilC was used as a loading control. (C) Phase-contrast microscopy of strains of indicated genotypes. Representative cells are shown. Red arrows indicate cell division constrictions. Scale bar, 5 µm. (D) Analysis of cell length distribution and cell division constrictions of cells of indicated genotypes. Left panel, boxplot is as in Figure 1D. Number of cells analyzed is indicated at the top. *p<0.001; **p<0.05 in Mann-Whitney test. Right panel, cell division position in % of cell length is plotted as a function of cell length. Dots represent mean ± STDEV. Numbers below indicate cell division constriction frequency. In B, C, and D, similar results were obtained in two independent experiments.
Figure 3—figure supplement 1.
Figure 3—figure supplement 1.. PomX homologs are highly conserved.
Alignment of PomX homologs from other fully sequenced genomes of Myxobacteria. Sequences were aligned with MUSCLE and color-coded by homology using Bioedit. Black and white backgrounds indicate similar/homologous amino acids and no conservation, respectively.
Figure 4.
Figure 4.. PomXK13AR15A forms clusters and interacts with PomY but not with PomZ in vivo.
(A-C) Fluorescence microscopy of cells of indicated genotypes. Phase-contrast (PH) images and/or overlays of fluorescence images and PH of representative cells. Red arrows indicate division constrictions. Scale bar, 5 µm. In A, numbers in overlays indicate fraction of cells with a cluster and numbers below indicate localization patterns in % and number of cells analyzed. Demographs are as in Figure 1E. Similar results were observed in two independent experiments.
Figure 4—figure supplement 1.
Figure 4—figure supplement 1.. The PomXK13AR15A variant is impaired in function.
(A) Western blot analysis of the accumulation of mCh-PomX variants in indicated strains. Protein from the same number of cells was loaded per lane. Molecular mass marker is shown on the left and analyzed proteins on the right. The same blots were sequentially analyzed with α-PomX (top panel), α-mCh (middle panel), and α-PilC (lower panel) antibodies. PilC was used as a loading control. Note PomX (43.9 kDa) does not migrate at the expected size in SDS-PAGE but instead as a protein of a molecular weight of 72 kDa. Similarly, mCh-PomX migrates at ~110 kDa. Similar results were obtained in two independent experiments. (B) Fluorescence microscopy of indicated mCh-PomX variants. Phase-contrast and fluorescence images of representative cells and the overlay are shown. Red arrows indicate cell division constrictions. Scale bar, 5 µm. Demographs were created as in Figure 1E. Experiments were repeated in two independent experiments with similar results. (C) Fluorescence microscopy of mCh-PomX variants in DAPI-stained cells of the indicated genotype. The mCh signal (first panel), DAPI signal (second panel), and the overlay (third panel) show representative cells. Amino acid substitutions are indicated in white in the mCh images. Scale bar, 5 µm. Quantification of mCh-PomX* localization patterns in % and the number of analyzed cells is shown below the images. Images show representative cells. Similar results were obtained in two independent experiments.
Figure 4—figure supplement 2.
Figure 4—figure supplement 2.. Western blot analysis of PomY-mCh and PomZD90A-mCh accumulation.
(A) Western blot analysis of PomZD90A-mCh accumulation in indicated strains. Protein from the same number of cells was loaded per lane. Molecular mass markers are indicated on the left and analyzed proteins including MW on the right. The same blots were sequentially analyzed with α-PomZ (top panel), α-mCh (middle panel), and α-PilC (lower panel). PilC was used as a loading control. The same results were observed in two independent experiments. (B) Western blot analysis of PomY-mCh accumulation in indicated strains. Blots were done as in (A), but α-PomY antibodies were used instead of α-PomZ antibodies. The same results were observed in two independent experiments.
Figure 5.
Figure 5.. PomX AAP activity resides in PomXNPEP.
(A) BACTH analysis of interactions between Pom proteins and PomX variants. Experiments were performed in parallel with those in Figure 2A. For presentation purposes, the results for PomXWT and PomXN T25 fusion proteins and their interaction with PomZ and PomZD90A T18 fusion proteins were not included but are included in Figure 2A. Images show representative results and similar results were obtained in three independent experiments. (B) TEM images of negatively stained purified proteins. Experiments were done as in Figure 2B. Scale bar, 200 nm. Images show representative results of several independent experiments. (C) Sedimentation assays with indicated purified proteins. Proteins were analyzed at a concentration of 3 µM alone or in combination. After high-speed centrifugation, proteins in the supernatant (S) and pellet (P) fractions were separated by SDS-PAGE and stained with Instant Blue. Molecular size markers are shown on the left and analyzed proteins on the right including their calculated MW. Numbers below indicate % of proteins in different fractions. Similar results were obtained in two independent experiments. All samples were analyzed on the same gel; the black line indicates that lanes were removed for presentation purposes. (D, E) His6-PomZ ATPase activity. Experiments were done and analyzed as in Figure 2E–I in the presence or absence of DNA and the indicated proteins and peptides. Data points show the mean±STDEV calculated from six independent measurements. In (D), stippled lines indicate the regression of the ADP production rate in the presence of PomXWT-His6 (left, Figure 2G) and PomXN-His6 (right, Figure 2H). In E, the stippled line indicates the regression of the ADP production rate in the presence of PomXWT-His6.
Figure 6.
Figure 6.. The PomX/PomZ interaction is important for cluster fission during division.
(A) Fluorescence time-lapse microscopy of mCh-PomX variants in cells of indicated genotypes. Overlays of representative mCh images and PH are shown in 20 min intervals. Stippled lines indicate cell division events. Orange and gray arrows mark mCh-PomX clusters in daughter cells after cell division with cluster fission and without cluster fission, respectively. Scale bar, 5 µm. (B) Quantification of cluster fission during cell division in cells of indicated genotypes. Cell division events were divided into those with (orange) and without (gray) cluster fission. Number of analyzed cell divisions is shown on top. The same results were obtained in two independent experiments.
Figure 7.
Figure 7.. AAPs of MinD/ParA ATPases are diverse but share common features.
Left, domain analysis of known and predicted AAPs of ParA/MinD ATPases with key below. Sequences on the right, N-terminus of indicated proteins. Positively charged amino acids are indicated on blue, and positively charged residues experimentally demonstrated to be important for AAP activity on red. Underlined sequences indicate peptides experimentally demonstrated to have AAP activity. Spo0J of T. thermophilus and B. subtilis, and SopB of plasmid F are ParB homologs.

Similar articles

Cited by

References

    1. Ah-Seng Y, Lopez F, Pasta F, Lane D, Bouet J-Y. Dual role of DNA in regulating ATP hydrolysis by the SopA partition protein. Journal of Biological Chemistry. 2009;284:30067–30075. doi: 10.1074/jbc.M109.044800. - DOI - PMC - PubMed
    1. Ah-Seng Y, Rech J, Lane D, Bouet JY. Defining the role of ATP hydrolysis in Mitotic segregation of bacterial plasmids. PLOS Genetics. 2013;9:e1003956. doi: 10.1371/journal.pgen.1003956. - DOI - PMC - PubMed
    1. Altschul SF, Gish W, Miller W, Myers EW, Lipman DJ. Basic local alignment search tool. Journal of Molecular Biology. 1990;215:403–410. doi: 10.1016/S0022-2836(05)80360-2. - DOI - PubMed
    1. Barillà D, Carmelo E, Hayes F. The tail of the ParG DNA segregation protein remodels ParF polymers and enhances ATP hydrolysis via an arginine finger-like motif. PNAS. 2007;104:1811–1816. doi: 10.1073/pnas.0607216104. - DOI - PMC - PubMed
    1. Bouet JY, Funnell BE. P1 ParA interacts with the P1 partition complex at parS and an ATP-ADP switch controls ParA activities. The EMBO Journal. 1999;18:1415–1424. doi: 10.1093/emboj/18.5.1415. - DOI - PMC - PubMed

Publication types

MeSH terms

Substances

LinkOut - more resources