. 2021 Jul 28;144(6):1727-1737.
doi: 10.1093/brain/awab113.

Paclitaxel increases axonal localization and vesicular trafficking of Nav1.7

Affiliations

Paclitaxel increases axonal localization and vesicular trafficking of Nav1.7

Elizabeth J Akin et al. Brain. .

Abstract

The microtubule-stabilizing chemotherapy drug paclitaxel (PTX) causes dose-limiting chemotherapy-induced peripheral neuropathy (CIPN), which is often accompanied by pain. Among the multifaceted effects of PTX is an increased expression of sodium channel Nav1.7 in rat and human sensory neurons, enhancing their excitability. However, the mechanisms underlying this increased Nav1.7 expression have not been explored, and the effects of PTX treatment on the dynamics of trafficking and localization of Nav1.7 channels in sensory axons have not been possible to investigate to date. In this study we used a recently developed live imaging approach that allows visualization of Nav1.7 surface channels and long-distance axonal vesicular transport in sensory neurons to fill this basic knowledge gap. We demonstrate concentration and time-dependent effects of PTX on vesicular trafficking and membrane localization of Nav1.7 in real-time in sensory axons. Low concentrations of PTX increase surface channel expression and vesicular flux (number of vesicles per axon). By contrast, treatment with a higher concentration of PTX decreases vesicular flux. Interestingly, vesicular velocity is increased for both concentrations of PTX. Treatment with PTX increased levels of endogenous Nav1.7 mRNA and current density in dorsal root ganglion neurons. However, the current produced by transfection of dorsal root ganglion neurons with Halo-tag Nav1.7 was not increased after exposure to PTX. Taken together, this suggests that the increased trafficking and surface localization of Halo-Nav1.7 that we observed by live imaging in transfected dorsal root ganglion neurons after treatment with PTX might be independent of an increased pool of Nav1.7 channels. After exposure to inflammatory mediators to mimic the inflammatory condition seen during chemotherapy, both Nav1.7 surface levels and vesicular transport are increased for both low and high concentrations of PTX. Overall, our results show that PTX treatment increases levels of functional endogenous Nav1.7 channels in dorsal root ganglion neurons and enhances trafficking and surface distribution of Nav1.7 in sensory axons, with outcomes that depend on the presence of an inflammatory milieu, providing a mechanistic explanation for increased excitability of primary afferents and pain in CIPN.

Keywords: Nav1.7; chemotherapy-induced peripheral neuropathy; live microscopy; paclitaxel; peripheral pain.


Figures

Figure 1
Figure 1
Formation of retractions bulbs in cultured DRG neurons treated with PTX is concentration and time-dependent. DRG neurons expressing soluble enhanced green fluorescent protein (EGFP) to visualize axonal morphology were cultured in microfluidic chambers and treated with either DMSO (Cntrl), 25 nM PTX, or 250 nM PTX. (A) Example axon endings from the axonal chamber. Control axon endings generally had defined morphologies with protrusions or branches. Cultures treated with PTX showed some axons with bulbed endings (arrowheads), consistent with axonal degeneration. (B) Percentage of healthy versus bulbed axonal endings. Bulbed endings were seen more frequently with higher concentrations of PTX, as well as increasing over time of incubation. Number of axons for each condition is indicated in white text, from three independent cultures.
Figure 2
Figure 2
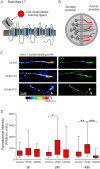
Increased membrane levels of Nav1.7 after 25 nM PTX treatment. DRG neurons expressing Halo-Nav1.7 and soluble EGFP were cultured in microfluidic chambers. (A) Schematic of Halo-Nav1.7. HaloTag was fused to an extra transmembrane segment such that channels inserted in the plasma membrane can be labelled using cell-impermeable fluorescently-conjugated HaloTag ligands. (B) Schematic of neurons cultured in microfluidic chambers where the cell bodies are plated within the somatic chamber and the axons extend through the microbarrier. For surface labelling of axonal endings (shown as red axons), cell-impermeable HaloTag ligand was added to the axonal chamber for 20 min, then excess label washed off. (C) Example axons demonstrating relative labelling of surface Halo-Nav1.7 by Halo-JF635i under different experimental conditions (left) and the EGFP shows axon morphology (right). Fluorescence intensity of the JF635i is shown by a graded scale with the greatest fluorescence intensity displayed as white and the lowest fluorescence intensity displayed as dark blue. (D) Quantification of Halo-Nav1.7 surface levels at axonal endings. Box plots of the mean fluorescence intensities of Halo-Nav1.7 in axons treated with 25 nM PTX are significantly greater than DMSO controls at 24 and 48 h. The horizontal line indicates the median, while the top and the bottom of the box indicate the 75th and 25th percentiles, respectively. The whiskers extend to the maximum and minimum values. Number of axons analysed (in order of control, 25 nM PTX, and 250 nM PTX): 31, 31, 19 (6 h); 21, 19, 13 (24 h), 25, 31, 18 (48 h). *P < 0.05, **P < 0.01. ***P < 0.001; one-way ANOVA with Bonferroni correction.
Figure 3
Figure 3
Vesicular trafficking of Halo-Nav1.7 containing vesicles is altered after PTX treatment. (A) Schematic depicting the OPAL imaging technique used to visualize vesicular trafficking. DRG neurons expressing Halo-Nav1.7 were cultured in MFCs for 5–7 days. Cell-permeable JF635i-HaloTag ligand was added to the soma chamber for 15 min, then anterogradely moving vesicles in the axonal chamber were imaged using spinning disk confocal microscopy. (B) Example kymographs of line scans along axons from cultures treated for 48 h. Vesicle movement is displayed as position (x-axis) over time (y-axis). (C) Quantification of vesicular flux (number of vesicles passing along each axon per minute). Number of axons analysed (in order of control, 25 nM PTX, 250 nM PTX): 39, 34, 28 (6 h), 24, 22, 16 (24 h), 39, 30, 7 (48 h). (D) Quantification of anterograde vesicular velocity. Vesicle were considered anterograde if they had a velocity >0.1 µm/s. Number of vesicles analysed (in order of control, 25 nM PTX, 250 nM PTX): 627, 566, 516 (6 h), 306, 250, 121) (24 h), 438, 502, 68 (48 h). The horizontal line indicates the median, while the top and the bottom of the box indicate the 75th and 25th percentiles, respectively. The whiskers extend to the maximum and minimum values. *P < 0.05, **P < 0.01. ***P < 0.001; one-way ANOVA with Bonferroni correction.
Figure 4
Figure 4
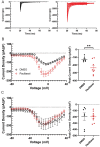
Currents produced by endogenous Nav1.7 but not Halo-Nav1.7 channels increases following treatment with PTX. (A) Family of somatic endogenous Nav1.7 current traces evoked by 40 ms depolarizing voltage steps from −80 mV to +10 mV in 5 mV increments from a holding potential of −100 mV. Representative smoothed (10 points averaged) ProTx-II sensitive Nav1.7 traces from rat DRG neurons treated with DMSO control (black) and 25 nM PTX (red) neurons are displayed. Traces illustrate the current evoked during the test-pulse and omit the response from the pre-pulse stimulus to inactivate axonal Nav currents. (B) Comparison of peak endogenous Nav1.7 current between control (black) and PTX treated conditions (red). (C) Comparison of peak Halo-Nav1.7 current (TTX-R and ProTX-II sensitive) between control (black) and PTX treated conditions (red). Nav1.7 current density was measured by normalizing maximal peak currents with cell capacitance. Scatter plots showing current density of endogenous Nav1.7 current (B) and Halo-Nav1.7 (C); mean and standard error of the mean (SEM) are indicated.
Figure 5
Figure 5
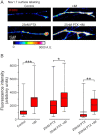
Membrane levels of Halo-Nav1.7 at axonal endings treated with PTX are increased with treatment with IM. DRG neurons were transfected with Halo-Nav1.7 and cultured in MFCs and treated with DMSO, 25 nM PTX, or 250 nM PTX alone, or co-treated with IM for 24 h. Channels in the plasma membrane were labelled using cell-impermeable JF635i-HaloTag ligand. (A) Example axons showing surface labelling and axon morphology at axonal endings. Fluorescence intensity of the JF635i is shown by a graded scale with the greatest fluorescence intensity displayed as white and the lowest fluorescence intensity displayed as dark blue. (B) Quantification of the mean fluorescent signal of the distal 60 µm at axonal endings. The horizonal line indicates the median, while the top and the bottom of the box indicate the 75th and 25th percentiles, respectively. The whiskers extend to the maximum and minimum values. Number of axons analysed (in order of control, 25 nM PTX, and 250 nM PTX): 21, 19, 13 (no IM); 25, 26, 16 (+IM). *P < 0.05, **P < 0.01. ***P < 0.001; Student’s t-test or Mann-Whitney U-test.
Figure 6
Figure 6
The velocity and flux of Halo-Nav1.7 vesicles treated with PTX are increased with treatment by IM. DRG neurons were transfected with Halo-Nav1.7 and cultured in MFCs and treated with DMSO, 25 nM PTX, or 250 nM PTX alone, or co-treated with IM for 24 h. OPAL imaging was used to visualize axonal transport of Halo-Nav1.7 containing vesicles. (A) Example kymographs of axons treated for 24 h with 25 nM PTX, either with or without addition of IM. (B) Quantification of anterograde vesicular flux. The horizontal line indicates the median, while the top and the bottom of the box indicate the 75th and 25th percentiles, respectively. The whiskers extend to the maximum and minimum values. Number of axons analysed (in order of control, 25 nM PTX, and 250 nM PTX): 24, 23, 16 (no IM); 24, 21, 10 (+IM). (C) Quantification of vesicular velocity. Number of vesicles analysed (in order of control, 25 nM PTX, and 250 nM PTX): 306, 386, 121 (no IM); 567, 506, 167 (+IM). *P < 0.05, **P < 0.01. ***P < 0.001; Student’s t-test or Mann-Whitney U-test.

Comment in

Similar articles

Cited by

References

    1. Flatters SJL, Dougherty PM, Colvin LA.. Clinical and preclinical perspectives on chemotherapy-induced peripheral neuropathy (CIPN): A narrative review. Br J Anaesth. 2017;119(4):737–749. - PubMed
    1. Gornstein E, Schwarz TL.. The paradox of paclitaxel neurotoxicity: Mechanisms and unanswered questions. Neuropharmacology. 2014;76 Pt A:175–183. - PubMed
    1. Staff NP, Fehrenbacher JC, Caillaud M, Damaj MI, Segal RA, Rieger S.. Pathogenesis of paclitaxel-induced peripheral neuropathy: A current review of in vitro and in vivo findings using rodent and human model systems. Exp Neurol. 2020;324:113121. - PMC - PubMed
    1. Zhang H, Dougherty PM.. Enhanced excitability of primary sensory neurons and altered gene expression of neuronal ion channels in dorsal root ganglion in paclitaxel-induced peripheral neuropathy. Anesthesiology. 2014;120(6):1463–1475. - PMC - PubMed
    1. Li Y, Tatsui CE, Rhines LD, et al.Dorsal root ganglion neurons become hyperexcitable and increase expression of voltage-gated T-type calcium channels (Cav3.2) in paclitaxel-induced peripheral neuropathy. Pain. 2017;158(3):417–429. - PMC - PubMed

Publication types

Substances