. 2021 Oct;23(10):6038-6055.
doi: 10.1111/1462-2920.15469. Epub 2021 Apr 1.

Global analysis of the apple fruit microbiome: are all apples the same?

Affiliations

Global analysis of the apple fruit microbiome: are all apples the same?

Ahmed Abdelfattah et al. Environ Microbiol. 2021 Oct.

Abstract

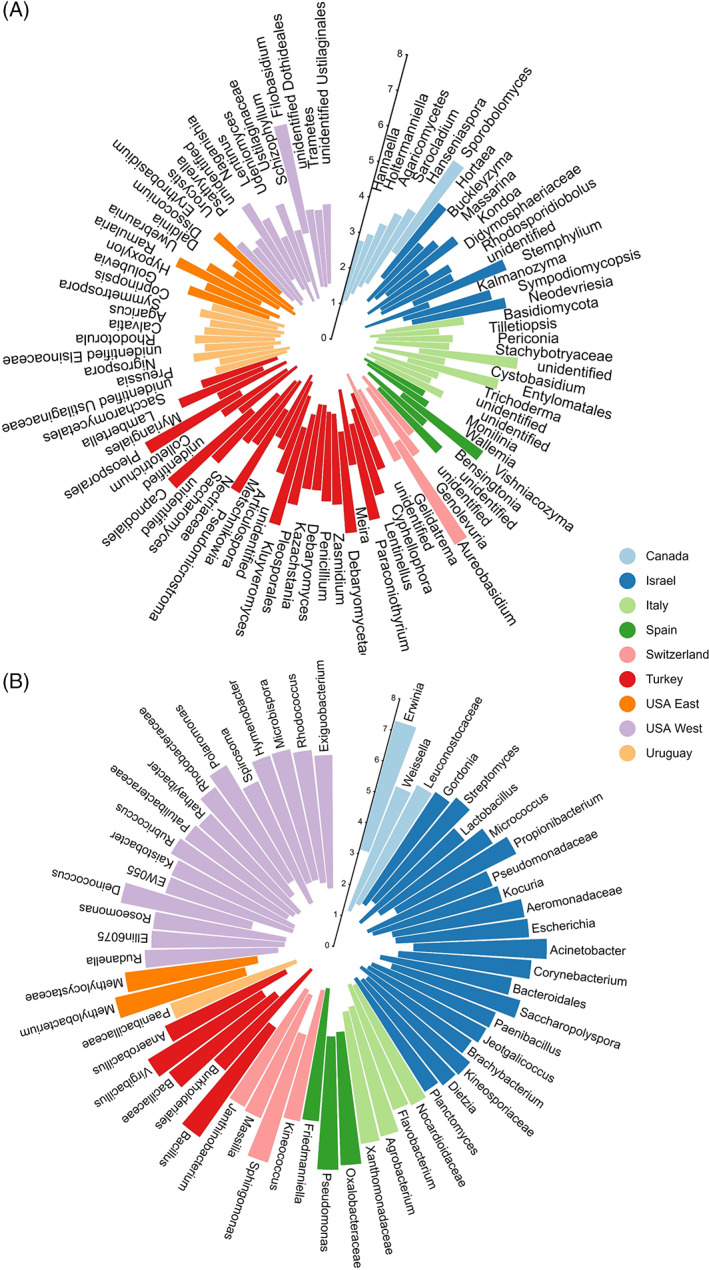
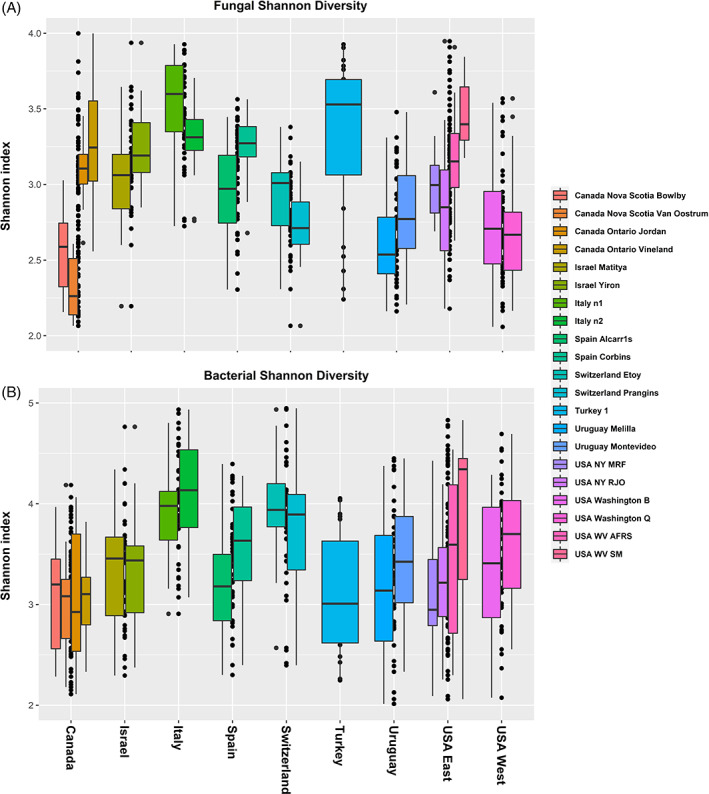
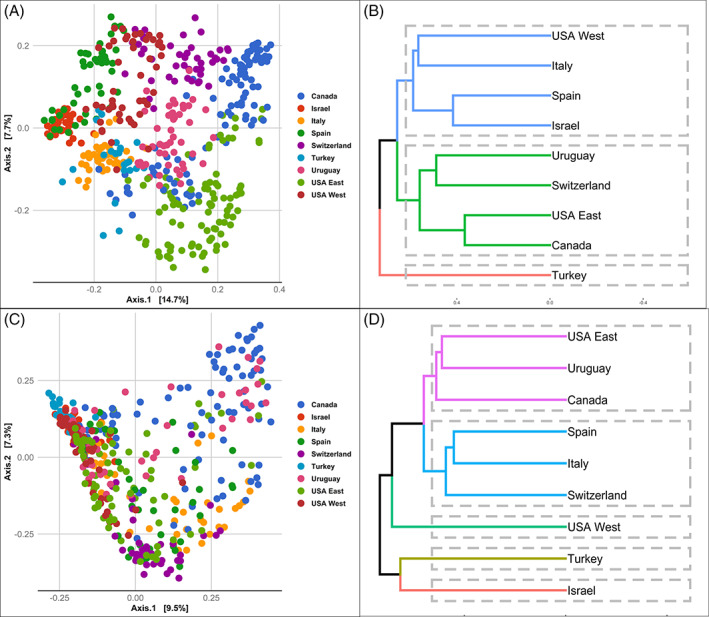
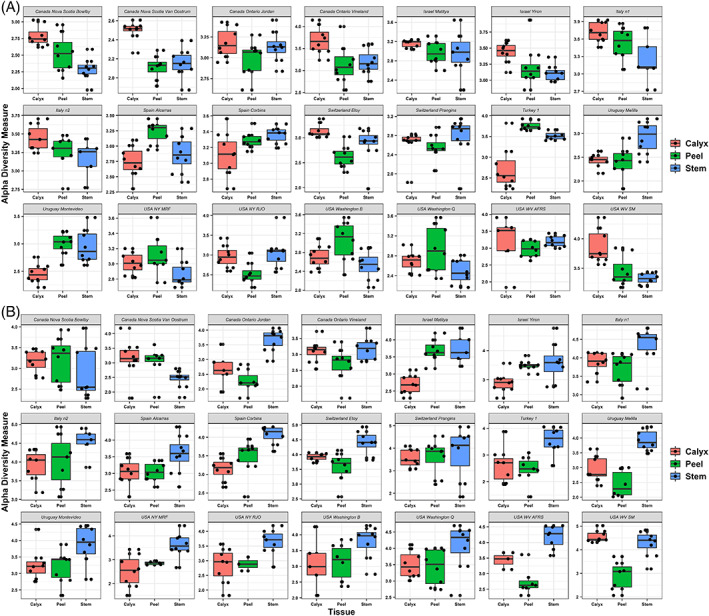
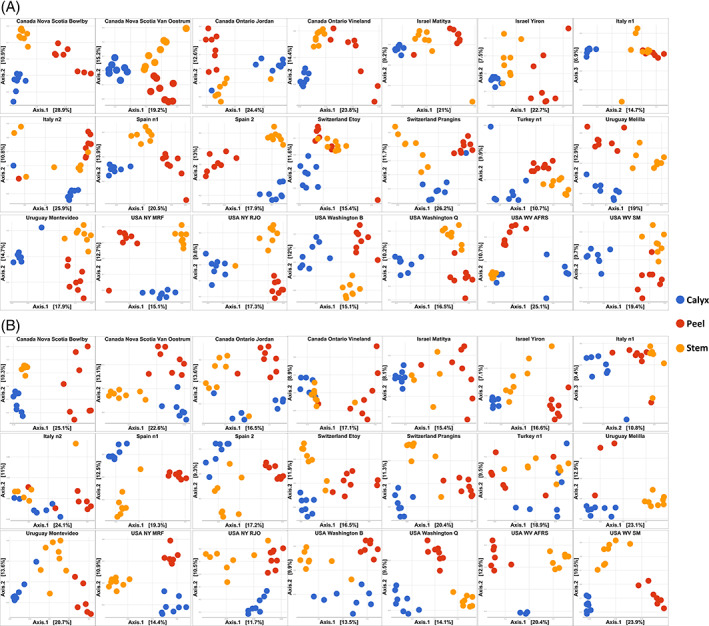
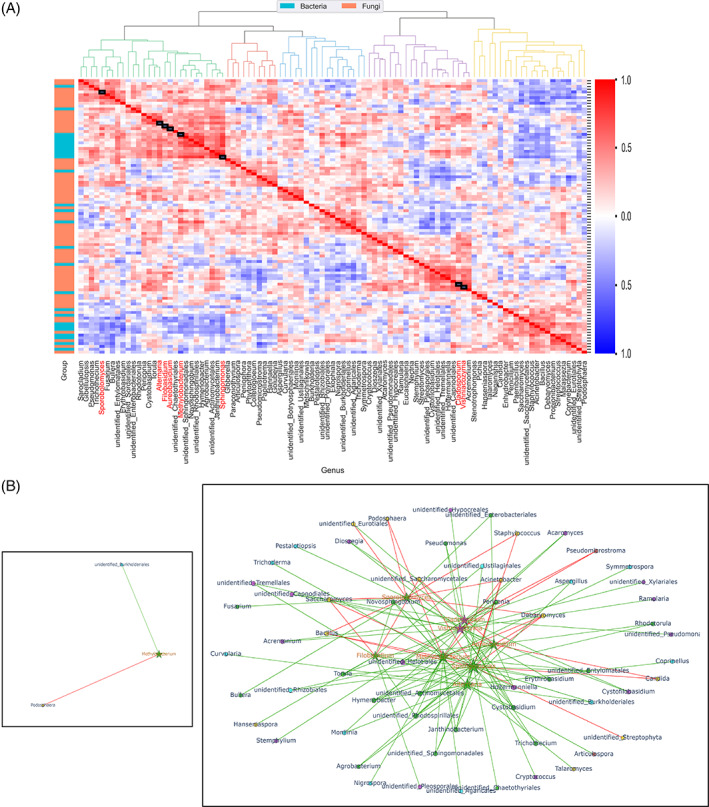
We present the first worldwide study on the apple (Malus × domestica) fruit microbiome that examines questions regarding the composition and the assembly of microbial communities on and in apple fruit. Results revealed that the composition and structure of the fungal and bacterial communities associated with apple fruit vary and are highly dependent on geographical location. The study also confirmed that the spatial variation in the fungal and bacterial composition of different fruit tissues exists at a global level. Fungal diversity varied significantly in fruit harvested in different geographical locations and suggests a potential link between location and the type and rate of postharvest diseases that develop in each country. The global core microbiome of apple fruit was represented by several beneficial microbial taxa and accounted for a large fraction of the fruit microbial community. The study provides foundational information about the apple fruit microbiome that can be utilized for the development of novel approaches for the management of fruit quality and safety, as well as for reducing losses due to the establishment and proliferation of postharvest pathogens. It also lays the groundwork for studying the complex microbial interactions that occur on apple fruit surfaces.


Figures

Fig 1
Fig 1
Circular bar plot of the LDA scores showing a list of (A) fungal and (B) bacterial taxa that best characterize each geographical location i.e. Canada, Turkey, Israel, Italy, Uruguay, USA West, USA East, Switzerland and Spain. Higher LDA score indicate higher consistency of differences in relative abundance between taxa of each country.
Fig 2
Fig 2
Box plots showing the bacterial fungal diversity (Shannon index) of apple samples collected from different countries (Canada, Turkey, Israel, Italy, Uruguay, USA West, USA East, Switzerland and Spain).
Fig 3
Fig 3
PCoA plots of the fungal (A) and bacterial (C) community compositions based on Bray–Curtis dissimilarity distances. Dendrogram of hierarchical clustering showing the similarity between apple fungal (B) and bacterial (D) communities collected from different countries i.e. Canada, Turkey, Israel, Italy, Uruguay, USA West, USA East, Switzerland and Spain. The hierarchical clustering was based Bray Curtis dissimilarity metric using ‘average clustering UPGMA’ and k mean = 4 as implemented in vegan R, where branches colours correspond to clusters.
Fig 4
Fig 4
Boxplots of fungal (top) and bacterial (bottom) Shannon diversity among apple tissues (Calyx, stem and peel) collected from 21 orchards located in eight countries. The figure is arranged in seven columns and three rows for fungi (A) and bacteria (B). Each subpanel corresponds to an orchard. From left to right, the first row shows the results of Nova Scotia Bowlby (Canada), Nova Scotia Van Oostrum (Canada), Ontario Jordan (Canada), Ontario Vineland (Canada), Matitya (Israel), Yiron (Israel) and orchard n1 (Italy). The second row shows the results from orchard n2 (Italy), Corbins (Spain), Alcarràs (Spain), Prangins (Switzerland), Etoy (Switzerland), orchard 1 (Turkey), Melilla (Uruguay). The third row shows the results from Montevideo (Uruguay), MRF (NY, USA), RJO (NY, USA), orchard B (Washington USA), orchard Q (Washington USA), AFRS (WV USA), SM (WV USA). A and B are arranged in the same order.
Fig 5
Fig 5
PCoA plots showing the variation in fungal (A) and bacterial (B) community composition among apple tissue types (Calyx, stem and peel). Analysis were based on Bray Curtis dissimilarity metric of CSS normalized OTU table. The figure is arranged in seven columns and three rows for fungi (A) and bacteria (B). Each subpanel corresponds to an orchard. From left to right, the first row shows the results of Nova Scotia Bowlby (Canada), Nova Scotia Van Oostrum (Canada), Ontario Jordan (Canada), Ontario Vineland (Canada), Matitya (Israel), Yiron (Israel) and orchard n1 (Italy). The second row shows the results from orchard n2 (Italy), Corbins (Spain), Alcarràs (Spain), Prangins (Switzerland), Etoy (Switzerland), orchard 1 (Turkey), Melilla (Uruguay). The third row shows the results from Montevideo (Uruguay), MRF (NY, USA), RJO (NY, USA), orchard B (Washington USA), orchard Q (Washington USA), AFRS (WV USA), SM (WV USA). A and B are arranged in the same order.
Fig 6
Fig 6
Correlation matrix (based on Spearman's rank correlation coefficient) of the abundance profiles of core and non‐core genera from the apple fruit microbiome (27 bacterial and 70 fungal species). ‘Average’ linkage was used for the hierarchical clustering. Dendrogram was divided into five groups by cutting the tree at h = 0.8. Black squares on the diagonal line indicate core species also labelled in red font (A). Co‐occurrence network presenting interactions involving core species. Core and non‐core species are represented by star and circle‐shaped nodes, respectively. Green and red lines (i.e., edges) represent significant positive (r > 0.4, P < 0.01) and negative (r < 0.4, P < 0.01) correlation between two nodes, respectively. The size of each node is proportional to nodes' degree (the number of edges associated with the node). Colours are corresponding to the five key clusters in panel. The black frame highlights positive and negative interaction between a core bacteria (Methylobacterium) and potential biocontrol agent (Burkholderiales) and pathogen, respectively (Podosphaera) (B). An interactive version of the network is available in Data S4.

References

    1. Abarenkov, K. , Henrik Nilsson, R. , Larsson, K.‐H. , Alexander, I.J. , Eberhardt, U. , Erland, S. , et al. (2010) The UNITE database for molecular identification of fungi – recent updates and future perspectives. New Phytol 186: 281–285. - PubMed
    1. Abdelfattah, A. , Li Destri Nicosia, M.G. , Cacciola, S.O. , Droby, S. , and Schena, L. (2015) Metabarcoding analysis of fungal diversity in the Phyllosphere and Carposphere of olive (Olea europaea). PLOS ONE 10: e0131069. - PMC - PubMed
    1. Abdelfattah, A. , Malacrinò, A. , Wisniewski, M. , Cacciola, S.O. , and Schena, L. (2018a) Metabarcoding: a powerful tool to investigate microbial communities and shape future plant protection strategies. Biol Control 120: 1–10.
    1. Abdelfattah, A. , Ruano‐Rosa, D. , Cacciola, S.O. , Li Destri Nicosia, M.G. , and Schena, L. (2018b) Impact of Bactrocera oleae on the fungal microbiota of ripe olive drupes. PLOS ONE 13: e0199403. - PMC - PubMed
    1. Abdelfattah, A. , Sanzani, S.M. , Wisniewski, M. , Berg, G. , Cacciola, S.O. , and Schena, L. (2019). Revealing cues for fungal interplay in the plant–air interface in vineyards. Frontiers in Plant Science, 10. 10.3389/fpls.2019.00922. - DOI - PMC - PubMed

Publication types