

Variation in COVID-19 Mortality Across 117 US Hospitals in High- and Low-Burden Settings
- PMID: 33734977
- PMCID: PMC8025591
- DOI: 10.12788/jhm.3612
Variation in COVID-19 Mortality Across 117 US Hospitals in High- and Low-Burden Settings
Abstract
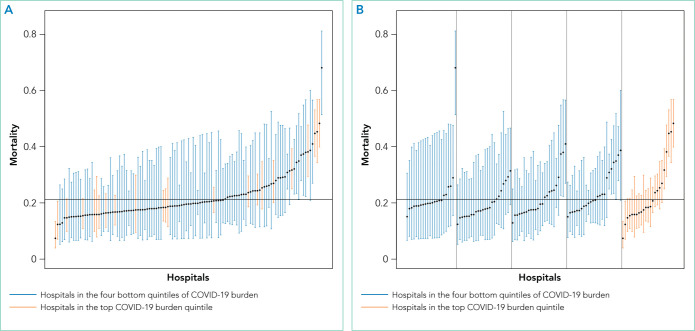
Some hospitals have faced a surge of patients with COVID-19, while others have not. We assessed whether COVID-19 burden (number of patients with COVID-19 admitted during April 2020 divided by hospital certified bed count) was associated with mortality in a large sample of US hospitals. Our study population included 14,226 patients with COVID-19 (median age 66 years, 45.2% women) at 117 hospitals, of whom 20.9% had died at 5 weeks of follow-up. At the hospital level, the observed mortality ranged from 0% to 44.4%. After adjustment for age, sex, and comorbidities, the adjusted odds ratio for in-hospital death in the highest quintile of burden was 1.46 (95% CI, 1.07-2.00) compared to all other quintiles. Still, there was large variability in outcomes, even among hospitals with a similar level of COVID-19 burden and after adjusting for age, sex, and comorbidities.
Figures
Comment in
-
Hospital-Level Variability in Outcomes of Patients With COVID-19.J Hosp Med. 2021 Apr;16(4):255. doi: 10.12788/jhm.3617. J Hosp Med. 2021. PMID: 33822714 Free PMC article. No abstract available.
References
-
- Centers for Disease Control and Prevention; [Accessed December 29, 2020]. Evidence used to update the list of underlying medical conditions that increase a person’s risk of severe illness from COVID-19. Updated November 2, 2020. https://www.cdc.gov/coronavirus/2019-ncov/need-extra-precautions/evidenc.... - PubMed
-
- Centers for Disease Control and Prevention; [Accessed June 2, 2020]. ICD-10-CM official coding and reporting guidelines April 1, 2020 through September 30, 2020. https://www.cdc.gov/nchs/data/icd/COVID-19-guidelines-final.pdf.
Publication types
MeSH terms
Grants and funding
LinkOut - more resources
Full Text Sources
Other Literature Sources
Medical
Miscellaneous
