. 2021 Mar 18;13(6):9085-9107.
doi: 10.18632/aging.202789. Epub 2021 Mar 18.

Nidogen-1 expression is associated with overall survival and temozolomide sensitivity in low-grade glioma patients

Affiliations

Nidogen-1 expression is associated with overall survival and temozolomide sensitivity in low-grade glioma patients

Baiwei Zhang et al. Aging (Albany NY). .

Abstract

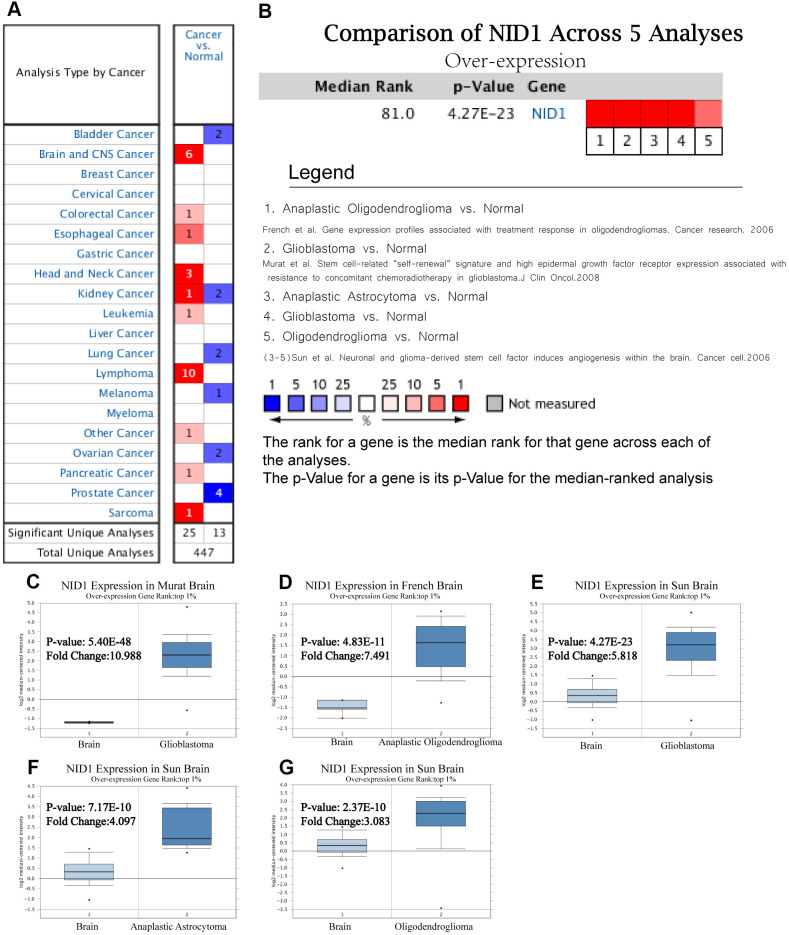
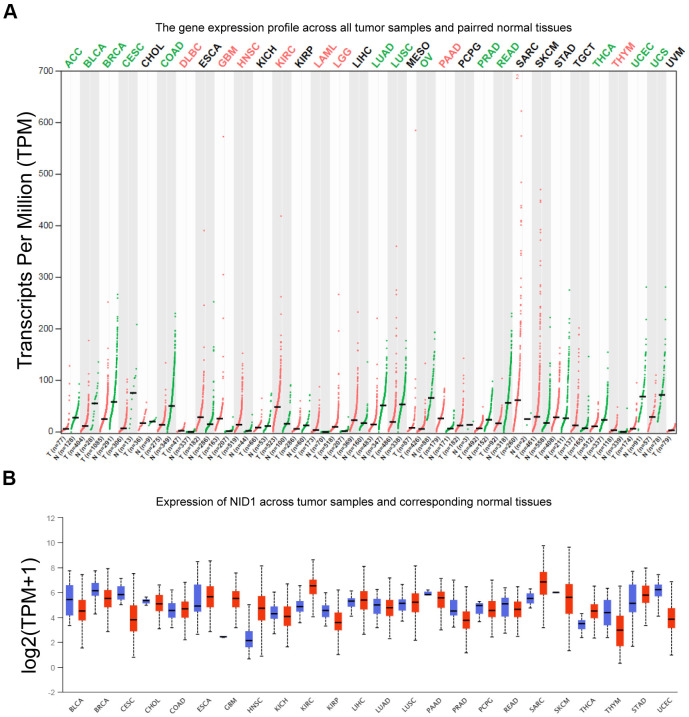
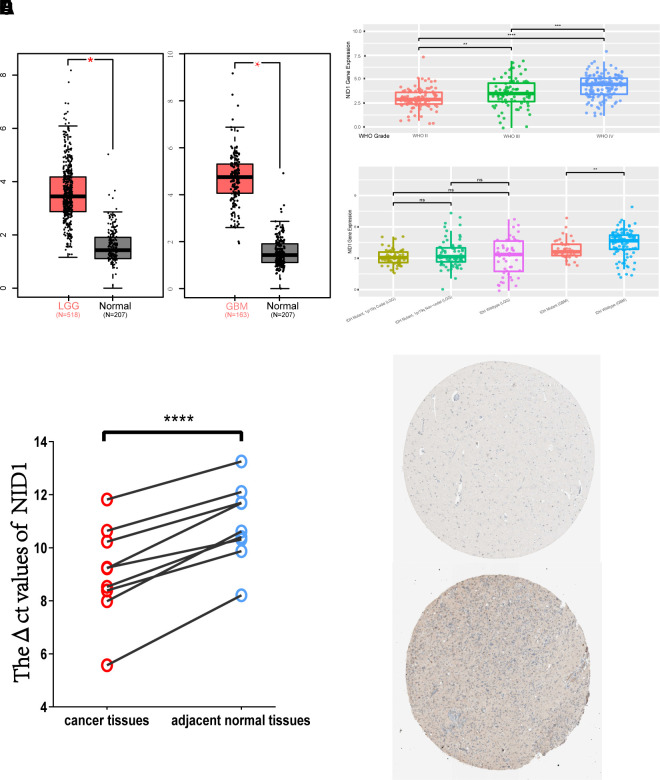
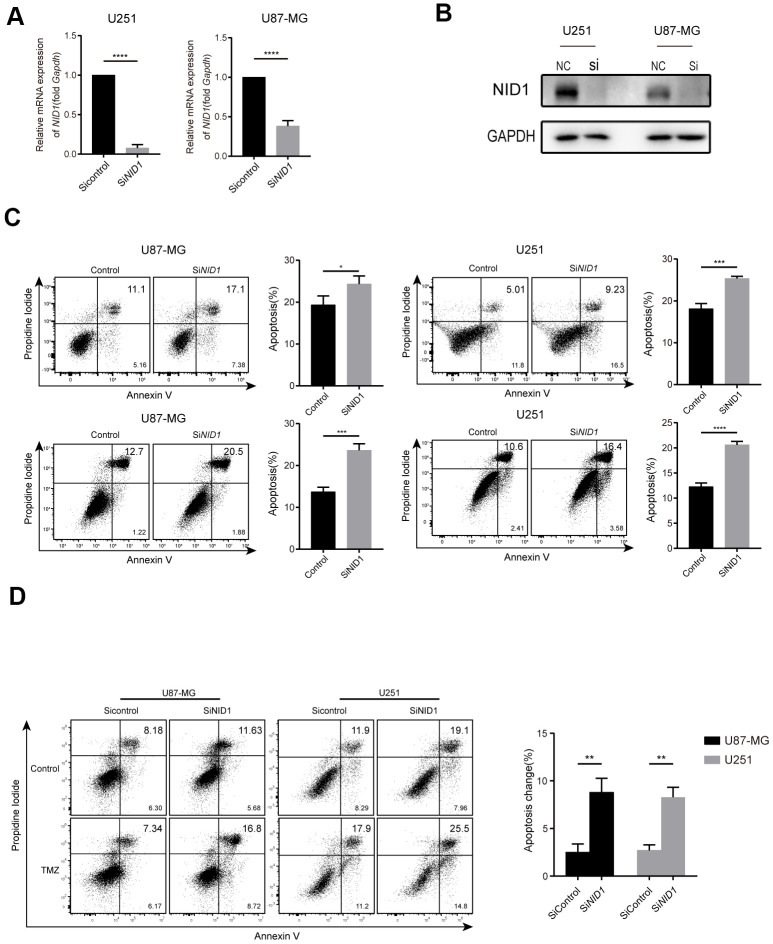
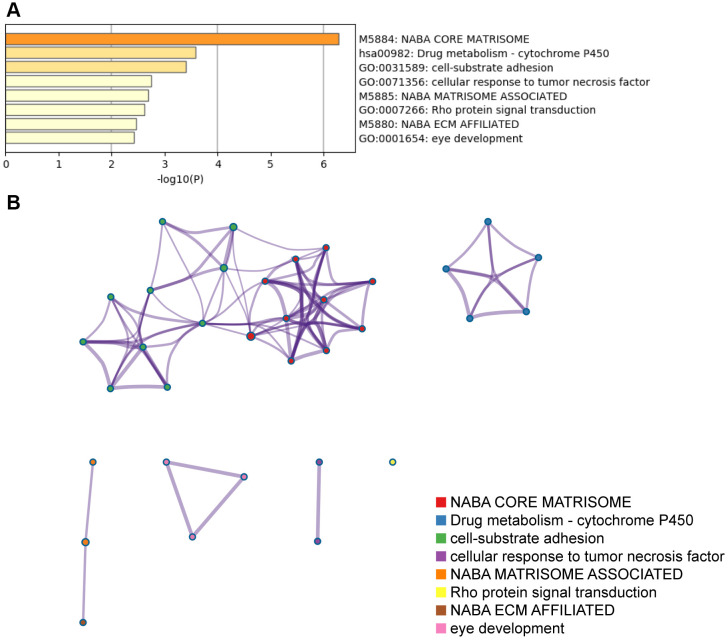
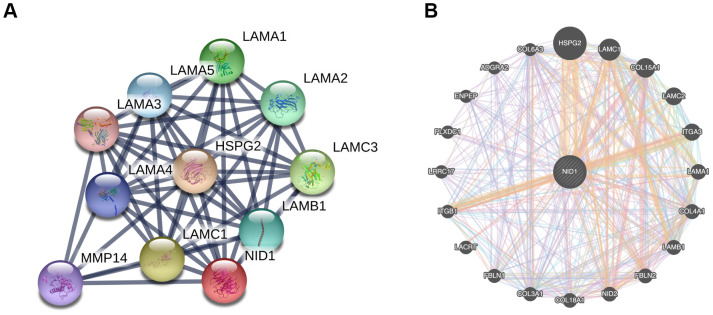
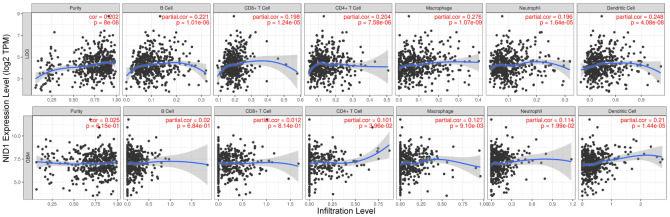
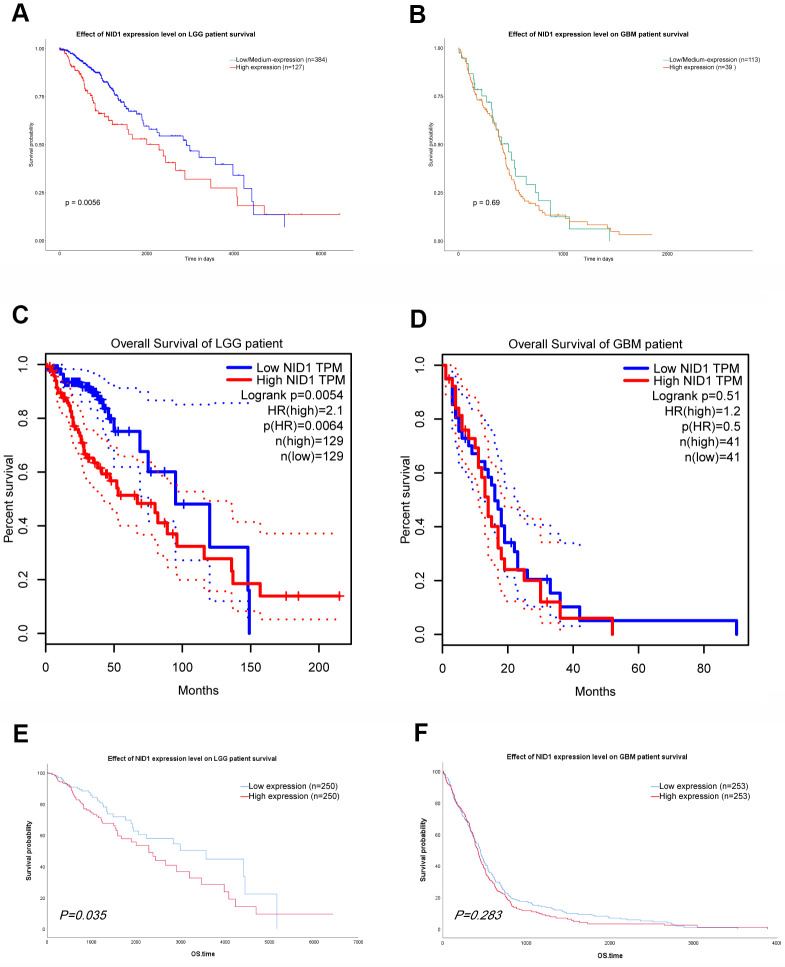
We investigated the prognostic significance of nidogen-1 (NID1) in glioma. Oncomine, GEPIA, UALCAN, CCGA database analyses showed that NID1 transcript levels were significantly upregulated in multiple cancer types, including gliomas. Quantitative RT-PCR analyses confirmed that NID1 expression was significantly upregulated in glioma tissues compared to paired adjacent normal brain tissue samples (n=9). NID1 silencing enhanced in vitro apoptosis and the temozolomide sensitivity of U251 and U87-MG glioma cells. Protein-protein interaction network analysis using the STRING and GeneMANIA databases showed that NID1 interacts with several extracellular matrix proteins. TIMER database analysis showed that NID1 expression in low-grade gliomas was associated with tumor infiltration of B cells, CD4+ and CD8+ T cells, macrophages, neutrophils, and dendritic cells. Kaplan-Meier survival curve analysis showed that low-grade gliomas patients with high NID1 expression were associated with shorter overall survival. However, NID1 expression was not associated with overall survival in glioblastoma multiforme patients. These findings demonstrate that NID1 expression in glioma tissues is associated with overall survival of low-grade glioma patients and temozolomide sensitivity. NID1 is thus a potential prognostic biomarker and therapeutic target in low-grade glioma patients.

Keywords: NID1; apoptosis; basement membrane; glioma; temozolomide.


Conflict of interest statement

CONFLICTS OF INTEREST: The authors declare that they have no conflicts of interest.

Figures

Figure 1
Figure 1
NID1 is overexpressed in several cancers including different types of glioma. (A) Summary of NID1 expression analyses in multiple cancer types and their corresponding normal tissues. (B) Summary of NID1 expression analyses in five studies related to brain and CNS cancers. Note: P< 0.001 indicates statistical significance. Red color indicates high NID1 expression in the corresponding cancer and blue color indicates low NID1 expression in the corresponding cancer. (CG) NID1 expression in (C) Murat brain (normal brain vs. glioblastoma), (D) French brain (normal brain vs. anaplastic oligodendroglioma), (E) Sun brain ((normal brain vs. glioblastoma), (F) Sun brain (normal brain vs. anaplastic astrocytoma), and (G) Sun brain (normal brain vs. oligodendroglioma) datasets are shown. Note: P<0.01 indicates statistical significance; NID1 was among the top 1% overexpressed genes in all five different grades of glioma.
Figure 2
Figure 2
NID1 expression in pan-cancer tissues from GEPIA and UACLAN databases. (A) NID1 transcript levels in paired tumor and normal tissue samples from the GEPIA database. Red dots represent NID1 expression in tumor samples; green dots indicate NID1 expression in the corresponding normal tissues; black line indicates median NID1 expression; tumor names highlighted in green indicate NID1 downregulation; tumor names highlighted in red indicate NID1 upregulation; tumor names highlighted in black indicate normal NID1 expression; T= tumor tissue; N= normal tissue. (B) Validation of NID1 expression levels in different cancers from the UALCAN database. The red boxes represent NID1 expression in tumor tissues and blue boxes represent NID1 expression in the corresponding normal tissues.
Figure 3
Figure 3
NID1 mRNA and protein expression in different grades of gliomas. (A) NID1 transcript expression levels in low-grade glioma (LGG; red; n=518), glioblastoma multiforme (GBM; red; n=163) and corresponding normal brain tissues (black; n=207) from the GEPIA datasets. (B) NID1 expression levels in different grades of glioma (WHO grades II, III, and IV) from the CCGA dataset. As shown, NID1 expression levels are significantly higher in WHO grades III and IV compared to WHO grade II. (C) NID1 expression levels in LGG and GBM patients belonging to IDH mutant and wild-type genotypes from the CCGA datasets. As shown, IDH mutant GBM patients show lower NID1 levels compared to the IDH wild-type GBM patients. NID1 levels in IDH mutant and wild-type LGG patients are comparable and not statistically significant. (D) NID1 expression is upregulated in all 9 glioma tissue samples compared to their corresponding normal brain tissue samples. Red circles represent glioma tissues and blue circles represent normal brain tissues. Higher ΔCt value represents lower NID1 expression. (E) Representative IHC-stained brain section images from the HPA database show NID1 expression in normal healthy individual (patient i.d. 2521) and glioma patient (patient id: 3092). Blue staining represents anti-NID1 antibody staining. Note: * P<0.05;** P<0.01;*** P<0.001;**** P<0.0001.
Figure 4
Figure 4
NID1 silencing in U87-MG and U251 glioma cells enhanced apoptosis and sensitivity to TMZ. (A) QRT-PCR analysis shows NID1 mRNA levels in si-NID1- and si-NC-transfected U251 and U87-MG glioma cell lines. (B) Representative western blot shows NID1 protein levels in si-NID1- and si-NC-transfected U251 and U87-MG glioma cell lines. (C) Representative FACS plots and histograms show percentage apoptosis in si-NID1- and si-NC-transfected U251 and U87-MG glioma cells based on AnnexinV-FITC/PI staining. (D) Representative FACS plots and histograms show percentage apoptosis in si-NID1- and si-NC-transfected U251 and U87-MG glioma cells treated with or without TMZ. As shown, NID1 silencing improved temozolomide (TMZ) sensitivity in glioma cells. Note: * P<0.05;** P<0.01;*** P<0.001;**** P<0.0001.
Figure 5
Figure 5
The top GO terms and pathways related to top 100 NID1-related genes in GBM tissues. (A) Heatmap shows top GO terms and (KEGG/Canonical) pathways related to the top 100 NID1-related genes expressed in GBM tissues. The -log10P values are plotted on the X-axis. (B) The network of enriched gene sets representing the top 100 NID1-related genes expressed in GBM tissues.
Figure 6
Figure 6
PPI networks of NID1 and its interacting protein partners. (A) PPI network constructed using the STRING database shows NID1 and the NID1-interacting proteins. The line thickness indicates strength of interaction between any two proteins. (B) GeneMANIA database analysis shows that NID1 interacts with ECM proteins such as HSPG2, LAMC1, and others.
Figure 7
Figure 7
Higher NID1 expression correlates with increased tumor infiltration of multiple immune cell types. TIMER database analysis shows correlation between NID1 expression levels in LGG (top) and GBM (bottom) patient tissues and tumor infiltration levels of immune cell types, namely, B cells, CD8+ T cells, CD4+T cells, macrophages, neutrophils, and dendritic cells. Each dot corresponds to a glioma patient (LGG or GBM). The blue line represents median levels of tumor-infiltrated immune cells.
Figure 8
Figure 8
NID1 expression correlates with overall survival of LGG patients. (A, B) Kaplan-Meier survival curves show overall survival of low- and high-NID1-expressing LGG and GBM patients from the UALCAN database. (C, D) Kaplan-Meier survival curves show overall survival of low- and high-NID1-expressing LGG and GBM patients from the GEPIA database. HR refers to hazard ratio. (E, F) Kaplan-Meier survival curves show overall survival of low- and high-NID1-expressing LGG and GBM patients from the TCGA database. Note: Blue represents low NID1 expression; red represents high NID1 expression.

Similar articles

Cited by

References

    1. Nabors LB, Portnow J, Ammirati M, Baehring J, Brem H, Butowski N, Fenstermaker RA, Forsyth P, Hattangadi-Gluth J, Holdhoff M, Howard S, Junck L, Kaley T, et al.. NCCN guidelines insights: central nervous system cancers, version 1.2017. J Natl Compr Canc Netw. 2017; 15:1331–45. 10.6004/jnccn.2017.0166 - DOI - PubMed
    1. Chen R, Smith-Cohn M, Cohen AL, Colman H. Glioma subclassifications and their clinical significance. Neurotherapeutics. 2017; 14:284–97. 10.1007/s13311-017-0519-x - DOI - PMC - PubMed
    1. Bedard PL, Hyman DM, Davids MS, Siu LL. Small molecules, big impact: 20 years of targeted therapy in oncology. Lancet. 2020; 395:1078–88. 10.1016/S0140-6736(20)30164-1 - DOI - PubMed
    1. Lapointe S, Perry A, Butowski NA. Primary brain tumours in adults. Lancet. 2018; 392:432–46. 10.1016/S0140-6736(18)30990-5 - DOI - PubMed
    1. Le Rhun E, Preusser M, Roth P, Reardon DA, van den Bent M, Wen P, Reifenberger G, Weller M. Molecular targeted therapy of glioblastoma. Cancer Treat Rev. 2019; 80:101896. 10.1016/j.ctrv.2019.101896 - DOI - PubMed

Publication types