. 2021 Mar 19;70(11):382-388.
doi: 10.15585/mmwr.mm7011e1.

Racial and Ethnic Disparities in COVID-19 Incidence by Age, Sex, and Period Among Persons Aged <25 Years - 16 U.S. Jurisdictions, January 1-December 31, 2020

Racial and Ethnic Disparities in COVID-19 Incidence by Age, Sex, and Period Among Persons Aged <25 Years - 16 U.S. Jurisdictions, January 1-December 31, 2020

Miriam E Van Dyke et al. MMWR Morb Mortal Wkly Rep. .

Abstract

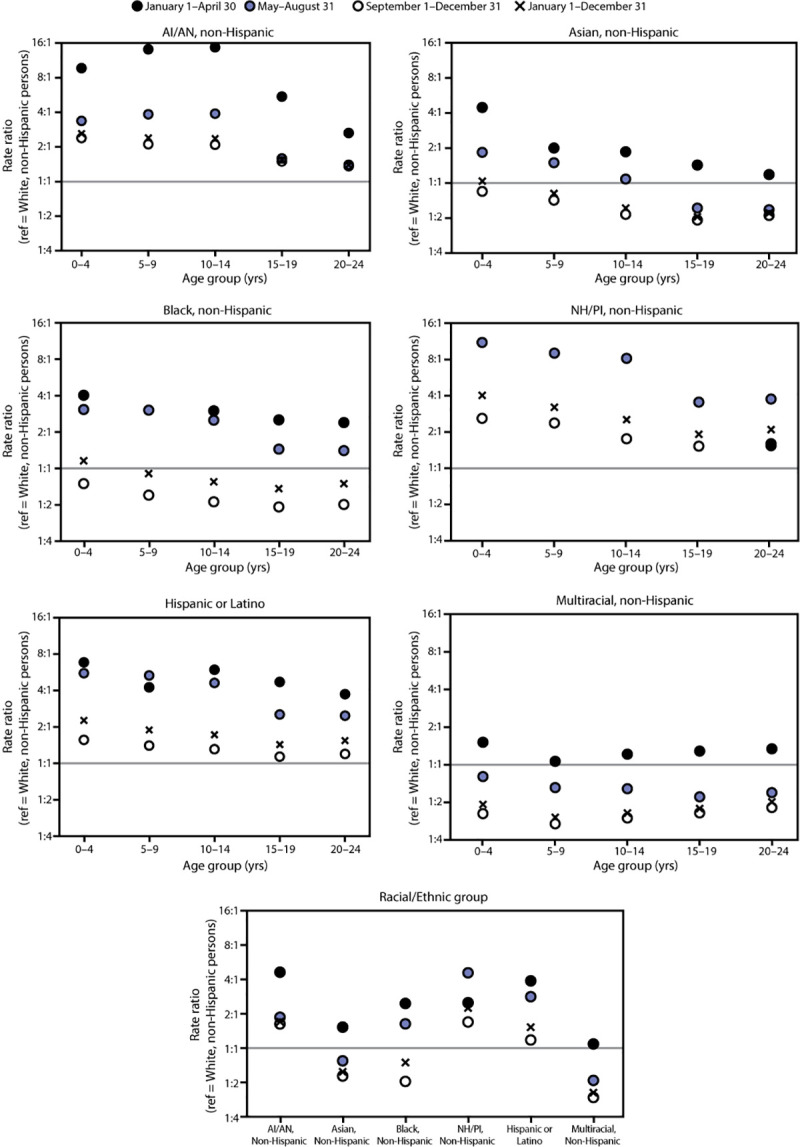
The COVID-19 pandemic has disproportionately affected racial and ethnic minority groups in the United States. Whereas racial and ethnic disparities in severe COVID-19-associated outcomes, including mortality, have been documented (1-3), less is known about population-based disparities in infection with SARS-CoV-2, the virus that causes COVID-19. In addition, although persons aged <30 years account for approximately one third of reported infections,§ there is limited information on racial and ethnic disparities in infection among young persons over time and by sex and age. Based on 689,672 U.S. COVID-19 cases reported to CDC's case-based surveillance system by jurisdictional health departments, racial and ethnic disparities in COVID-19 incidence among persons aged <25 years in 16 U.S. jurisdictions were described by age group and sex and across three periods during January 1-December 31, 2020. During January-April, COVID-19 incidence was substantially higher among most racial and ethnic minority groups compared with that among non-Hispanic White (White) persons (rate ratio [RR] range = 1.09-4.62). During May-August, the RR increased from 2.49 to 4.57 among non-Hispanic Native Hawaiian and Pacific Islander (NH/PI) persons but decreased among other racial and ethnic minority groups (RR range = 0.52-2.82). Decreases in disparities were observed during September-December (RR range = 0.37-1.69); these decreases were largely because of a greater increase in incidence among White persons, rather than a decline in incidence among racial and ethnic minority groups. NH/PI, non-Hispanic American Indian or Alaska Native (AI/AN), and Hispanic or Latino (Hispanic) persons experienced the largest persistent disparities over the entire period. Ensuring equitable and timely access to preventive measures, including testing, safe work and education settings, and vaccination when eligible is important to address racial/ethnic disparities.


Conflict of interest statement

All authors have completed and submitted the International Committee of Medical Journal Editors form for disclosure of potential conflicts of interest. No potential conflicts of interest were disclosed.

Figures

FIGURE
FIGURE
Rate ratios comparing COVID-19 incidence among racial and ethnic minority persons to COVID-19 incidence among non-Hispanic White persons, among persons aged <25 years, by age group in three periods — 16 U.S. jurisdictions, January 1–December 31, 2020 Abbreviations: AI/AN=American Indian or Alaska Native; NH/PI=Native Hawaiian and Pacific Islander; ref = referent group. * Rate ratios were calculated during each period and overall. Data used to generate this figure are included in the Supplementary Table, https://stacks.cdc.gov/view/cdc/103733. Rate ratios are not available in situations where data were suppressed because of <20 cases being reported for a given race/ethnicity and age group during a period. During January 1–April 30, 2020, <20 cases were reported for non-Hispanic NH/PI persons aged 0–4, 5–9, 10–14, and 15–19 years. Rate ratios were similar and thus corresponding rate ratio symbols overlap in the figure for the following categories: AI/AN persons aged 15–19 and 20–24 years during May 1–August 31 and September 1–December 31; Black persons aged 5–9 years during January 1–April 30 and May 1–August 31; and NH/PI persons aged 20–24 years during January 1–April 30 and September 1–December 31. † Rates for each period and for the full period were calculated using the following equation: (cases/population) x 100,000 persons. COVID-19 cases were identified using CDC’s Data Collation and Integration for Public Health Event Response system (https://data.cdc.gov/browse?tags=covid-19 [accessed January 27, 2021]). Case surveillance data were received directly from two jurisdictional health departments (Hawaii State Department of Health and New Mexico Department of Health) for all racial/ethnic groups to allow for separate reporting of NH/PI persons. Population estimates were provided by the 2019 U.S. Census Bureau’s Annual County Resident Population Estimates by Age, Sex, Race, and Hispanic Origin (https://www.census.gov/programs-surveys/popest/technical-documentation/file-layouts.html [accessed August 20, 2020]). § Arkansas, District of Columbia, Florida, Hawaii, Kansas, Kentucky, Maine, Massachusetts, Michigan, Minnesota, New Mexico, Oklahoma, Oregon, Utah, Vermont, and Wisconsin.

References

    1. Bixler D, Miller AD, Mattison CP, et al.; Pediatric Mortality Investigation Team. SARS-CoV-2–associated deaths among persons aged <21 years—United States, February 12–July 31, 2020. MMWR Morb Mortal Wkly Rep 2020;69:1324–9. 10.15585/mmwr.mm6937e4 - DOI - PubMed
    1. Rossen LM, Branum AM, Ahmad FB, Sutton P, Anderson RN. Excess deaths associated with COVID-19, by age and race and ethnicity—United States, January 26–October 3, 2020. MMWR Morb Mortal Wkly Rep 2020;69:1522–7. 10.15585/mmwr.mm6942e2 - DOI - PMC - PubMed
    1. Kim L, Whitaker M, O’Halloran A, et al.; COVID-NET Surveillance Team. Hospitalization rates and characteristics of children aged <18 years hospitalized with laboratory-confirmed COVID-19—COVID-NET, 14 states, March 1–July 25, 2020. MMWR Morb Mortal Wkly Rep 2020;69:1081–8. 10.15585/mmwr.mm6932e3 - DOI - PMC - PubMed
    1. Bailey LC, Razzaghi H, Burrows EK, et al. Assessment of 135 794 pediatric patients tested for severe acute respiratory syndrome coronavirus 2 across the United States. JAMA Pediatr 2021;175:176–84. 10.1001/jamapediatrics.2020.5052 - DOI - PMC - PubMed
    1. Hatcher SM, Agnew-Brune C, Anderson M, et al. COVID-19 among American Indian and Alaska Native persons—23 states, January 31–July 3, 2020. MMWR Morb Mortal Wkly Rep 2020;69:1166–9. 10.15585/mmwr.mm6934e1 - DOI - PMC - PubMed