. 2021 Mar 18;17(3):e1008819.
doi: 10.1371/journal.pcbi.1008819. eCollection 2021 Mar.

Boosting GWAS using biological networks: A study on susceptibility to familial breast cancer

Affiliations

Boosting GWAS using biological networks: A study on susceptibility to familial breast cancer

Héctor Climente-González et al. PLoS Comput Biol. .

Abstract

Genome-wide association studies (GWAS) explore the genetic causes of complex diseases. However, classical approaches ignore the biological context of the genetic variants and genes under study. To address this shortcoming, one can use biological networks, which model functional relationships, to search for functionally related susceptibility loci. Many such network methods exist, each arising from different mathematical frameworks, pre-processing steps, and assumptions about the network properties of the susceptibility mechanism. Unsurprisingly, this results in disparate solutions. To explore how to exploit these heterogeneous approaches, we selected six network methods and applied them to GENESIS, a nationwide French study on familial breast cancer. First, we verified that network methods recovered more interpretable results than a standard GWAS. We addressed the heterogeneity of their solutions by studying their overlap, computing what we called the consensus. The key gene in this consensus solution was COPS5, a gene related to multiple cancer hallmarks. Another issue we observed was that network methods were unstable, selecting very different genes on different subsamples of GENESIS. Therefore, we proposed a stable consensus solution formed by the 68 genes most consistently selected across multiple subsamples. This solution was also enriched in genes known to be associated with breast cancer susceptibility (BLM, CASP8, CASP10, DNAJC1, FGFR2, MRPS30, and SLC4A7, P-value = 3 × 10⁻⁴). The most connected gene was CUL3, a regulator of several genes linked to cancer progression. Lastly, we evaluated the biases of each method and the impact of their parameters on the outcome. In general, network methods preferred highly connected genes, even after random rewirings that stripped the connections of any biological meaning. In conclusion, we present the advantages of network-guided GWAS, characterize their shortcomings, and provide strategies to address them. To compute the consensus networks, implementations of all six methods are available at https://github.com/hclimente/gwas-tools.


Conflict of interest statement

The authors have declared that no competing interests exist.

Figures
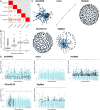
Fig 1
Fig 1. Overview of the solutions produced by the different network methods (Section 2.3.3) on the GENESIS dataset.
As LEAN did not produce any significant solution (BH adjusted P-value < 0.05), it is not shown. Unless indicated otherwise, results refer to SNPs for SConES GI, and to genes for the other methods. (A) Overlap between the genes selected by each method, measured by Pearson correlation between indicator vectors (Sections 2.5.1 and 2.3.5). (B) Distribution of VEGAS2 P-values of the genes in the PPIN not selected by any network method (12 213), and of those selected by 1 (575), 2 (73), or 3 (20) methods. (C) Solution networks produced by the different methods. (D) Manhattan plots of SNPs/genes; in black, the method’s solution. The red line indicates the Bonferroni threshold (2.54 × 10⁻⁷ for SNPs, 1.53 × 10⁻⁶ for genes).
Fig 2
Fig 2. Consensus solution on GENESIS (Section 2.3.3).
(A) Manhattan plot of genes; in black, the ones in the consensus solution. The red line indicates the Bonferroni threshold (1.53 × 10⁻⁶ for genes). (B) Consensus network. Each gene is represented by a pie chart, which shows the methods that selected it. We enlarged the two most central genes (COPS5 and OFD1), the known breast cancer susceptibility genes, and the BCAC-significant genes (Section 2.6). (C) The nodes are in the same disposition as in panel B, but we indicated every gene name. We colored in pink the names of known breast cancer susceptibility genes and BCAC-significant genes.
Fig 3
Fig 3. Comparison of network methods on GENESIS.
Each method was run 5 times on a random subset containing 80% of the samples and tested on the remaining samples (Section 2.5). As LEAN did not select any gene, we excluded it from panels A and B. (A) Number of SNPs selected by each method and number of SNPs in the active set (i.e., the number of SNPs selected by the classifier, Section 2.5.2). Points are the average over the 5 runs; the error bars represent the standard error of the mean. A grey diagonal line with slope 1 is added for comparison, indicating the upper bound of the active set. For reference, the active set of the classifier using all the SNPs as input included, on average, 154 117.4 SNPs. (B) Pairwise Pearson correlations of the solutions produced by different methods. A Pearson correlation of 1 means the two solutions are the same. (C) Runtime of the evaluated methods, by type of network used (PPIN or SNP). For gene-based methods, inverted triangles represent the runtime of the algorithm alone, and circles the total time, which includes the algorithm themselves and the additional 119 980 seconds (1 day and 9.33 hours) that VEGAS2 took on average to compute the gene scores from SNP summary statistics. (D) True positive rate and false positive rate of the methods, obtained using different parameter combinations (Section 3.7). We used as true positives BCAC-significant SNPs (for SConES and χ2 + Bonferroni) and genes (for the remaining methods, Section 2.6). We used the whole dataset in this panel.
Fig 4
Fig 4. Drawbacks encountered when using network methods.
(A) DmGWAS solution, with the genes colored according to the -log10 of their P-value. (B) Number of times a gene was selected by either dmGWAS, heinz, LEAN, or SigMod in 100 rewirings of the PPIN (Section 2.4) and its betweenness. (C) Betweenness and -log10 of the VEGAS2 P-value in BCAC for each of the nodes in the PPIN. We highlighted the genes selected by each method and the ones selected by more than one (“Consensus”). We labeled the three most central genes that were picked by any method. (D) Overlap between the solutions of SConES GS, GM, or GI. Barplots are colored based on whether the SNPs map to a gene or not (Section 2.3.5).
Fig 5
Fig 5. Stable consensus solution on GENESIS (Section 3.8).
(A) Manhattan plot of genes; in black, the ones in the stable consensus solution. The red line indicates the Bonferroni threshold (1.53 × 10⁻⁶ for genes). (B) Stable consensus network. Each gene is represented by a pie chart, which shows the methods that selected it. We enlarged the most central gene (CUL3), the known breast cancer susceptibility genes, and the BCAC-significant genes (Section 2.6). (C) The nodes are in the same disposition as in panel B, but we indicated every gene name. We colored in pink the names of known breast cancer susceptibility genes and BCAC-significant genes.

References

    1. Bush WS, Moore JH. Chapter 11: Genome-Wide Association Studies. PLoS Computational Biology. 2012;8(12):e1002822. 10.1371/journal.pcbi.1002822 - DOI - PMC - PubMed
    1. Buniello A, MacArthur JA, Cerezo M, Harris LW, Hayhurst J, Malangone C, et al.. The NHGRI-EBI GWAS Catalog of published genome-wide association studies, targeted arrays and summary statistics 2019. Nucleic Acids Research. 2019;47(D1):D1005–D1012. 10.1093/nar/gky1120 - DOI - PMC - PubMed
    1. Visscher PM, Wray NR, Zhang Q, Sklar P, McCarthy MI, Brown MA, et al.. 10 Years of GWAS Discovery: Biology, Function, and Translation. The American Journal of Human Genetics. 2017;101(1):5–22. 10.1016/j.ajhg.2017.06.005 - DOI - PMC - PubMed
    1. Wang MH, Cordell HJ, Van Steen K. Statistical methods for genome-wide association studies. Seminars in Cancer Biology. 2018. - PubMed
    1. Barton NH, Etheridge AM, Véber A. The infinitesimal model: Definition, derivation, and implications. Theoretical Population Biology. 2017;118:50–73. 10.1016/j.tpb.2017.06.001 - DOI - PubMed

Publication types

Supplementary concepts