

Measuring inter- and intra-individual differences in visual scan patterns in a driving simulator experiment using active information storage
- PMID: 33735199
- PMCID: PMC7971706
- DOI: 10.1371/journal.pone.0248166
Measuring inter- and intra-individual differences in visual scan patterns in a driving simulator experiment using active information storage
Abstract
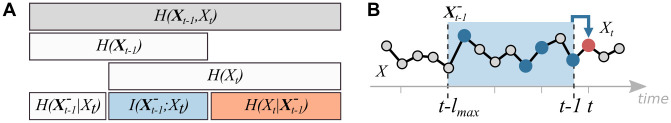
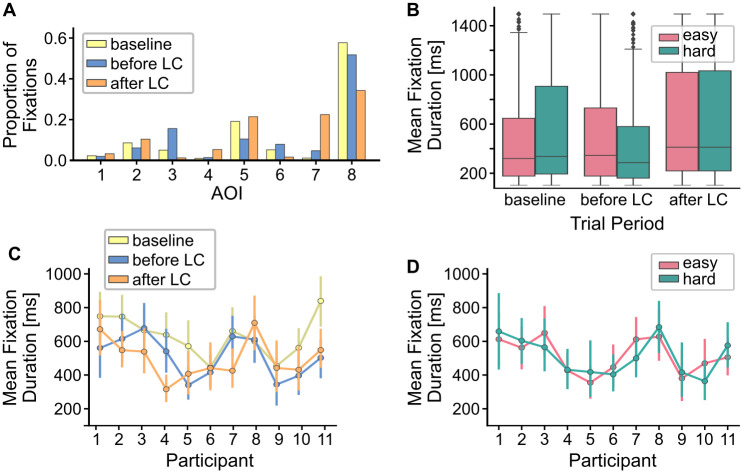
Scan pattern analysis has been discussed as a promising tool in the context of real-time gaze-based applications. In particular, information-theoretic measures of scan path predictability, such as the gaze transition entropy (GTE), have been proposed for detecting relevant changes in user state or task demand. These measures model scan patterns as first-order Markov chains, assuming that only the location of the previous fixation is predictive of the next fixation in time. However, this assumption may not be sufficient in general, as recent research has shown that scan patterns may also exhibit more long-range temporal correlations. Thus, we here evaluate the active information storage (AIS) as a novel information-theoretic approach to quantifying scan path predictability in a dynamic task. In contrast to the GTE, the AIS provides means to statistically test and account for temporal correlations in scan path data beyond the previous last fixation. We compare AIS to GTE in a driving simulator experiment, in which participants drove in a highway scenario, where trials were defined based on an experimental manipulation that encouraged the driver to start an overtaking maneuver. Two levels of difficulty were realized by varying the time left to complete the task. We found that individual observers indeed showed temporal correlations beyond a single past fixation and that the length of the correlation varied between observers. No effect of task difficulty was observed on scan path predictability for either AIS or GTE, but we found a significant increase in predictability during overtaking. Importantly, for participants for which the first-order Markov chain assumption did not hold, this was only shown using AIS but not GTE. We conclude that accounting for longer time horizons in scan paths in a personalized fashion is beneficial for interpreting gaze pattern in dynamic tasks.
Conflict of interest statement
We further want to state that our affiliation to the Honda Research Institute Europe GmbH does not alter our adherence to PLOS ONE policies on sharing data and materials.
Figures


Similar articles
-
Quantifying the Predictability of Visual Scanpaths Using Active Information Storage.Entropy (Basel). 2021 Jan 29;23(2):167. doi: 10.3390/e23020167. Entropy (Basel). 2021. PMID: 33573069 Free PMC article.
-
Comparing drivers' visual attention at Junctions in Real and Simulated Environments.Appl Ergon. 2019 Oct;80:89-101. doi: 10.1016/j.apergo.2019.05.005. Epub 2019 May 25. Appl Ergon. 2019. PMID: 31280814
-
Adopting an HMI for overtaking assistance - Impact of distance display, advice, and guidance information on driver gaze and performance.Accid Anal Prev. 2023 Oct;191:107204. doi: 10.1016/j.aap.2023.107204. Epub 2023 Jul 14. Accid Anal Prev. 2023. PMID: 37454562
-
In the eye of the beholder: a survey of models for eyes and gaze.IEEE Trans Pattern Anal Mach Intell. 2010 Mar;32(3):478-500. doi: 10.1109/TPAMI.2009.30. IEEE Trans Pattern Anal Mach Intell. 2010. PMID: 20075473 Review.
-
Application of eye-tracking in the testing of drivers: A review of research.Int J Occup Med Environ Health. 2015;28(6):941-54. doi: 10.13075/ijomeh.1896.00317. Int J Occup Med Environ Health. 2015. PMID: 26294197 Review.
Cited by
-
When knowing the activity is not enough to predict gaze.J Vis. 2024 Jul 2;24(7):6. doi: 10.1167/jov.24.7.6. J Vis. 2024. PMID: 38984899 Free PMC article.
References
-
- Ebeid IA, Gwizdka J. Real-Time Gaze Transition Entropy. In: Proceedings of the 2018 ACM Symposium on Eye Tracking Research & Applications. New York, NY, USA: ACM; 2018. p. Article No. 94.
-
- Sendhoff B, Wersing H. Cooperative Intelligence-A Humane Perspective. In: 2020 IEEE International Conference on Human-Machine Systems (ICHMS). IEEE; 2020. p. 1–6.
-
- Chen P, Chen F, Zhang L, Ma X, Pan X. Examining the influence of decorated sidewaall in road tunnels using fMRI technology. Tunnelling and Underground Space Technology. 2020;99:103362. 10.1016/j.tust.2020.103362 - DOI
Publication types
MeSH terms
LinkOut - more resources
Full Text Sources
Other Literature Sources
Miscellaneous
