. 2021 Mar 18;17(3):e1008770.
doi: 10.1371/journal.pcbi.1008770. eCollection 2021 Mar.

Principles for data analysis workflows

Affiliations

Principles for data analysis workflows

Sara Stoudt et al. PLoS Comput Biol. .

Abstract

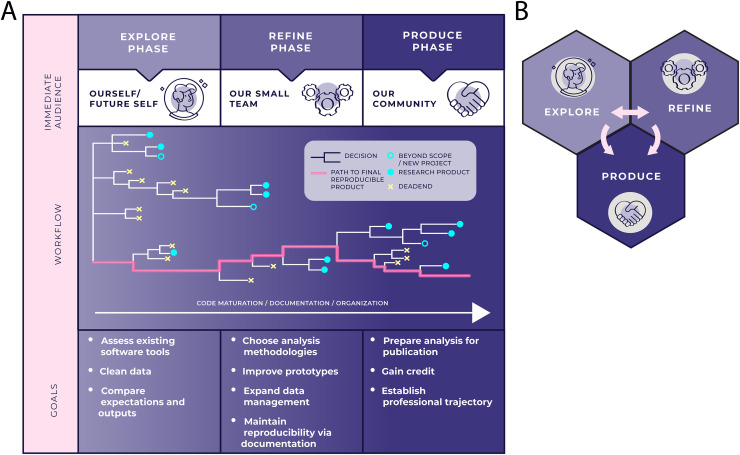
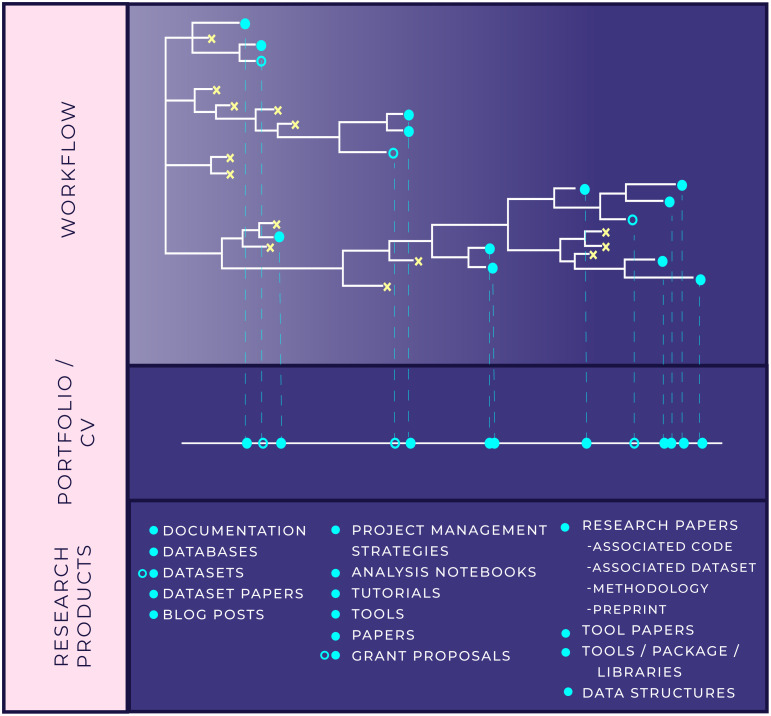
A systematic and reproducible "workflow"-the process that moves a scientific investigation from raw data to coherent research question to insightful contribution-should be a fundamental part of academic data-intensive research practice. In this paper, we elaborate basic principles of a reproducible data analysis workflow by defining 3 phases: the Explore, Refine, and Produce Phases. Each phase is roughly centered around the audience to whom research decisions, methodologies, and results are being immediately communicated. Importantly, each phase can also give rise to a number of research products beyond traditional academic publications. Where relevant, we draw analogies between design principles and established practice in software development. The guidance provided here is not intended to be a strict rulebook; rather, the suggestions for practices and tools to advance reproducible, sound data-intensive analysis may furnish support for both students new to research and current researchers who are new to data-intensive work.


Conflict of interest statement

The authors have declared that no competing interests exist.

Figures

Fig 1
Fig 1. ERP workflow for data-intensive research.
(A) We deconstruct a data-intensive research project into 3 phases, visualizing this process as a tree structure. Each branch in the tree represents a decision that needs to be made about the project, such as data cleaning, refining the scope of the research, or using a particular tool or model. Throughout the natural life of a project, there are many dead ends (yellow Xs). These may include choices that do not work, such as experimentation with a tool that is ultimately not compatible with our data. Dead ends can result in informal learning or procedural fine-tuning. Some dead ends that lie beyond the scope of our current project may turn into a new project later on (open turquoise circles). Throughout the Explore and Refine Phases, we are concurrently in the Produce Phase because research products (closed turquoise circles) can arise at any point throughout the workflow. Products, regardless of the phase that generates their content, contribute to scientific understanding and advance the researcher’s career goals. Thus, the data-intensive research portfolio and corresponding academic CV can be grown at any point in the workflow. (B) The ERP workflow as a nonlinear cycle. Although the tree diagram displayed in Fig 1A accurately depicts the many choices and dead ends that a research project contains, it does not as easily reflect the nonlinearity of the process; Fig 1B’s representation aims to fill this gap. We often iterate between the Explore and Refine Phases while concurrently contributing content to the Produce Phase. The time spent in each phase can vary significantly across different types of projects. For example, hypothesis generation in the Explore Phase might be the biggest hurdle in one project, while effectively communicating a result to a broader audience in the Produce Phase might be the most challenging aspect of another project.
Fig 2
Fig 2. Building our portfolio and CV with ERP.
Research products can build off of content generated in either the Explore or the Refine Phase. As they did in Fig 1A, turquoise circles represent potential research products generated as the project develops Closed circles represents research project within scope of project, while open circles represent beyond scope of current project. This figure emphasizes how those research products project onto a timeline and represent elements in our portfolio of work or lines on a CV. The ERP workflow emphasizes and encourages production, beyond traditional, academic research products, throughout the lifecycle of a data-intensive project rather than just at the very end.

References

    1. Stalzer M, Mentzel C. A preliminary review of influential works in data-driven discovery. Springerplus. 2016;5:1266. 10.1186/s40064-016-2888-8 - DOI - PMC - PubMed
    1. Grüning BA, Lampa S, Vaudel M, Blankenberg D. Software engineering for scientific big data analysis. Gigascience. 2019;8. 10.1093/gigascience/giz054 - DOI - PMC - PubMed
    1. Robinson E, Nolis J. Build a Career in Data Science. Simon and Schuster; 2020.
    1. Yanai I, Lercher M. A hypothesis is a liability. Genome Biol. 2020;21:231. 10.1186/s13059-020-02133-w - DOI - PMC - PubMed
    1. Cross N. Designerly Ways of Knowing: Design Discipline Versus Design Science. Design Issues. 2001;17:49–55.

Publication types

LinkOut - more resources