. 2021 Mar 18;16(3):e0248553.
doi: 10.1371/journal.pone.0248553. eCollection 2021.

A comprehensive SARS-CoV-2 genomic analysis identifies potential targets for drug repurposing

Affiliations

A comprehensive SARS-CoV-2 genomic analysis identifies potential targets for drug repurposing

Nithishwer Mouroug Anand et al. PLoS One. .

Abstract

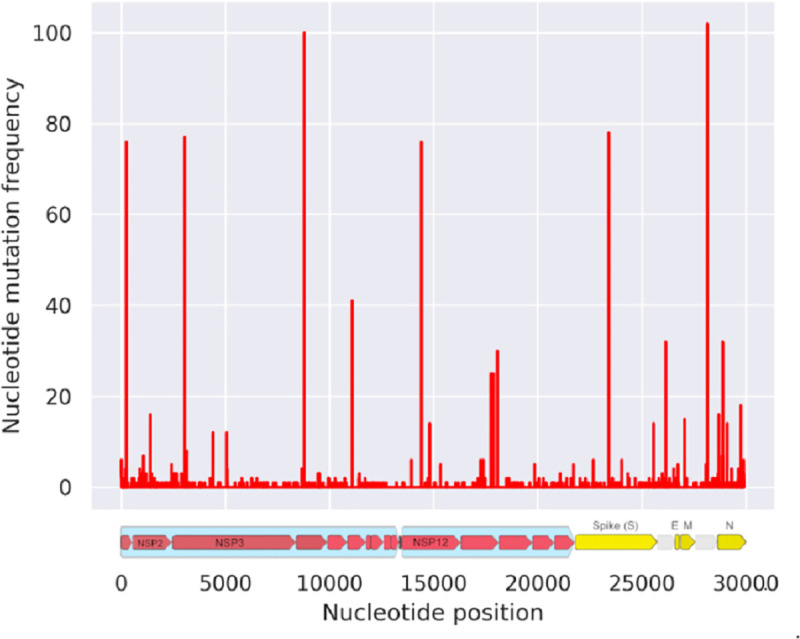
The severe acute respiratory syndrome coronavirus 2 (SARS-CoV-2) which is a novel human coronavirus strain (HCoV) was initially reported in December 2019 in Wuhan City, China. This acute infection caused pneumonia-like symptoms and other respiratory tract illness. Its higher transmission and infection rate has successfully enabled it to have a global spread over a matter of small time. One of the major concerns involving the SARS-COV-2 is the mutation rate, which enhances the virus evolution and genome variability, thereby making the design of therapeutics difficult. In this study, we identified the most common haplotypes from the haplotype network. The conserved genes and population level variants were analysed. Non-Structural Protein 10 (NSP10), Nucleoprotein, Papain-like protease (Plpro or NSP3) and 3-Chymotrypsin like protease (3CLpro or NSP5), which were conserved at the highest threshold, were used as drug targets for molecular dynamics simulations. Darifenacin, Nebivolol, Bictegravir, Alvimopan and Irbesartan are among the potential drugs, which are suggested for further pre-clinical and clinical trials. This particular study provides a comprehensive targeting of the conserved genes. We also identified the mutation frequencies across the viral genome.


Conflict of interest statement

The authors have declared that no competing interests exist.

Figures

Fig 1
Fig 1. A detailed schematic representation of the SARS-CoV-2 viral genome.
The figure represents the detailed view of structural and non-structural proteins (NSPs).
Fig 2
Fig 2. Haplotype analysis of SARS-CoV-2 viruses.
Haplotype network of 358 SARS-CoV-2 viral genomes. The distribution of haplotypes over geographical areas were inserted as a part of the traits section in the Nexus file. The color code and its respective geographical distribution is marked on the bottom right corner.
Fig 3
Fig 3. Mutation frequency across the SARS-CoV-2 viral genome.
The red lines represent the number of mutations at a particular nucleotide position. On the abscissa is the nucleotide numbered from 0 to 30,000. To better understand the mutations across the viral genome, the genomic representation of SARS-CoV-2 is provided in the bottom panel. The red ones in the bottom panel represent the non-structural proteins while the yellow ones represent spike, E-proteins and the N-proteins.
Fig 4
Fig 4. Drug-protein interaction after docking.
A. 3CLPro-Darifenacin interaction, B. 3CLPro-Nebivolol interaction, C. NSP10-Alvimopan interaction, and D. NSP10-Isbesartan interaction. Drugs are in orange while the proteins are labelled in blue and the residues interacting with the drugs are highlighted in red. The contacts are shown in yellow.
Fig 5
Fig 5. Drug-protein interaction after docking.
A. Nucleoprotein-Bictegravir interaction, B. Nucleoprotein-Nebivolol interaction, C. PL Pro-Cilostazol interaction, and D. PL Pro-Elvitegravir interaction. Drugs are in orange while the proteins are labelled in blue and the residues interacting with the drugs are highlighted in red. The contacts are shown in yellow.
Fig 6
Fig 6. A superimposition of the protein-ligand complexes before and after the MD simulation.
The protein-ligand complex before the MD simulation is shown in magenta while the complex after the simulation is shown in cyan.
Fig 7
Fig 7. Analysis of RMSD, radius of gyration, hydrogen bonding, RMSF and SASA of nucleoprotein and drugs Bictegravir and Nebivolol.
A. Root-mean-square deviation of the Cɑ atoms, B. Radius of gyration (Rg) over the entire simulation, where the ordinate is Rg (nm) and the abscissa is time (ps), C. Total number of H-bond count throughout the simulation, D. RMSF values over the entire simulation, where the ordinate is RMSF (nm) and the abscissa is residue, and E. Solvent accessible surface area (SASA), where the ordinate is SASA (nm2) and the abscissa is time (ps).
Fig 8
Fig 8. Analysis of RMSD, radius of gyration, hydrogen bonding, RMSF and SASA of 3CLpro protein and drugs Darifenacin and Nebivolol.
A. Root-mean-square deviation of the Cɑ atoms, B. Radius of gyration (Rg) over the entire simulation, where the ordinate is Rg (nm) and the abscissa is time (ps), C. Total number of H-bond count throughout the simulation, D. RMSF values over the entire simulation, where the ordinate is RMSF (nm) and the abscissa is residue, and E. Solvent accessible surface area (SASA), where the ordinate is SASA (nm2) and the abscissa is time (ps).
Fig 9
Fig 9. Analysis of RMSD, radius of gyration, hydrogen bonding, RMSF and SASA of NSP10 protein and drugs Alvimopan and Irbesartan.
A. Root-mean-square deviation of the Cɑ atoms, B. Radius of gyration (Rg) over the entire simulation, where the ordinate is Rg (nm) and the abscissa is time (ps), C. Total number of H-bond count throughout the simulation, D. RMSF values over the entire simulation, where the ordinate is RMSF (nm) and the abscissa is residue, and E. Solvent accessible surface area (SASA), where the ordinate is SASA (nm2) and the abscissa is time (ps).
Fig 10
Fig 10. Analysis of RMSD, radius of gyration, hydrogen bonding, RMSF and SASA of NSP10-16 complex and drug Alvimopan.
A. Root-mean-square deviation of the Cɑ atoms, B. Radius of gyration (Rg) over the entire simulation, where the ordinate is Rg (nm) and the abscissa is time (ps), C. Total number of H-bond count throughout the simulation, D. RMSF values over the entire simulation, where the ordinate is RMSF (nm) and the abscissa is residue, and E. Solvent accessible surface area (SASA), where the ordinate is SASA (nm2) and the abscissa is time (ps).

References

    1. Wang L, Wang Y, Ye D, Liu Q. Review of the 2019 novel coronavirus (SARS-CoV-2) based on current evidence. Int J Antimicrob Agents [Internet]. 2020;(xxxx):105948. Available from: 10.1016/j.ijantimicag.2020.105948 - DOI - PMC - PubMed
    1. Nadeem MS, Zamzami MA, Choudhry H, Murtaza BN, Kazmi I, Ahmad H, et al.. Origin, potential therapeutic targets and treatment for coronavirus disease (COVID-19). Pathogens. 2020;9(4):1–13. 10.3390/pathogens9040307 - DOI - PMC - PubMed
    1. Raoult D, Zumla A, Locatelli F, Ippolito G, Kroemer G. Coronavirus infections: Epidemiological, clinical and immunological features and hypotheses. Cell Stress. 2020;4(4):66–75. 10.15698/cst2020.04.216 - DOI - PMC - PubMed
    1. Tahir ul Qamar M, Alqahtani SM, Alamri MA, Chen LL. Structural basis of SARS-CoV-2 3CLpro and anti-COVID-19 drug discovery from medicinal plants. J Pharm Anal [Internet]. 2020;(xxxx):1–7. Available from: 10.1016/j.jpha.2020.03.009 - DOI - PMC - PubMed
    1. Tai W, He L, Zhang X, Pu J, Voronin D, Jiang S, et al.. Characterization of the receptor-binding domain (RBD) of 2019 novel coronavirus: implication for development of RBD protein as a viral attachment inhibitor and vaccine. Cell Mol Immunol [Internet]. 2020;(March). Available from: 10.1038/s41423-020-0400-4 - DOI - PMC - PubMed