. 2021 Mar 18;17(3):e1009397.
doi: 10.1371/journal.ppat.1009397. eCollection 2021 Mar.

Combining viral genetic and animal mobility network data to unravel peste des petits ruminants transmission dynamics in West Africa

Affiliations

Combining viral genetic and animal mobility network data to unravel peste des petits ruminants transmission dynamics in West Africa

Arnaud Bataille et al. PLoS Pathog. .

Abstract

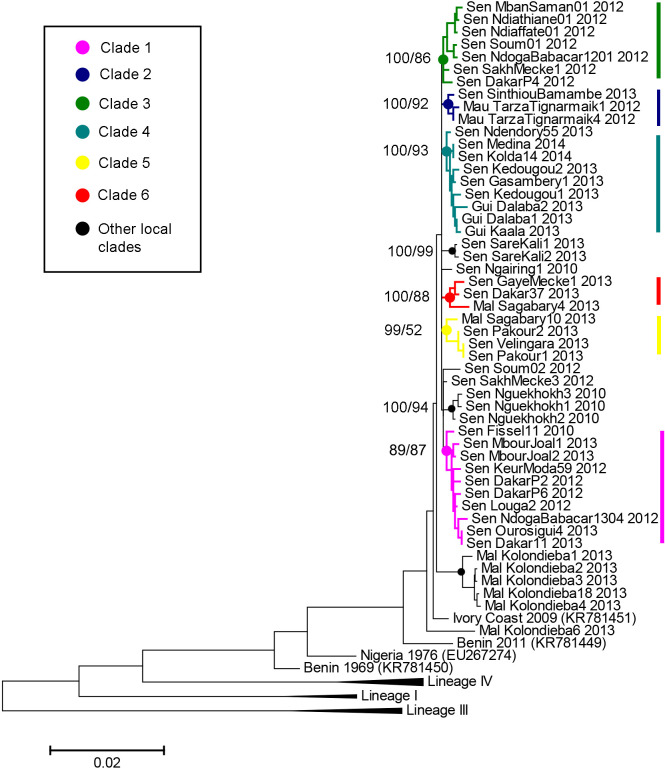
Peste des petits ruminants (PPR) is a deadly viral disease that mainly affects small domestic ruminants. This disease threaten global food security and rural economy but its control is complicated notably because of extensive, poorly monitored animal movements in infected regions. Here we combined the largest PPR virus genetic and animal mobility network data ever collected in a single region to improve our understanding of PPR endemic transmission dynamics in West African countries. Phylogenetic analyses identified the presence of multiple PPRV genetic clades that may be considered as part of different transmission networks evolving in parallel in West Africa. A strong correlation was found between virus genetic distance and network-related distances. Viruses sampled within the same mobility communities are significantly more likely to belong to the same genetic clade. These results provide evidence for the importance of animal mobility in PPR transmission in the region. Some nodes of the network were associated with PPRV sequences belonging to different clades, representing potential "hotspots" for PPR circulation. Our results suggest that combining genetic and mobility network data could help identifying sites that are key for virus entrance and spread in specific areas. Such information could enhance our capacity to develop locally adapted control and surveillance strategies, using among other risk factors, information on animal mobility.


Conflict of interest statement

The authors have declared that no competing interests exist. Authors Mbargou Lo, Mohamed Keyra, Abdellahi Salem Lella were unable to confirm their authorship contributions. On their behalf, the corresponding author has reported their contributions to the best of their knowledge.

Figures

Fig 1
Fig 1. Graphical representation of the relation between network communities and virus transmission.
Colored shades group sets of nodes belonging to the same community in the network. Colored links represent different virus strains in circulation.
Fig 2
Fig 2. Phylogenetic analysis based on concatenated PPRV N and H complete coding regions.
Phylogenetic tree constructed using a maximum likelihood inference method showing the relationship based on N and H gene sequences of peste des petits ruminants virus (PPRV) samples collected in Guinea, Mali, Mauritania and Senegal (see S1 Table for details). Genetic clusters of interest to this study are indicated by coloured branches. The numbers at the nodes indicate support from posterior probability/bootstrap values (> 50%) obtained with Bayesian inference and maximum likelihood methods, respectively.
Fig 3
Fig 3. Geographical locations of collected peste des petits ruminants virus (PPRV) samples (main figure) and network nodes distribution (inset).
The colours correspond to genetic clades identified in this study. Labels in the main figure correspond to names of regions in Senegal and neighbouring countries. Labels in the inset indicate network (SN) data used in combination with genetic data in the study. The base layer for the map used in the figure was obtained at http://www.gadm.org.
Fig 4
Fig 4. Mantel Correlogram for genetic and geographic (euclidean) distance.
The value of Mantel correlation coefficient is shown for each distance class. Circles (M) correspond to result of Mantel correlogram without controlling for interaction with network distance. Triangles (P) indicate correlation analyses taking into account potential interaction with the network distance Netdist (see main text). Colors indicate significance of the Mantel tests. Results of other correlograms based on different geographical and network-related distances are shown in S4 Fig.
Fig 5
Fig 5. Tessellation of Senegal based on the position of mobility network nodes using the InfoMap algorithm.
Each polygon, centred around nodes of the network, is coloured based on the community it has been associated with (also labelled with an id number in the legend). Only communities where at least one PPRV strain has been detected are shown in colours. Icons indicate different PPRV genetic clades based on results of the phylogenetic analyses. This figure visualizes if spatial structure is present in our network, using the community algorithm InfoMap, with different weights for the links: Basic, no weight; Frequency, the number of times the link was active; Volume, cumulative volume of animals exchanged in a year; Brockmann, using the effective Brockmann distance (see main text). The base layer for the map used in the figure was obtained at http://www.gadm.org.
Fig 6
Fig 6. Tessellation of Senegal based on the position of mobility network nodes using the Edge_Betweenness algorithm.
Each polygon, centred around nodes of the network, is coloured based on the community it has been associated with (also labelled with an id number in the legend). Only communities where at least one PPRV strain has been detected are shown in colours. Icons indicate different PPRV genetic clades based on results of the phylogenetic analyses. This figure visualizes if spatial structure is present in our network, using the community algorithm Edge Betweenness, with different weights for the links: Basic, no weight; Frequency, the number of times the link was active; Volume, cumulative volume of animals exchanged in a year; Brockmann, using the effective Brockmann distance (see main text). The base layer for the map used in the figure was obtained at http://www.gadm.org.
Fig 7
Fig 7. Geographical locations of hotspots and monoclade.
Hotspots and monoclade are geolocalised and the wards (Administrative Unit of level 3) to which they belong are colored according to the type of node (hotspot or monoclade). Nodes are scaled based on their incoming volume of animals. Labels in uppercase letters indicate node names. Labels in lowercase letters correspond to the names of regions in Senegal. The base layer for the map used in the figure was obtained at http://www.gadm.org.

References

    1. Parida S, Muniraju M, Mahapatra M, Muthuchelvan D, Buczkowski H, Banyard AC. Peste des petits ruminants. Veterinary Microbiology. 2015;181(1–2):90–106. 10.1016/j.vetmic.2015.08.009 - DOI - PMC - PubMed
    1. Baron MD, Diallo A, Lancelot R, Libeau G. Peste des Petits Ruminants virus. In: Kielian M, Maramorosch K, Mettenleiter TC, editors. Advances in Virus Research 95: Academic Press; 2016. p. 1–42. 10.1016/bs.aivir.2016.02.001 - DOI - PubMed
    1. OIE. OIE terrestrial manual. https://www.oie.int/en/standard-setting/terrestrial-manual/. 2017:Accessed on 30 Dec 2019. 10.20506/rst.36.3.2713 - DOI - PubMed
    1. Jones BA, Rich KM, Mariner JC, Anderson J, Jeggo M, Thevasagayam S, et al. The economic impact of eradicating peste des petits ruminants: A benefit-cost analysis. PLoS ONE. 2016;11(2):e0149982. 10.1371/journal.pone.0149982 - DOI - PMC - PubMed
    1. OIE, FAO. Global control and eradication of PPR. http://www.oie.int/eng/PPR2015/doc/PPR-Advocacy-EN.pdf. 2015:Accessed on 30 Dec 2019.

Publication types

LinkOut - more resources