. 2021 Jun;106(5):1366-1386.
doi: 10.1111/tpj.15242. Epub 2021 Apr 7.

The BOP-type co-transcriptional regulator NODULE ROOT1 promotes stem secondary growth of the tropical Cannabaceae tree Parasponia andersonii

Affiliations

The BOP-type co-transcriptional regulator NODULE ROOT1 promotes stem secondary growth of the tropical Cannabaceae tree Parasponia andersonii

Defeng Shen et al. Plant J. 2021 Jun.

Abstract

Tree stems undergo a massive secondary growth in which secondary xylem and phloem tissues arise from the vascular cambium. Vascular cambium activity is driven by endogenous developmental signalling cues and environmental stimuli. Current knowledge regarding the genetic regulation of cambium activity and secondary growth is still far from complete. The tropical Cannabaceae tree Parasponia andersonii is a non-legume research model of nitrogen-fixing root nodulation. Parasponia andersonii can be transformed efficiently, making it amenable for CRISPR-Cas9-mediated reverse genetics. We considered whether P. andersonii also could be used as a complementary research system to investigate tree-related traits, including secondary growth. We established a developmental map of stem secondary growth in P. andersonii plantlets. Subsequently, we showed that the expression of the co-transcriptional regulator PanNODULE ROOT1 (PanNOOT1) is essential for controlling this process. PanNOOT1 is orthologous to Arabidopsis thaliana BLADE-ON-PETIOLE1 (AtBOP1) and AtBOP2, which are involved in the meristem-to-organ-boundary maintenance. Moreover, in species forming nitrogen-fixing root nodules, NOOT1 is known to function as a key nodule identity gene. Parasponia andersonii CRISPR-Cas9 loss-of-function Pannoot1 mutants are altered in the development of the xylem and phloem tissues without apparent disturbance of the cambium organization and size. Transcriptomic analysis showed that the expression of key secondary growth-related genes is significantly down-regulated in Pannoot1 mutants. This allows us to conclude that PanNOOT1 positively contributes to the regulation of stem secondary growth. Our work also demonstrates that P. andersonii can serve as a tree research system.

Keywords: NOOT1; Parasponia andersonii; NOOT-BOP-COCH-LIKE genes; development; secondary growth; tree; vascular cambium.


Conflict of interest statement

The authors declare no conflict of interest.

Figures

Figure 1
Figure 1
Developmental kinetics of P. andersonii vascular cambium establishment. Transversal sections of the first internode above cotyledons (epicotyl) of in vitro grown P. andersonii seedlings of genotype PanWU1‐14 at 13, 15, 18, 22, 26, 30, 35 and 42 days post‐germination. The first column shows entire epicotyl transversal sections. The second column shows magnifications focusing on vascular tissues organization. The third column provides simplified schemes of the vascular tissue organization generated from images in the second column . The fourth column shows magnifications focusing on the cambial zone. Panels 1–16, from 13 to 22 days, PanWU1‐14 epicotyl vascular elements are organized as isolated poles. Each vascular pole consists of xylem and phloem tissues developing inward and outward from the procambium (red dotted‐lines), respectively. Panels 13–16, At 22 days post‐germination, the first interfascicular cambium cell divisions occur (red asterisks). Panels 17–32, from 26 to 42 days, PanWU1‐14 epicotyl transversal sections display a complete ring of cambial cells (red dotted‐lines) with xylem and phloem accumulating inward and outward from the cambium respectively. p, phloem tissues; x, xylem tissues; red dotted‐lines, vascular cambium; red asterisks, interfascicular cambium cell divisions. Ratios in schemes of the right column indicate the number of transversal sections showing identical vascular tissues organization. Thickness = 7 µm. Scale bars = 100 µm
Figure 2
Figure 2
PanNOOT1 gene expression profile compared to vascular cambium, xylem and phloem marker gene expression profiles during P. andersonii stem secondary growth kinetics. (a–d) qRT‐PCR gene expression profile of PanNOOT1 gene compared to vascular cambium, xylem and phloem developmental markers during the kinetic of P. andersonii stem secondary growth described in Figure 1. qRT‐PCR gene expression analysis was performed on the first internode above cotyledons (epicotyl) from in vitro grown P. andersonii plants at 13, 15, 18, 22, 26, 30, 35 and 42 days. Parasponia andersonii vascular cambium, xylem and phloem marker genes represent orthologs of vascular cambium, xylem and phloem marker genes described in A. thaliana and/or in Populus sp. (Table S1 and Dataset S1). (a) qRT‐PCR gene expression analysis of PanCLE41 (light blue curve), PanPXY‐TDR (blue curve) and PanWOX4 (dark blue curve) involved in the ligand‐receptor‐TF feedback loop systems regulating vascular cambium stem cell maintenance. qRT‐PCR gene expression analysis of PanMOL1 (red curve) involved in the regulation of interfascicular cambium cell proliferation. (b) qRT‐PCR gene expression analysis of the class I KNOX transcription factor genes PanSTM1 (light green curve), PanSTM2 (light green dotted curve) and PanBP (green curve) involved in vascular cambium stem cell maintenance. (c) qRT‐PCR gene expression analysis of PanSND1 (light blue curve), PanVND6 (light blue dotted curve), PanCNA (blue curve) and PanNST1 (blue dotted‐curve) involved in xylem development. qRT‐PCR gene expression analysis of PanAPL (red curve) involved in phloem development. d, qRT‐PCR gene expression analysis of PanNOOT1 (black curve). (a–d) Gene expression data were normalized against the constitutively expressed PanELONGATION FACTOR1α (PanEF1α) gene as well as against the expression levels from 13‐day‐old reference samples. (a, b and d) The y‐axis represents fold changes. (c) The y‐axis represents log2 (fold changes). Results represent thre mean ± sem from three biological replicates. Gene abbreviations: PanCLE41, PanCLAVATA3/ESR‐RELATED41 (PanWU01x14_078150); PanPXY‐TDR, PanPHLOEM INTERCALATED WITH XYLEM‐TDIF RECEPTOR (PanWU01x14_218900); PanWOX4, PanWUSCHEL RELATED HOMEOBOX4 (PanWU01x14_119590); PanMOL1, PanMORE LATERAL GROWTH1 (PanWU01x14_105020); PanSTM1, PanSHOOT MERISTEMLESS1 (PanWU01x14_211410); PanSTM2, PanSHOOT MERISTEMLESS2 (PanWU01x14_287890); PanBP, PanBREVIPEDICELLUS (PanWU01x14_033300); PanSND1, PanSECONDARY WALL‐ASSOCIATED NAC DOMAIN1 (PanWU01x14_056920); PanVND6, PanVASCULAR‐RELATED NAC‐DOMAIN6 (PanWU01x14_182640); PanAPL, PanALTERED PHLOEM DEVELOPMENT (PanWU01x14_155850); PanCNA, PanCORONA (PanWU01x14_195660); PanNST1, PanNAC SECONDARY WALL THICKENING PROMOTING FACTOR1 (PanWU01x14_041300); PanNOOT1, PanNODULE ROOT1 (PanWU01x14_292800)
Figure 3
Figure 3
PanNOOT1 in situ RNA hybridization and promoter GUS expression patterns in P. andersonii stem. The expression pattern of PanNOOT1 was determined by in situ hybridization and using transgenic lines expressing a PromPanNOOT1:GUS:NOOT1ter fusion. (a,b) In situ hybridizations were performed on cross sections of the second fully elongated internode from the shoot apex of 10‐week‐old P. andersonii PanWU1‐14 plants. (a) Anti‐sense RNA probes targeting the nodule‐specific PanNF‐YA1 mRNAs (PanWU01x14_284830) served as negative control (Bu et al., 2020). No specific expression pattern or signal background were observed for PanNF‐YA1. (b) Specific PanNOOT1 anti‐sense RNA probes (red signals indicated by black arrowheads) were detected in phloem parenchyma, in cambial zone, in differentiating secondary xylem cells, in secondary xylem fibres and in the older primary xylem. Signals were not detected in cortex, in phloem sclerenchyma and sieve elements, nor in xylem vessels. (c) PanNOOT1 gene expression pattern in the third fully elongated internode from the shoot apex of 7‐week‐old P. andersonii PanWU1‐14 stable transformants expressing the GUS reporter fusion PromPanNOOT1:GUS:NOOT1ter. The X‐gluc staining (blue coloration indicated by white arrowheads) was detected in phloem parenchyma, in cambial zone, in differentiating secondary xylem cells, in secondary xylem fibres and in the older primary xylem. Signals were not detected in cortex, in phloem sclerenchyma and sieve elements, nor in xylem vessels. Black dotted lines indicate the frontier between the cambial zone and the phloem tissues. Co, cortex; Psc, phloem sclerenchyma; Pp, phloem parenchyma; Pse, phloem sieve elements; dX, differentiating xylem; Xf, xylem fibres; Xv, xylem vessels. Thickness: (a,b) 6 µm; (c) 7 µm. Scale bar: (a) 50 µm; (b,c) 25 µm
Figure 4
Figure 4
Parasponia andersonii Pannoot1 mutants present a reduced stem secondary growth. Measurement of stem diameters in Pannoot1 A5 (light blue bars), Pannoot1 A10 (blue bars) and Pannoot1 A29 (dark blue bars) compared to wild‐type PanWU1‐14 (white bars), trimmed wild‐type PanWU1‐14 (hatched white bars), transgenic control PanCtr‐44 (grey bars) and trimmed transgenic control PanCtr‐44 (hatched grey bars). Stem diameters were measured at the middle of internodes (IN) for the first 10 internodes, from the bottom to the top of 10‐week‐old plants. For PanWU1‐14, trimmed PanWU1‐14, PanCtr‐44, trimmed PanCtr‐44, Pannoot1 A5, Pannoot1 A10 and Pannoot1 A29, n = 15, 15, 15, 15, 30, 30 and 26 plants, respectively. Error bars represent the SD. Asterisks indicate significant differences relative to wild‐type PanWU1‐14 (*P < 1 × 10−2; **P < 1 × 10−3; ***P < 1 × 10−4; ****P < 1 × 10−5; *****P < 1 × 10−6; ******P < 1 × 10−7; Student’s t‐test)
Figure 5
Figure 5
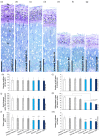
Histological analysis of stem tissues reveals a reduced number of xylem and phloem cell layers in P. andersonii Pannoot1 mutants. (a–g) Representative images of the most basal internode organizations of 10‐week‐old PanWU1‐14 (a), trimmed PanWU1‐14 (b), PanCtr‐44 (c), trimmed PanCtr‐44 (d), Pannoot1 A5 (e), Pannoot1 A10 (f) and Pannoot1 A29 (g) genotypes. Pd, periderm; Co, cortex; Ph, phloem; Cz, cambial zone; Xv, xylem vessel; Xy, xylem fibre; P, pith. Thickness = 5 µm. Scale bars = 500 µm. (h–m) Detailed analysis of secondary growth developmental parameters in the most basal internode of 10‐week‐old Pannoot1 A5 (light blue bars), Pannoot1 A10 (blue bars) and Pannoot1 A29 (dark blue bars) relative to wild‐type PanWU1‐14 (white bars), trimmed wild‐type PanWU1‐14 (hatched white bars), transgenic control PanCtr‐44 (grey bars) and trimmed transgenic control PanCtr‐44 (hatched grey bars) plants. (h) Measurement of vascular cambium cells size. Anticlinally dividing stem cells were specifically measured. (i) Quantification of the number of cell layers present in the cambial zone. The cells were measured along transects from anticlinally dividing vascular cambium cells until the first thickened xylem fibre cells. (j) Measurement of the first thickened xylem fibre cells size. (k) Quantification of the number of differentiated xylem cell layers. The cells were measured along transects from the first thickened xylem fibre cells until the pith. (l) Measurement of xylem vessel cells size. (m) Quantification of the number of cell layers present in the phloem. The number of phloemian cell layers were quantified along transects from anticlinally dividing stem cells until the first cortex cell layers. (h–m) The number of elements analyzed (n) is indicated on the right of each graph. Error bars represent SDs. Asterisks represent significant differences compared to PanWU1‐14 control plants (***P < 1 × 10−4, Student’s t‐test). For the number of differentiated xylem cell layers parameter (k), the statistical analysis was performed on all Pannoot1 data and compared to all control lines (P < 6 × 10−133, Student’s t‐test)
Figure 6
Figure 6
The P. andersonii Pannoot1 mutants are affected in the expression of secondary growth marker genes. (a) Principal component analysis (PCA) plot of the transcriptomic data. The PCA analysis was performed on internode samples collected from 8‐week‐old PanCtr‐44 (red), Pannoot1 A5 (blue) and Pannoot1 A10 (green). From the shoot apex, the first internode that was not shorter than the next one was defined as the first fully elongated internode feIN1. Downward internodes were numbered feIN2 and feIN3, consecutively. The different elongated internode samples used in the analysis are indicated by distinct shapes: feIN1 (circle), feIN2 (triangle) and feIN3 (square). All samples consisted of three biological replicates. The PCA analysis was performed on 27 transcriptomes and over 37229 P. andersonii genes. The first two components are shown, representing 47% of the variation in all samples. (b,c) Differentially expressed transcripts are grouped within four distinct gene expression patterns. (b) Tissue responsive genes grouped either in tissue responsive pattern I (437 DETs, P < 0.01) in which genes are significantly up‐regulated in older internodes compared to younger internodes, irrespective of the genotype, or in tissue responsive pattern II (391 DETs, P < 0.01) in which genes are significantly down‐regulated in older internodes compared to younger internodes, irrespective of the genotype. (c) Genotype responsive genes can group either in the genotype responsive pattern III (3501 DETs, P < 0.01) in which genes are significantly down‐regulated in Pannoot1 mutants compared to PanCtr‐44, irrespective of tissue, or in the genotype responsive pattern IV (3677 DETs, P < 0.01) in which genes are significantly up‐regulated in Pannoot1 mutants compared to PanCtr‐44, irrespective of tissue. TPM, transcripts per million; feIN, fully elongated internode; n, number of genes. (d) A diagram showing the frequency of tissue and genotype responsive DETs among 90 P. andersonii genes putatively involved in secondary growth (Table S1). A detailed table showing DETs among those 90 genes is provided in Figure S14. (e) Heatmap of significantly down‐regulated transcripts related to secondary growth regulation in Pannoot1 A5 and A10 compared to PanCtr‐44. Parasponia andersonii genes were named according to the literature for A. thaliana and P. andersonii gene accession numbers are given. Key down‐regulated secondary growth‐related genes were sub‐divided into six groups according to their main function described in the literature: potential PanNOOT1 downstream targets, boundary specification, vascular cambium activity, xylem differentiation, xylem secondary cell wall and phloem differentiation. The heatmap scale represents normalized TPM values. For each gene, the sample with the lowest TPM value was normalized as 0 and the sample with the highest TPM value was normalized as 100. Gene abbreviations: PanNOOT1, PanNODULE ROOT1; PanATH1, PanARABIDOPSIS THALIANA HOMEOBOX GENE1 (At4g32980); PanKNAT6, PanKNOTTED‐LIKE FROM ARABIDOPSIS THALIANA 6‐LIKE (At1g23380); PanLOF, PanLATERAL ORGAN FUSION (At1g69560, At1g26780); PanCLE41, PanCLAVATA3/ESR‐RELATED41; PanWOX4, PanWUSCHEL RELATED HOMEOBOX4; PanXIP1, PanXYLEM INTERMIXED WITH PHLOEM1; PanRUL1, PanREDUCED IN LATERAL GROWTH1; PanMOL1, PanMORE LATERAL GROWTH1; PanANT, PanAINTEGUMENTA; PanBP, PanBREVIPEDICELLUS; PanSTM2, PanSHOOT MERISTEMLESS2; PanPNY, PanPENNYWISE; PanPIN1, PanPINFORMED1; PanHK4, PanHISTIDINE KINASE4; PanCOI1, PanCORONATINE INSENSITIVE1; PanD27, PanDWARF27; PanCCD7, PanCAROTENOID CLEAVAGE DIOXYGENASE7; PanCCD8, PanCAROTENOID CLEAVAGE DIOXYGENASE8; PanGA20OX2, PanGIBBERELLIN 20 OXIDASE2; PanPXC1, PanPXY‐TDR‐CORRELATED1; PanPHB, PanPHABULOSA; PanSND1, PanSECONDARY WALL‐ASSOCIATED NAC‐DOMAIN1; PanMYB46, PanMYB DOMAIN PROTEIN46; PanMYB42, PanMYB DOMAIN PROTEIN42; PanAPL, PanALTERED PHLOEM DEVELOPMENT

Similar articles

Cited by

References

    1. Agusti, J. , Lichtenberger, R. , Schwarz, M. , Nehlin, L. & Greb, T. (2011) Characterization of transcriptome remodeling during cambium formation identifies MOL1 and RUL1 as opposing regulators of secondary growth. PLoS Genetics, 7, e1001312. - PMC - PubMed
    1. Aida, M. & Tasaka, M. (2006a) Genetic control of shoot organ boundaries. Current Opinion in Plant Biology, 9, 72–77. 10.1016/j.pbi.2005.11.011. - DOI - PubMed
    1. Aida, M. & Tasaka, M. (2006b) Morphogenesis and patterning at the organ boundaries in the higher plant shoot apex. Plant Molecular Biology, 60, 915–928. 10.1007/s11103-005-2760-7. - DOI - PubMed
    1. Alonso‐Serra, J. , Safronov, O. , Lim, K.J. , Fraser‐Miller, S.J. , Blokhina, O.B. , Campilho, A. et al. (2019) Tissue‐specific study across the stem reveals the chemistry and transcriptome dynamics of birch bark. New Phytologist, 222(4), 1816–1831. 10.1111/nph.15725. - DOI - PubMed
    1. Barnett, J.R. (1981) Secondary xylem cell development. In: Barnett, J.R. (Ed.) Xylem cell development. London: Castle House, pp. 47–95.

Publication types