

Landscape of immune cell infiltration in clear cell renal cell carcinoma to aid immunotherapy
- PMID: 33735492
- PMCID: PMC8177771
- DOI: 10.1111/cas.14887
Landscape of immune cell infiltration in clear cell renal cell carcinoma to aid immunotherapy
Abstract
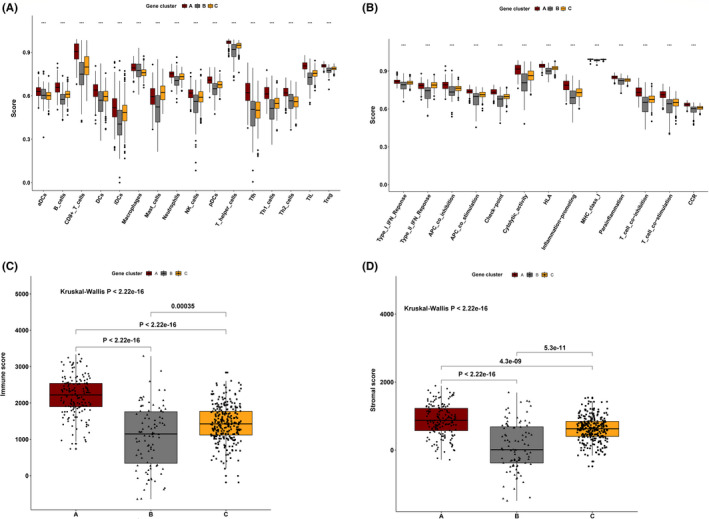
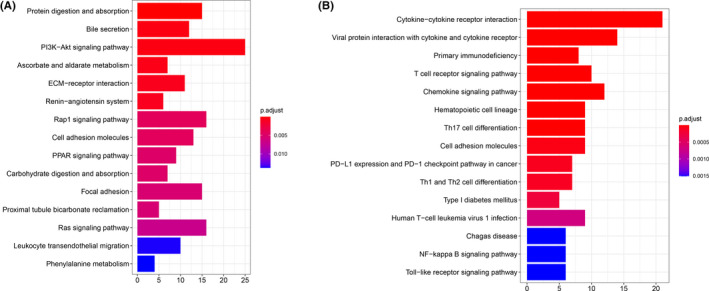
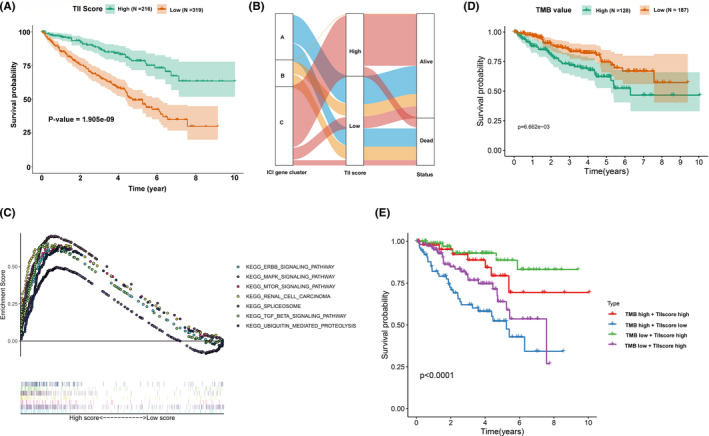
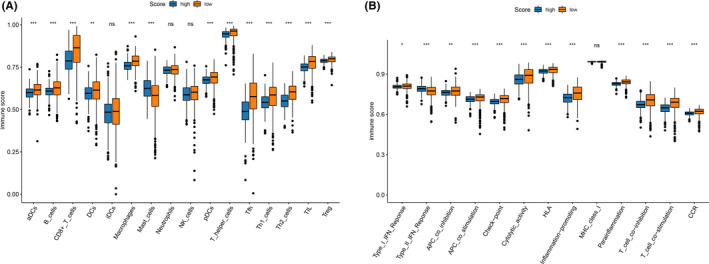
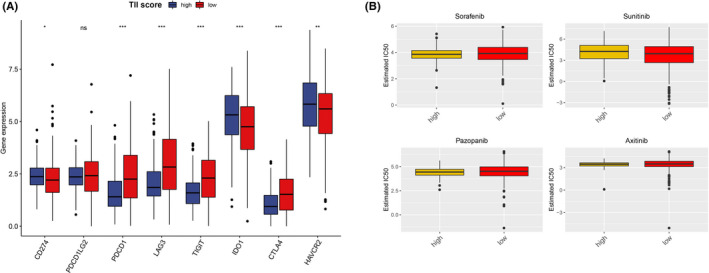
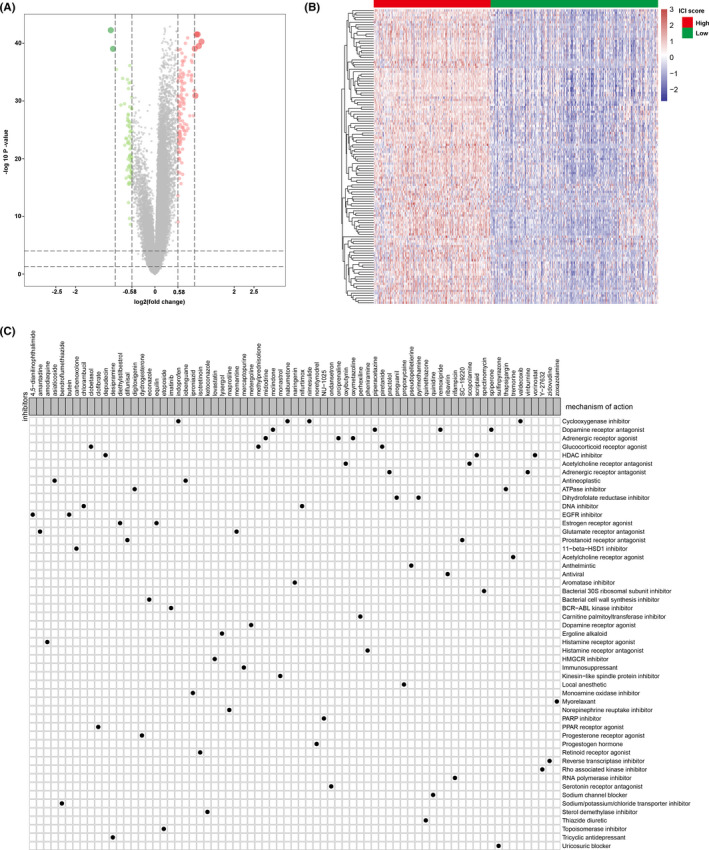
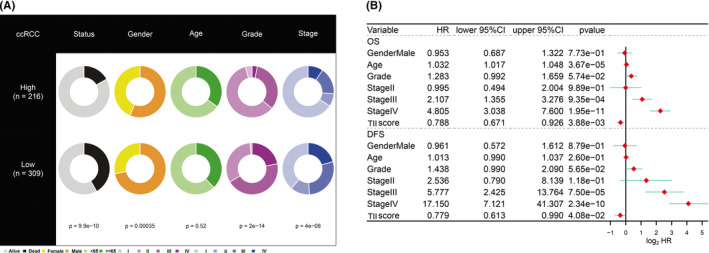
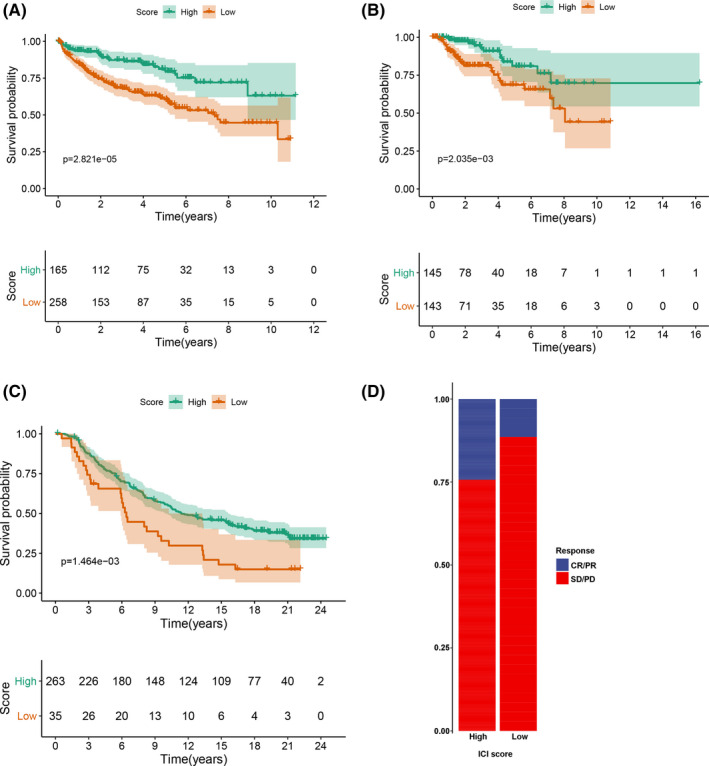
The tumor microenvironment, comprised of tumor cells and tumor-infiltrating immune cells, is closely associated with the clinical outcome of clear cell renal cell carcinoma (ccRCC) patients. However, the landscape of immune infiltration in ccRCC has not been fully elucidated. Herein, we applied multiple computational methods and various datasets to reveal the immune infiltrative landscape of ccRCC patients. The tumor immune infiltration (TII) levels of 525 ccRCC patients using a single-sample gene were examined and further categorized into immune infiltration subgroups. The TII score was characterized by distinct clinical traits and showed a significant divergence based on gender, grade, and stage. A high TII score was associated with the ERBB signaling pathway, the TGF-β signaling pathway, and the MTOR signaling pathway, as well as a better prognosis. Furthermore, patients with high TII scores exhibited greater sensitivity to pazopanib. The low TII score was characterized by a high immune infiltration level of CD8+ T cells, T follicular helper cells, and regulatory T cells (Tregs). Moreover, the immune check point genes, including CTLA-4, LAG3, PD-1, and IDO1, presented a high expression level in the low TII score group. Patients in the high TII score group demonstrated significant therapeutic advantages and clinical benefits. The findings in this study have the potential to assist in the strategic design of immunotherapeutic treatments for ccRCC.
Keywords: clear cell renal cell carcinoma; immune cell infiltration; immune check point; immunotherapy; tumor microenvironment.
© 2021 The Authors. Cancer Science published by John Wiley & Sons Australia, Ltd on behalf of Japanese Cancer Association.
Conflict of interest statement
The authors declare that they have no conflict of interests.
Figures
Similar articles
-
Comprehensive Multi-Omics Identification of Interferon-γ Response Characteristics Reveals That RBCK1 Regulates the Immunosuppressive Microenvironment of Renal Cell Carcinoma.Front Immunol. 2021 Nov 2;12:734646. doi: 10.3389/fimmu.2021.734646. eCollection 2021. Front Immunol. 2021. PMID: 34795663 Free PMC article.
-
Tumor immune microenvironment characterization in clear cell renal cell carcinoma identifies prognostic and immunotherapeutically relevant messenger RNA signatures.Genome Biol. 2016 Nov 17;17(1):231. doi: 10.1186/s13059-016-1092-z. Genome Biol. 2016. PMID: 27855702 Free PMC article.
-
Integrated analysis of immune-related gene subtype and immune index for immunotherapy in clear cell renal cell carcinoma.Pathol Res Pract. 2021 Sep;225:153557. doi: 10.1016/j.prp.2021.153557. Epub 2021 Jul 20. Pathol Res Pract. 2021. PMID: 34329838
-
Importance of Multiparametric Evaluation of Immune-Related T-Cell Markers in Renal-Cell Carcinoma.Clin Genitourin Cancer. 2019 Dec;17(6):e1147-e1152. doi: 10.1016/j.clgc.2019.07.021. Epub 2019 Aug 5. Clin Genitourin Cancer. 2019. PMID: 31473121 Review.
-
Cancer-associated fibroblasts in clear cell renal cell carcinoma: functional heterogeneity, tumor microenvironment crosstalk, and therapeutic opportunities.Front Immunol. 2025 Jun 4;16:1617968. doi: 10.3389/fimmu.2025.1617968. eCollection 2025. Front Immunol. 2025. PMID: 40534854 Free PMC article. Review.
Cited by
-
Clinical Significance and Expression Pattern of RIP5 and VGLL4 in Clear Cell Renal Cell Carcinoma Patients Treated with Sunitinib.Biomedicines. 2024 Jan 10;12(1):149. doi: 10.3390/biomedicines12010149. Biomedicines. 2024. PMID: 38255254 Free PMC article.
-
Identification of a Prognostic Model Based on Immune Cell Signatures in Clear Cell Renal Cell Carcinoma.Oxid Med Cell Longev. 2022 Aug 23;2022:1727575. doi: 10.1155/2022/1727575. eCollection 2022. Oxid Med Cell Longev. 2022. PMID: 36052158 Free PMC article.
-
CBX Family Members in Two Major Subtypes of Renal Cell Carcinoma: A Comparative Bioinformatic Analysis.Diagnostics (Basel). 2022 Oct 11;12(10):2452. doi: 10.3390/diagnostics12102452. Diagnostics (Basel). 2022. PMID: 36292141 Free PMC article.
-
Development and validation of a model based on immunogenic cell death related genes to predict the prognosis and immune response to bladder urothelial carcinoma.Front Oncol. 2023 Nov 10;13:1291720. doi: 10.3389/fonc.2023.1291720. eCollection 2023. Front Oncol. 2023. PMID: 38023241 Free PMC article.
-
Evaluation of the clinical significance of lymphocyte subsets and myeloid suppressor cells in patients with renal carcinoma.Discov Oncol. 2024 Sep 30;15(1):512. doi: 10.1007/s12672-024-01405-2. Discov Oncol. 2024. PMID: 39347882 Free PMC article.
References
-
- Gulati S, Vaishampayan U. Current state of systemic therapies for advanced renal cell carcinoma. Curr Oncol Rep. 2020;22:26. - PubMed
-
- Frew I, Moch H. A clearer view of the molecular complexity of clear cell renal cell carcinoma. Annu Rev Pathol. 2014;10:263‐289. - PubMed
-
- Antonelli A, Cozzoli A, Zani D, et al. The follow‐up management of non‐metastatic renal cell carcinoma: definition of a surveillance protocol. BJU Int. 2007;99:296‐300. - PubMed
-
- Bruijn R, Mulders P, Jewett M, et al. Surgical safety of cytoreductive nephrectomy following sunitinib: results from the multicentre, randomised controlled trial of immediate versus deferred nephrectomy (SURTIME). Eur Urol. 2019;76:437‐440. - PubMed
MeSH terms
Substances
Grants and funding
LinkOut - more resources
Full Text Sources
Other Literature Sources
Medical
Research Materials
Miscellaneous
