. 2021 Apr 1;108(4):709-721.
doi: 10.1016/j.ajhg.2021.03.005. Epub 2021 Mar 17.

Epigenetic inactivation of ERF reactivates γ-globin expression in β-thalassemia

Affiliations

Epigenetic inactivation of ERF reactivates γ-globin expression in β-thalassemia

Xiuqin Bao et al. Am J Hum Genet. .

Abstract

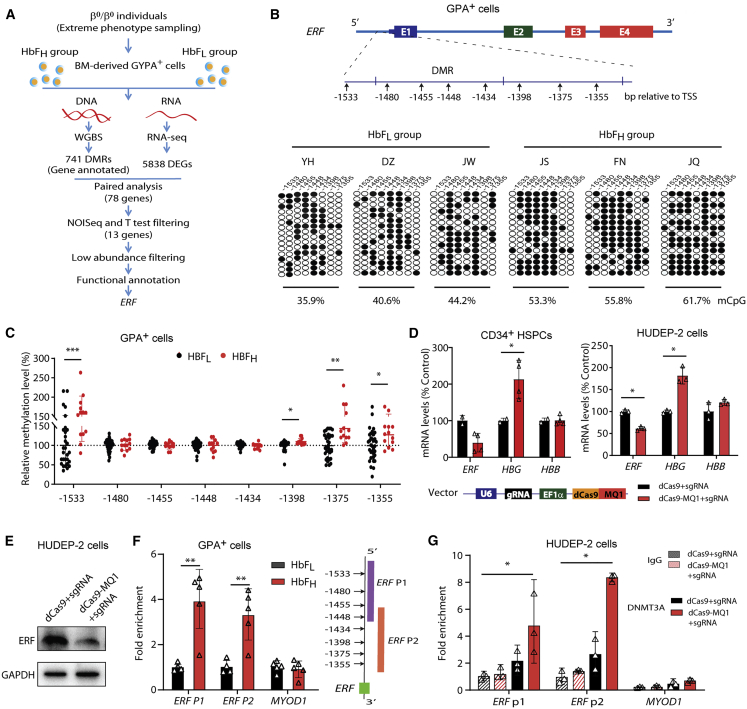
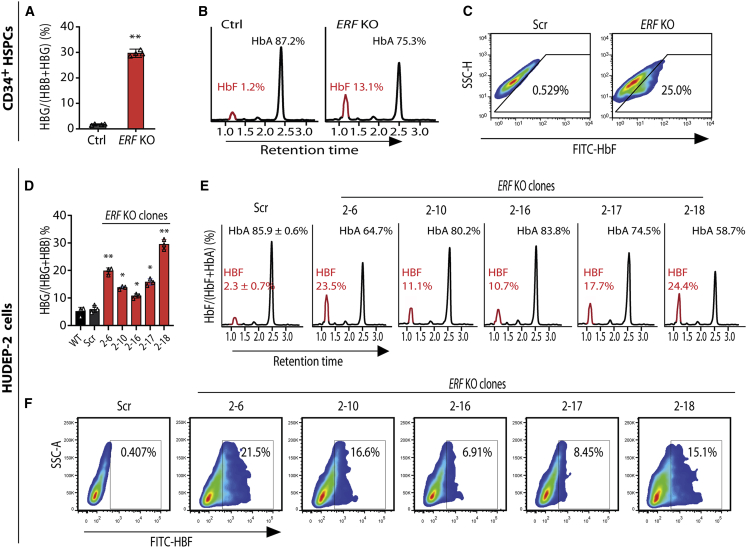
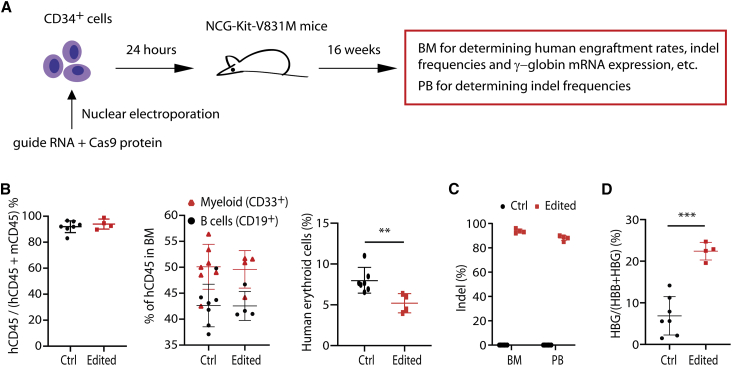
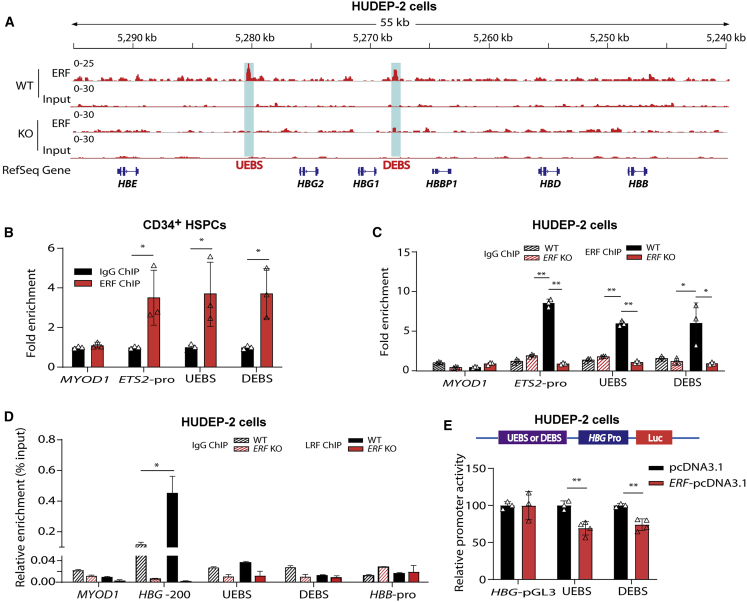
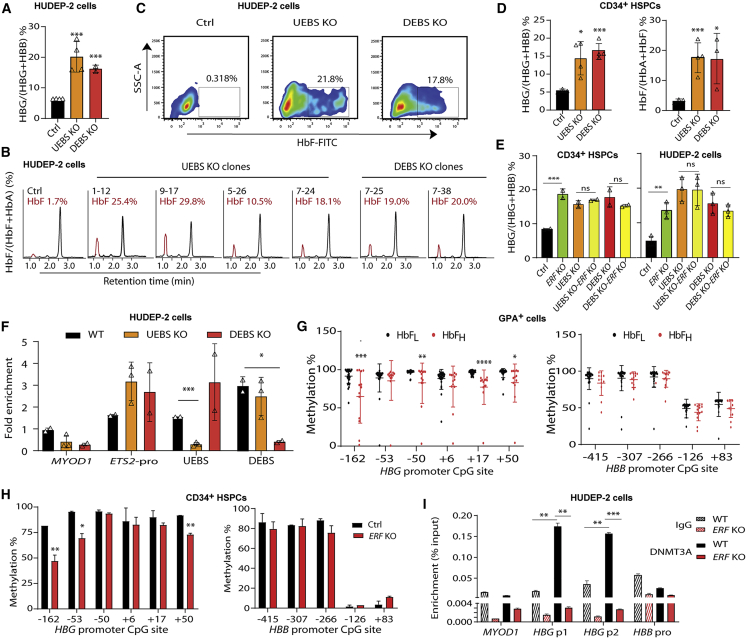
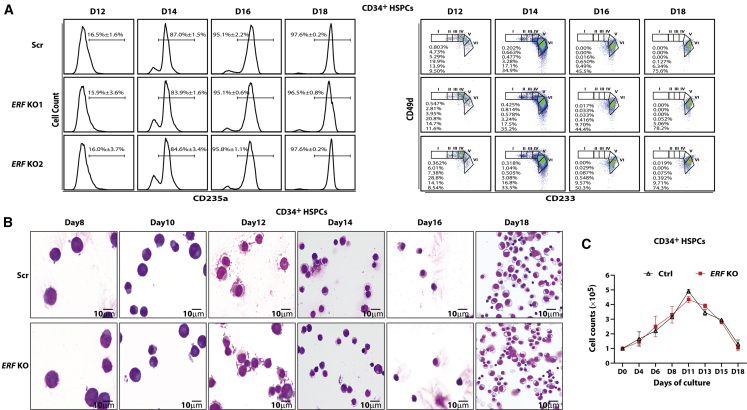
The fetal-to-adult hemoglobin switch is regulated in a developmental stage-specific manner and reactivation of fetal hemoglobin (HbF) has therapeutic implications for treatment of β-thalassemia and sickle cell anemia, two major global health problems. Although significant progress has been made in our understanding of the molecular mechanism of the fetal-to-adult hemoglobin switch, the mechanism of epigenetic regulation of HbF silencing remains to be fully defined. Here, we performed whole-genome bisulfite sequencing and RNA sequencing analysis of the bone marrow-derived GYPA+ erythroid cells from β-thalassemia-affected individuals with widely varying levels of HbF groups (HbF ≥ 95th percentile or HbF ≤ 5th percentile) to screen epigenetic modulators of HbF and phenotypic diversity of β-thalassemia. We identified an ETS2 repressor factor encoded by ERF, whose promoter hypermethylation and mRNA downregulation are associated with high HbF levels in β-thalassemia. We further observed that hypermethylation of the ERF promoter mediated by enrichment of DNMT3A leads to demethylation of γ-globin genes and attenuation of binding of ERF on the HBG promoter and eventually re-activation of HbF in β-thalassemia. We demonstrated that ERF depletion markedly increased HbF production in human CD34+ erythroid progenitor cells, HUDEP-2 cell lines, and transplanted NCG-Kit-V831M mice. ERF represses γ-globin expression by directly binding to two consensus motifs regulating γ-globin gene expression. Importantly, ERF depletion did not affect maturation of erythroid cells. Identification of alterations in DNA methylation of ERF as a modulator of HbF synthesis opens up therapeutic targets for β-hemoglobinopathies.

Keywords: CD34+ HSPCs; ERF; GYPA+ cells; engraftment mice; epigenetics; fetal hemoglobin; genome editing; methylation; whole-genome bisulfite sequencing; β-thalassemia.


Conflict of interest statement

The authors declare no competing interests.

Figures

Figure 1
Figure 1
Identification of ERF as an HbF repressor through transcriptomic and methylation studies in β-thalassemia-affected individuals (A) A flowchart for the screening of candidate modulators of HbF. The threshold for a positive DMR is defined as differential methylation level ≥ 10% (see the supplemental materials). We screened 741 out of the top 3,000 DMRs (top 3,000 hyper-DMR or hypo-DMR), which are annotated to be located in the promoter regions. 5,835 DEGs were identified according to the following criteria: |log2FC| > 0.8 and divergence probability > 0.8 via NOISeq. 78 genes were enrolled in the candidate list as they presented significantly differential expression in both mRNA and methylation level between HbFL and HbFH groups. We further screened 13 out of the 78 DE-mRNAs (|log2FC| > 0.8 and divergence probability > 0.8 in the NOISeq analysis and p < 0.1 in the further Student’s t test) containing DMRs in their promoter regions, from which we prioritized six candidate genes by filtering out the low abundance with FPKM < 1.0 in either the HbFH or HbFL group. We finally performed functional annotation and identified ERF as the candidate gene with top priority for functional validation. (B) Top: schematic of ERF gene body. Bottom: analysis of methylation levels at CpG sites (indicated by the distance relative to the transcription start site, TSS) within the DMR in the ERF promoter, evaluated by sequencing. Data were generated with BM-derived GYPA+ cells from individuals with β0-thalassemia (HbFH: n = 3 or HbFL: n = 3) and used in WGBS assays. Each row of eight CpG sites within a group represents a single bisulfite-treated clone with methylated CpGs (•) or unmethylated CpGs (○). (C) Quantitative measurement of methylation levels of the ERF promoter by bisulfite pyrosequencing in an independent cohort of 47 samples with β-thalassemia (HbFH: n = 13 or HbFL: n = 34). Methylation percentage of each subject relative to the mean level for the subjects with HbFL (the horizontal dashed line) is shown for each CpG site. (D) Effects of ERF promoter hypermethylation by dCas9-MQ1/sgRNA on ERF, HBG, and HBB expression levels in CD34+ HSPCs (left) and HUDEP-2 cells (right). The schematic of dCas9-MQ1-sgRNA assay is shown in the bottom. MQ1 was methyltransferase that mediated hypermethylation in the target DNA region according to the guide of sgRNA. Two sgRNAs were designed to cover the region of eight CpG sites in the ERF promoter. (E) Immunoblotting analysis in control and ERF promoter-targeted methylated HUDEP-2 cells. GAPDH served as a loading control. (F) ChIP-quantitative real-time PCR assays performed with DNMT3A antibody in GYPA+ cells from the HbFH group (n = 5) and HbFL group (n = 5). ERF P1 and P2 covered the region of eight CpG sites in the ERF promoter, as shown in the right panel. (G) ChIP-quantitative real-time PCR assays of DNMT3A performed in control (dCas9-sgRNA) and methylated (dCas9-MQ1-sgRNA) HUDEP-2 cells. MYOD1 served as the negative control. Data from ≥3 independent experiments are presented as means ± SD (p < 0.05; ∗∗p < 0.01).
Figure 2
Figure 2
ERF depletion elevates γ-globin expression in vitro (A–C) Quantitative measurement of HBG mRNA expression by quantitative real-time PCR (A) and HbF or HbA production by high performance liquid chromatography (HPLC) (B) and by flow cytometry analysis with FITC-conjugated anti-HbF antibody (C) in control (Ctrl or Scr, the non-edited control that has been subject to the same processes as the experimental lines without editing) and ERF KO CD34+ HSPCs. (D–F) Quantitative measurement of HBG mRNA expression by quantitative real-time PCR (D) and HbF or HbA production by HPLC (E) and by flow cytometry analysis (F) in wild type (WT), Scr, and five independent single ERF KO HUDEP-2 clones. Data from ≥3 independent experiments are presented as means ± SD (p < 0.05; ∗∗p < 0.01).
Figure 3
Figure 3
ERF depletion elevates γ-globin expression in vivo (A) The experimental design for in vivo functional validations of ERF. ERF-targeted gRNA and Cas9 protein were electroporated into CD34+ HSPCs and after 24 h engrafted into immunodeficient mice by intravenous tail injection. Bone marrow (BM) and peripheral blood (PB) cells were harvested at week 16 after engraftment for further analysis. (B) Flow cytometry analysis in mouse BM 16 weeks after transplantation for determination of human engraftment rates (left), human cell multilineage reconstitution (myeloid and B cells, middle), and human erythroid cells (right). (C) Determination of the indel frequencies by Synthego analysis after sequencing of PCR products in PB and BM from engrafted mice. (D) Measurement of HBG mRNA expression by quantitative real-time PCR in mouse BM 16 weeks after engraftment (n = 4 for edited mice and n = 7 for unedited mouse controls). Data are presented as means ± SD (∗∗p < 0.01; ∗∗∗p < 0.001).
Figure 4
Figure 4
Identification of ERF-binding sites in β-globin gene clusters (A) ChIP-seq binding patterns from HUDEP-2 cells with anti-ERF antibody at the β-globin cluster. Two ERF-binding positive signals 3.6 kb upstream of HBG2 (named UEBS) and 1.5 kb downstream of HBG1 (named DEBS) are marked by the light blue shadows. (B) Detection of ERF-binding sites by ChIP-quantitative real-time PCR in human CD34+ HSPCs. (C and D) Detection of ERF-binding (C) or LRF-binding (D) activity in ERF KO HUDEP-2 cells (clone #2–6). IgG served as the negative control for ChIP. MYOD1 and HBB-pro served as the negative control for quantitative real-time PCR. ETS2-pro served as the positive control for quantitative real-time PCR. HBG-200, −200 bp upstream of the TSS in the HBG promoter, served as the positive control for LRF binding. (E) Top: the schematic of dual luciferase reporter assay. Bottom: effects of UEBS or DEBS as regulatory elements on HBG promoter activity in a pGL3 luciferase reporter in HUDEP-2 cells without (black) or with (bright red) ERF overexpression (OE). The data of each group were normalized to the control (pcDNA3.1). Data are presented as means ± SD (p < 0.05; ∗∗p < 0.01).
Figure 5
Figure 5
Knockout of ERF-binding sites led to elevation of HbF in HUDEP-2 and CD34+ HSPCs (A–C) Quantitative measurement of ERF mRNA expression by quantitative real-time PCR (A) and HbF production by HPLC (B) and by flow cytometry analysis (C) in UEBS/DEBS KO HUDEP-2 clones (n = 4 for UEBS and n = 2 for DEBS, each point indicates the mean value for each clone). The HPLC profiles of HbF from each of the six independent single UEBS/DEBS KO HUDEP-2 clones are shown. (D) Quantitative measurement of HBG mRNA expression by quantitative real-time PCR (left) and HbF production by HPLC (right) in UEBS/DEBS KO CD34+ HSPCs (editing efficiency: 30% for UEBS, 23% for DEBS). (E) Quantitative measurement of HBG mRNA expression by quantitative real-time PCR in single or double KO of ERF and/or UEBS (UEBS KO-ERF KO) or DEBS (DEBS KO-ERF KO) CD34+ HSPCs (left) and HUDEP-2 cells (right). The γ-globin expression levels were determined as a percentage of the total β-like globin level (HBG+HBB). One-way ANOVA was used for comparison of the indicated groups. p < 0.05; ∗∗∗p < 0.01. ns, non-significant (p > 0.05). (F) Detection of ERF-binding sites by ChIP-quantitative real-time PCR in UEBS or DEBS KO HUEDP-2 clones (n = 3 and n = 2, respectively). Data are presented as mean ± SD for each clone. (G) Quantitative measurement of methylation levels of the HBG (left) and HBB (right) promoter by bisulfite sequencing in the independent cohort of 47 samples with β-thalassemia (HbFH: n = 13 or HbFL: n = 34). (H) Quantitative measurement of methylation levels of the HBG promoter (left) and HBB promoter (right) by bisulfite sequencing in the ERF KO CD34+ HSPCs. (I) ChIP-quantitative real-time PCR assay performed with DNMT3A antibody in HBG promoter in WT and ERF KO HUDEP-2 cells. HBG p1 and p2 covered the region of CpG sites from −162 to +50. MYOD1 and HBB pro served as controls.
Figure 6
Figure 6
The impact of ERF on the differentiation of CD34+ HSPCs (A) Left: the expression of CD235a on different time points of culture of CD34+ HSPCs in percentage (mean ± SD, n = 3). Right: terminal erythroid differentiation was examined on indicated days by flow cytometric analysis based on the expression of CD233 and CD49d. Representative plots of CD233 versus CD49d of CD235a+ cells are shown, and the erythroblasts are separated into six populations: proerythroblasts (I), early baso erythroblasts (II), late baso erythroblasts (III), polychromatic (IV), early orthochromatic (V), and late orthochromatic (VI). (B) Representative images of Wright-Giemsa staining of cytospins in different time points of differentiated CD34+ cells (objective lens, 100×). (C) Cell growth curves of control and ERF KO CD34+ cells (mean ± SD, n = 2).

Similar articles

Cited by

References

    1. Vinjamur D.S., Bauer D.E., Orkin S.H. Recent progress in understanding and manipulating haemoglobin switching for the haemoglobinopathies. Br. J. Haematol. 2018;180:630–643. - PubMed
    1. Wienert B., Martyn G.E., Funnell A.P.W., Quinlan K.G.R., Crossley M. Wake-up Sleepy Gene: Reactivating Fetal Globin for β-Hemoglobinopathies. Trends Genet. 2018;34:927–940. - PubMed
    1. Mettananda S., Higgs D.R. Molecular Basis and Genetic Modifiers of Thalassemia. Hematol. Oncol. Clin. North Am. 2018;32:177–191. - PubMed
    1. Liu D., Zhang X., Yu L., Cai R., Ma X., Zheng C., Zhou Y., Liu Q., Wei X., Lin L. KLF1 mutations are relatively more common in a thalassemia endemic region and ameliorate the severity of β-thalassemia. Blood. 2014;124:803–811. - PMC - PubMed
    1. Chondrou V., Kolovos P., Sgourou A., Kourakli A., Pavlidaki A., Kastrinou V., John A., Symeonidis A., Ali B.R., Papachatzopoulou A. Whole transcriptome analysis of human erythropoietic cells during ontogenesis suggests a role of VEGFA gene as modulator of fetal hemoglobin and pharmacogenomic biomarker of treatment response to hydroxyurea in β-type hemoglobinopathy patients. Hum. Genomics. 2017;11:24. - PMC - PubMed

Publication types

MeSH terms