. 2021 Apr 5;60(7):4657-4675.
doi: 10.1021/acs.inorgchem.0c03639. Epub 2021 Mar 18.

Phytochelatins as a Dynamic System for Cd(II) Buffering from the Micro- to Femtomolar Range

Affiliations

Phytochelatins as a Dynamic System for Cd(II) Buffering from the Micro- to Femtomolar Range

Joanna Wątły et al. Inorg Chem. .

Abstract

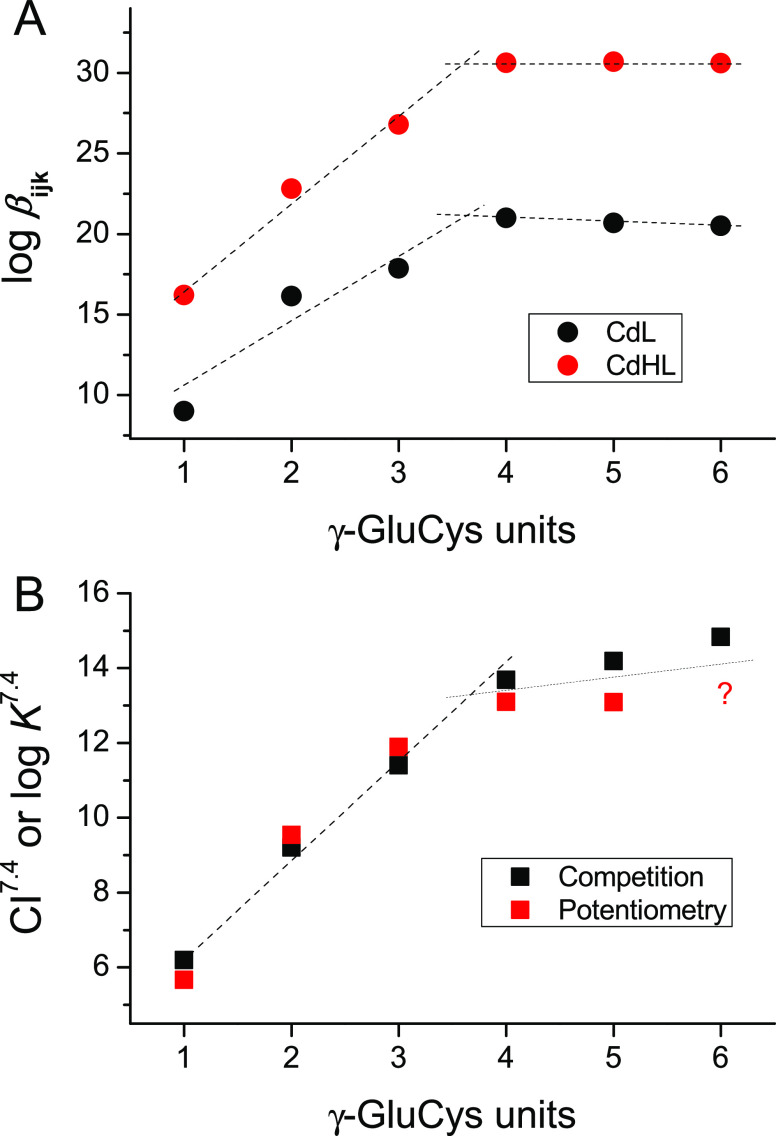
Phytochelatins (PCs) are short Cys-rich peptides with repeating γ-Glu-Cys motifs found in plants, algae, certain fungi, and worms. Their biosynthesis has been found to be induced by heavy metals-both biogenic and toxic. Among all metal inducers, Cd(II) has been the most explored from a biological and chemical point of view. Although Cd(II)-induced PC biosynthesis has been widely examined, still little is known about the structure of Cd(II) complexes and their thermodynamic stability. Here, we systematically investigated glutathione (GSH) and PC2-PC6 systems, with regard to their complex stoichiometries and spectroscopic and thermodynamic properties. We paid special attention to the determination of stability constants using several complementary techniques. All peptides form CdL complexes, but CdL2 was found for GSH, PC2, and partially for PC3. Moreover, binuclear species CdxLy were identified for the series PC3-PC6 in an excess of Cd(II). Potentiometric and competition spectroscopic studies showed that the affinity of Cd(II) complexes increases from GSH to PC4 almost linearly from micromolar (log K7.4GSH = 5.93) to the femtomolar range (log K7.4PC4 = 13.39) and additional chain elongation does not increase the stability significantly. Data show that PCs form an efficient system which buffers free Cd(II) ions in the pico- to femtomolar range under cellular conditions, avoiding significant interference with Zn(II) complexes. Our study confirms that the favorable entropy change is the factor governing the elevation of phytochelatins' stability and illuminates the importance of the chelate effect in shifting the free Gibbs energy.


Conflict of interest statement

The authors declare no competing financial interest.

Figures

Scheme 1
Scheme 1. Sequences of γ-Glu-Cys-Containing Peptides Investigated in This Study: (A) Primary Structure of GSH and PCs; (B) Exemplary Structure of PC2 Where Boldface Groups Demonstrate Acid–Base Properties
Figure 1
Figure 1
Spectroscopic titrations of GSH (100 μM), PC2 (20 μM), and PC3–PC6 (10 μM) peptides with Cd(II) in 20 mM Tris buffer at pH 7.4, 25 °C (I = 0.1 M from NaClO4). The insets demonstrate absorbances at particular wavelengths as a function of the Cd(II) to peptide molar ratio. Red, blue, green, and magenta denote 0.5, 1.0, 1.5, and 2.0 molar ratios, respectively.
Figure 2
Figure 2
CD spectra of GSH (100 μM) and PC2–PC6 (20 μM) titrations with Cd(II). Spectra were recorded in 20 mM Tris-HCl buffer at pH 7.4 (I = 0.1 M from NaClO4). The insets present molar ellipticity changes at the indicated wavelengths (values in red and black).
Figure 3
Figure 3
Schematic representation of the most important Cd(II) complexes formed by the series PC2–PC6 with the indication of complex stoichiometry. N and C denote the N-terminus (γ-Glu residue) and C-terminus (Gly residue) of each PC, respectively. Note that C- and N-termini may be protonated or deprotonated. X represents either donors from the N- or C-terminus or water molecules that fill the coordination sphere of Cd(II).
Figure 4
Figure 4
pH-dependent relations of Cd(II) complex formation. (A) Isotherms of Cd-GSH and Cd-PCs system formation as a function of pH (metal to peptide molar ratio 1:1). Molar fractions (xCd-PCs) were calculated from the absorbance at a specific wavelength characteristic for the particular PC system. pKa′ denotes the inflection point, which corresponds to 50% complex formation of a particular ligand. (B) Dependence of pKa′ values on the number of γ-Glu-Cys segments in the GSH and PC2–PC6 series. (C) Linear relation between the apparent log K7.4Cd-L constants and pKa′ values (R = 0.99, R2 = 0.97). Dashed blue lines indicate the 95% confidence interval.
Figure 5
Figure 5
Species distribution profiles for Cd(II) complexes of PC2 (A), PC3 (B), PC4 (C), and PC5 (D) at a 1.0 Cd(II) to peptide ratio 1.0 (500 μM Cd(II) and 500 μM PCs) on the basis of potentiometric results (25 °C, I = 0.1 M from KNO3). Dashed, blue, and dark gray lines correspond to free Cd(II), binuclear, and mononuclear species, respectively. For clarity GSH and other metal to peptide ratio plots are presented in Figures S10 and S11 in the Supporting Information.
Figure 6
Figure 6
Relation of stability constants of Cd-PC complexes depending on the number of γ-Glu-Cys segment repeats in the peptide. (A) Comparison of cumulative constants of CdHL and CdL complexes derived from potentiometry. Compared complexes were detected for all investigated peptides. (B) Comparison of the formation constant (log K7.4) determined in the competition experiments with complexones and competitivity indexes (CI7.4) derived from the potentiometric data. CI values used here were calculated for concentrations used in potentiometric experiments (Table 3).
Figure 7
Figure 7
Isotherms of the Cd(II)-L complex formation in the series of GSH and PC2–PC6 as a function of free Cd(II). The free Cd(II)-controlled buffers (50 mM TES, 0.1 M NaClO4) contained series of metal chelators of various Cd(II) affinities with the gradual saturation of Cd(II) (see the Experimental Section). Molar fractions (xCd-PCs) were calculated from the absorbance at a specific wavelength characteristic for a particular PC system. Inflection points correspond to the conditional log K7.4CdL value.
Figure 8
Figure 8
ITC results of Cd(II)-titrated phytochelatins (PC2–PC5) presented as function of the experimental enthalpy (ΔHITC) and Cd(II)/PC molar ratio. All experiments were performed in HEPES buffer (I = 0.1 M from NaCl) at pH 7.4 with 3 mM TCEP used as a non-metal-binding reducing agent., The GSH or PC peptide (titrate) concentration was 250 or 50 μM, respectively, whereas the Cd(II) (titrant) concentration was 3 mM or 0.5 mM, respectively.
Figure 9
Figure 9
Speciation of Cd-L complexes and free Cd(II) concentrations in the series of GSHPC6. (A) Free Cd(II) concentrations a result of the complexation of 0.1 mM Cd(II) with 1 mM ligand. (B) Concentrations of Cd-L complexes in the system 0.5 mM GSH, 0.1 mM PC2–PC6, and increasing Cd(II) concentration from 50 to 500 μM (inset). Inset values in parentheses give free Cd(II) concentrations (−log[Cd(II)]free). (C) Various GSH and PC2–PC6 peptide concentration modeling dynamics of the γ-Glu-Cys peptide system during PC induction and related CdL complex concentrations in the presence of 0.1 M Cd(II). Case 1 (gray): GSH, PC2, PC3 concentrations are 0.8, 0.15, and 0.05 mM, respectively. Case 2 (red): GSH and PC2–PC5 concentrations are 0.6, 0.25, 0.12, 0.07, and 0.03 mM, respectively. Case 3 (blue): GSH and PC2–PC6 concentrations are 0.4, 0.15, 0.2, 0.12, 0.07, and 0.05 mM, respectively. Case 4 (green): GSH and PC2–PC6 concentrations are 0.2, 0.05, 0.09, 0.15, 0.2, and 0.15 mM, respectively. The inset demonstrates the distribution of CdL species in four investigated cases. Values in colors are log[Cd(II)]free concentrations. (D) Scheme demonstrating speciation tendency for Cd(II) complexes of LMW and HMW PCs at low and high Cd(II) concentrations and under short and long exposures of Cd(II). LMW and HMW stand for low- and high-molecular weight peptides, respectively.

Similar articles

Cited by

References

    1. Metallothioneins and related chelators. In Metal ions in life sciences; Sigel A., Sigel H., Sigel R., Eds.; Royal Society of Chemistry: Cambridge, U.K.; 2009.
    1. Cobbett C.; Goldsbrough P. Phytochelatins and metallothioneins: roles in heavy metal detoxification and homeostasis. Annu. Rev. Plant Biol. 2002, 53, 159–182. 10.1146/annurev.arplant.53.100301.135154. - DOI - PubMed
    1. Zenk M. H. Heavy metal detoxification in higher plants--a review. Gene 1996, 179, 21–30. 10.1016/S0378-1119(96)00422-2. - DOI - PubMed
    1. Krężel A.; Maret W. The functions of metamorphic metallothioneins in zinc and copper metabolism. Int. J. Mol. Sci. 2017, 18, 1237.10.3390/ijms18061237. - DOI - PMC - PubMed
    1. Balzano S.; Sardo A.; Blasio M.; Chahine T. B.; Dell’Anno F.; Sansone C.; Brunet C. microalgal metallothioneins and phytochelatins and their potential use in bioremediation. Front. Microbiol. 2020, 11, 517.10.3389/fmicb.2020.00517. - DOI - PMC - PubMed