. 2021 Mar 18;18(1):75.
doi: 10.1186/s12974-021-02104-3.

Senescent accelerated prone 8 (SAMP8) mice as a model of age dependent neuroinflammation

Affiliations

Senescent accelerated prone 8 (SAMP8) mice as a model of age dependent neuroinflammation

Andrés Fernández et al. J Neuroinflammation. .

Abstract

Background: Aging and age-related diseases are strong risk factors for the development of neurodegenerative diseases. Neuroinflammation (NIF), as the brain's immune response, plays an important role in aged associated degeneration of central nervous system (CNS). There is a need for well characterized animal models that will allow the scientific community to understand and modulate this process.

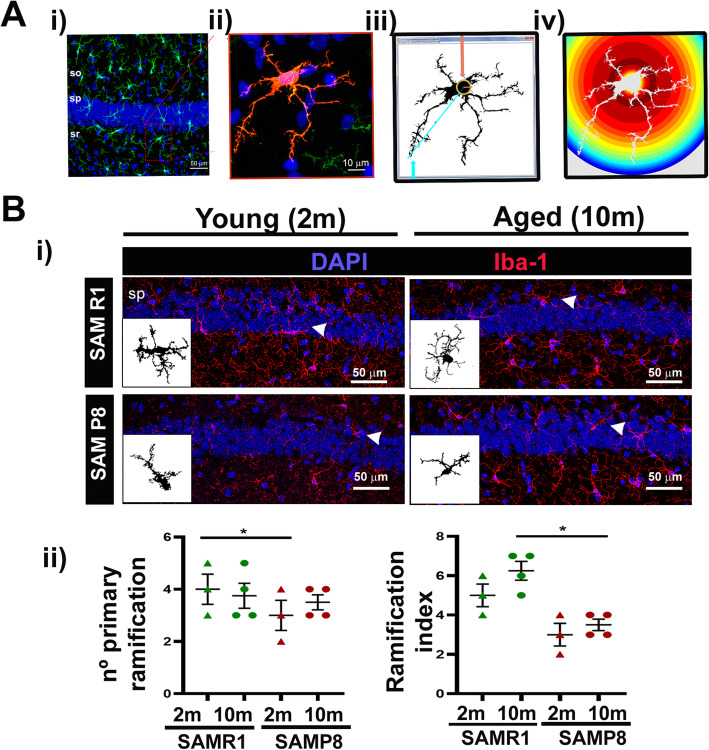
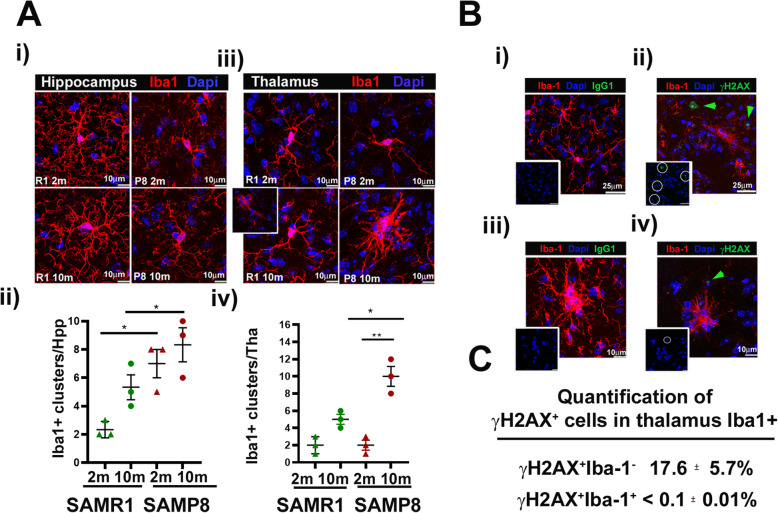
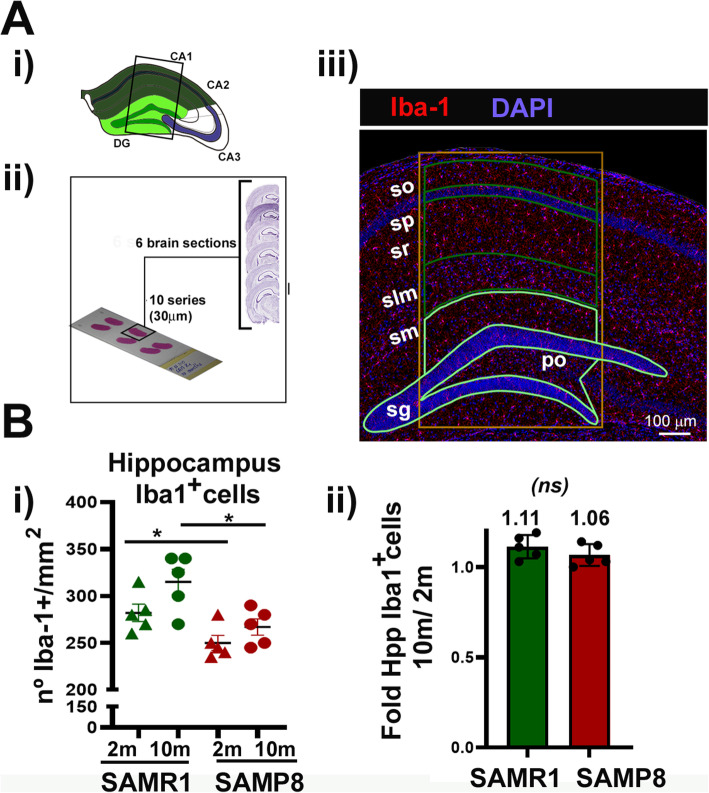
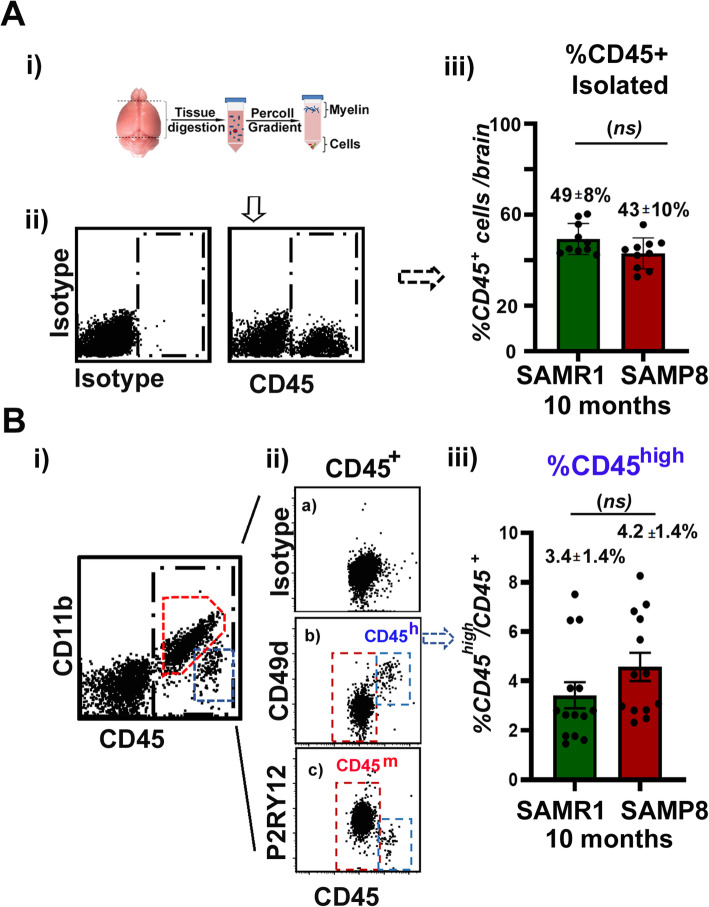
Methods: We have analyzed aging-phenotypical and inflammatory changes of brain myeloid cells (bMyC) in a senescent accelerated prone aged (SAMP8) mouse model, and compared with their senescence resistant control mice (SAMR1). We have performed morphometric methods to evaluate the architecture of cellular prolongations and determined the appearance of Iba1+ clustered cells with aging. To analyze specific constant brain areas, we have performed stereology measurements of Iba1+ cells in the hippocampal formation. We have isolated bMyC from brain parenchyma (BP) and choroid plexus plus meningeal membranes (m/Ch), and analyzed their response to systemic lipopolysaccharide (LPS)-driven inflammation.

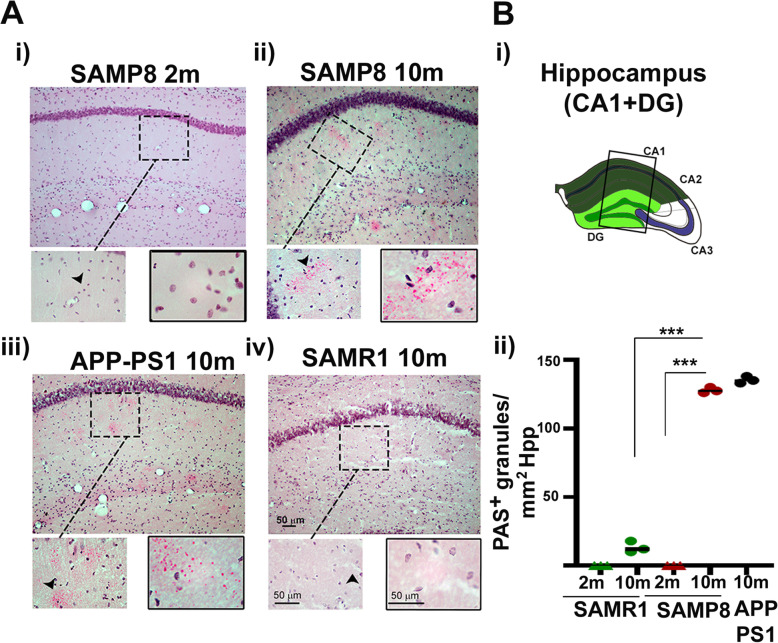
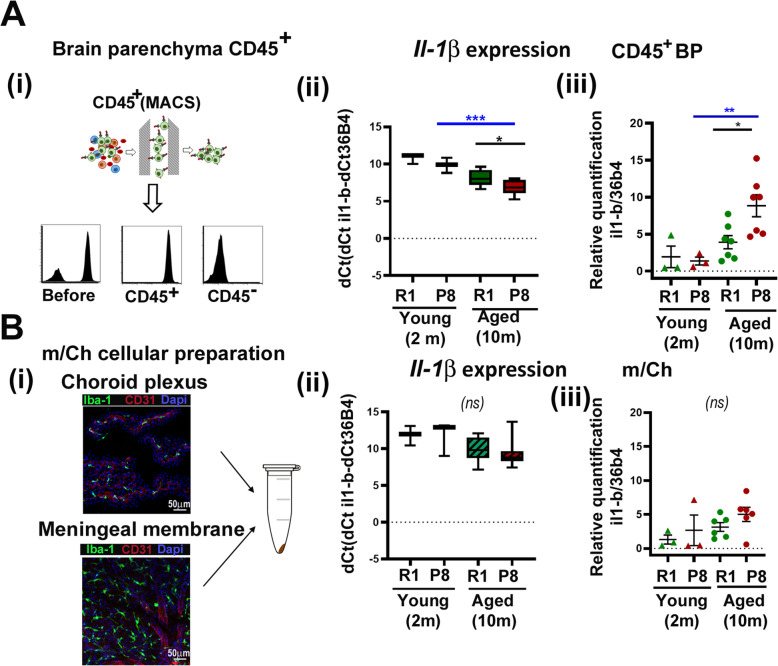
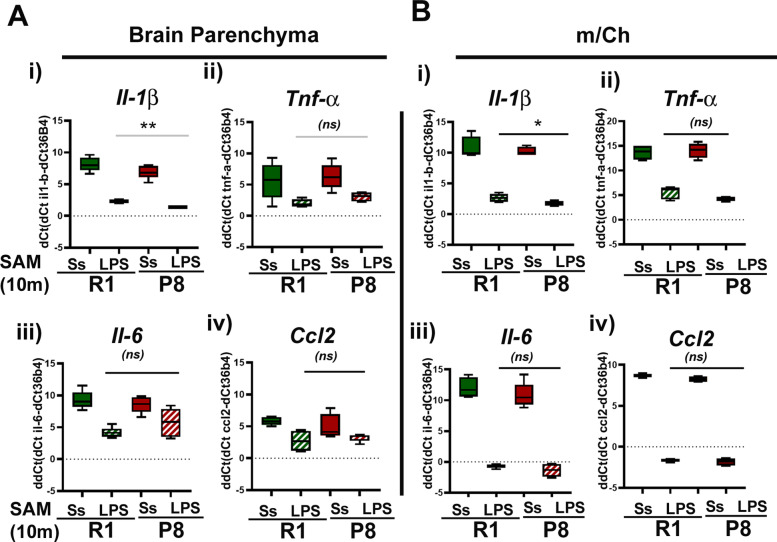
Results: Aged 10 months old SAMP8 mice present many of the hallmarks of aging-dependent neuroinflammation when compared with their SAMR1 control, i.e., increase of protein aggregates, presence of Iba1+ clusters, but not an increase in the number of Iba1+ cells. We have further observed an increase of main inflammatory mediator IL-1β, and an augment of border MHCII+Iba1+ cells. Isolated CD45+ bMyC from brain parenchyma (BP) and choroid plexus plus meningeal membranes (m/Ch) have been analyzed, showing that there is not a significant increase of CD45+ cells from the periphery. Our data support that aged-driven pro-inflammatory cytokine interleukin 1 beta (IL-1β) transcription is enhanced in CD45+BP cells. Furthermore, LPS-driven systemic inflammation produces inflammatory cytokines mainly in border bMyC, sensed to a lesser extent by the BP bMyC, showing that IL-1β expression is further augmented in aged SAMP8 compared to control SAMR1.

Conclusion: Our data validate the SAMP8 model to study age-associated neuroinflammatory events, but careful controls for age and strain are required. These animals show morphological changes in their bMyC cell repertoires associated to age, corresponding to an increase in the production of pro-inflammatory cytokines such as IL-1β, which predispose the brain to an enhanced inflammatory response after LPS-systemic challenge.

Keywords: Aging; Brain myeloid cells; IL-1β; Inflammation; Microglia; SAMP8.


Conflict of interest statement

Authors declare that they have no competing interests.

Figures

Fig. 1
Fig. 1
Analysis of PAS accumulations in SAM mice associated with aging and neurodegeneration. (a) Representative captures of hippocampal regions in SAMR1 and SAMP8 mice of 2 and 10 months (m) and 10 m old APP-PS1 mice, showing PAS-positive granules. Brain sections were stained by Schiff’s reagent (red-pink) and nuclei with hematoxylin (blue-brown). Images of coronal sections of cryostat (30 μm thick) were obtained with a ×20 objective (upper images), ×40 and ×100 (from left to right for magnified pictures), with a Nikon Eclipse 50i H550S light microscope and processed with the help of the NIS elements of software and ImageJ. (b) (i) Schematic representation of the regions analyzed. (ii) Quantification of PAS positive accumulates/mm2. SAMR1 is shown in green, SAMP8 in red, and APP PS1 in black. Two months data are represented with triangles and 10 months with circles. **p < 0.01 and ***p < 0.001 with respect to the PAS/mm2 accumulations (n = 3 to 5 males). Scale bars are included in the images
Fig. 2
Fig. 2
Morphology analysis by Sholl analysis. (a) (i) Representative images of hippocampus Iba1+ (green) regions used for analysis. so, stratum oriens; sp, stratum pyramidale; sr, stratum radiale. (ii) Detailed capture of cell morphology of an Iba1+ cell (red) maximum projection. (iii) Binary image of the maximum projection of the detailed image. (iv) Cartoon showing the radius of the longest extension that corresponds to the radius of the largest concentric circle and furthest from the soma (ending radius or maximum radius) and the radius that would cover the soma (starting radius or initial radius). (b) (i) Representative images of brain maps from 2 months and 10 months SAM Hpp areas using a ×40 objective and ×1.7 digital zoom. Insets show ×63 detailed images of iba1+ positive binary images for cell morphology. Nuclei are stained with DAPI (blue); brain microglia/macrophages are stained with Iba-1 (red). Scale bars are included in the images. (ii) Sholl analysis results, number of primary branches and branch index from Iba1+ cells from 2 (triangles) and 10 months (circles) old SAM mice Hpp area (n = 3 male). SAMR1 is shown in green and SAMP8 in red. Images were obtained with a Leica SP5 TCS inverted fluorescence confocal microscope, from 30 μm thick cryostat sections
Fig. 3
Fig. 3
Iba1+ clusters analysis of young and aged SAM mice. (a) 2 and 10 months SAMR1 and SAMP8 brains were stained with Iba1 for microglia/macrophages (red) and DAPI for nuclei (blue). Images from Iba1+ stained brain tissue are maximal projection of 15-20 μm z-stacks obtained on a Leica Spectral SP5 confocal microscope with a ×63 oil objective (×3 digital zoom) to capture cellular arborisation. (i) Representative maximal projections of Hpp Iba1+ cells of young 2 months and old 10 months from SAMR1 as control and SAMP8 brains. Clustered cells of 2 to 3 nuclei were observed in SAMP8 animals at both age points. (ii) Quantification of hippocampus Iba1+ microglia clusters in SAMR1 and SAMP8 from 2- and 10-month-old animals. (iii) Representative maximal projections of thalamus Iba1+ cells from SAMR1 (in green) as control and SAMP8 (in red) brains from 2 months (triangles) and old 10 months (circles) old animals. Ten months old SAMP8 thalamic region presented many Iba1+ clustered cells. Insert images show small Iba1+ clusters found in 10m SAMR1 Hpp. (iv) Quantification of thalamus Iba1+ microglia clusters in SAMR1 (green) and SAMP8 (red) from 2 (represented with triangles) and 10 months (circles) old animals. Data in plots are values of Iba1+ clusters found in individual brains (n = 3) (b) Co-localization of Iba1+ immunofluorescence (red) and γH2AX+ (green) in 30 μm coronal cryostat sections of 10 m old SAMP8 brains. Parallel slides were stained with specific γH2AX+ followed by 488 IgG-anti-mouse antibody (panels ii and iv) or 488-IgG alone (panels i and iii). Panels (i) to (iv) show representative images of maximum projection as before, from 10 months SAMP8 thalamus. Panel (i) and (ii), images were taken with a ×63 oil objective (×1.9 digital zoom) to show a wide field, and panel (iii) and (iv) were taken with ×63 oil objective (×3 digital zoom) to show Iba1+ clusters. Iba1+ cells (red), DAPI (blue) and (panel i and iii) 488 IgG (green) and (panel ii and iv) γH2AX+ (green). The green arrows in panels ii and iv point to γH2AX+ cells outside Iba1+ clusters are marked with a green arrow showing antibody specificity. Inserts show DAPI (blue) and 488 (green) channels. Images are representative of an experiment of n = 3 males. (c) Quantification of γH2AX+ cells in Iba1+ thalamus of 10 months old SAMP8 animals. γH2AX+ Iba1 cells are abundant in 10 months SAMP8 brains showing specificity of antibody. *p < 0.05, **p < 0.01, and ***p < 0.001; (n = 5) with respect to the number of clusters/mouse brain (n = 5 males). Scale bars are included in the images
Fig. 4
Fig. 4
Evaluation of Iba1+ cells in the hippocampus of SAM mice aged 2 and 10 months. Thirty micrometers brain coronal cryostat sections obtained as in material and methods were stained with Iba1 (red) and nuclei with DAPI (blue). (a) (i) Hpp area used in the quantification of Iba1+ are surrounded by a box, differing in CA1 (cornus ammonis, dark green) and DG (dentate gyrus, soft green), as shown in the scheme. (ii) Scheme of sample collection: six coronal sections, 30 μm each, separated 300 μm one to each other were collected and processed. Sampling started at first appearance of the infrapyramidal blade of the dentate gyrus (DG) from approximately Bregma −1.2 mm to −2.7 mm. (iii) Representative map of the hippocampus (Hpp) showing the expression of BP Iba1+ myeloid cells Iba1+ in 10 m SAMR1 mice and indicating the regions used for counting. Images at ×40 (×1.7 digital zoom) were obtained with a Leica SP5 TCS inverted fluorescence confocal microscope and the areas were processed and evaluated with ImageJ. stratum oriens (so); stratum pyramidale (sp); stratum radiatum (sr); stratum lacunosum-moleculare (sm); stratum moleculare (sm), granule cell layer (sg); polymorph layer (po). Scale bars are included in the image. (b) (i) Quantification of Iba1+ cells in the area described in 2 months (triangles) and 10 months (circles) SAM mice. Data are number on Iba1+ cells per individual Hpp (n = 5 male). (ii) Fold change of Hpp Iba1+ of 10 months versus 2 months in SAMR1 and SAMP8 mice. *p < 0.05; **p < 0.01, and ***p < 0.001 with respect to Iba-1 +/mm2 cells in Hpp from SAMR1 2m (n = 5 males). In (i) and (ii) SAMR1 data are shown in green and SAMP8 in red
Fig. 5
Fig. 5
Isolation and quantification of CD45-positive brain cells. (a) (i) Cartoon representing brain cells isolation procedure. (ii) Representative flow cytometry dot plots of live cells isolated from brain (except cerebellum and olfactory bulb (OB) and m/Ch). Cells were isolated and stained with control isotype antibody (APC-labeled rat IgG2b) or with APC-labeled rat anti-mouse CD45. Black box marks CD45+ cells. Gating strategy was as presented in additional Fig 2s. (iii) The box and whisker plot shows arithmetic mean ± 25-75 quartile (box) and minimum and maximal values (lines) (n = 10) of the percentage of total CD45+ cells isolated from 10 months SAMR1 (green) and SAMP8 (red) brains. (b) (i) Cells were stained with PE-Cy7-labeled rat anti-mouse CD45 together with 488 rat anti-mouse CD11b. CD45m cells are marked with red box and CD45h cells with a blue box. (ii) Cells were stained with PE-Cy7 rat anti-mouse CD45 plus APC rat IgG2b as isotype control (a); APC rat anti-mouse CD49d (b) or APC rat anti-mouse P2RY12 (c). Shown are representative dot plots obtained for cells isolated from 10 months SAMP8 animals that were similar to cell preparations from young and old SAMR1 and SAMP8 animals. (iii) Box and whisker plot as in panel A iii (n = 10), representing the percentage of total CD45h cells isolated from 10 months SAMR1 (green) and SAMP8 (red) brains. (ns) Indicates no statistically difference between specified groups applying statistical methods as in material and methods
Fig. 6
Fig. 6
Higher Il-1β expression occurs mainly in aged SAMP8 CD45+ brain parenchymal cells. qRT-PCR analysis of Il-1β mRNA expression. (a) (i) Scheme of BP CD45 magnetic cell separation used for CD45+ isolation, and histograms (bottom) showing the CD45 staining by cytometry from CD45+ and CD45 fraction. Quantification of BP CD45+ obtained in positive fraction that was of 97 ± 2% (arithmetic mean ± SEM (n = 5) of CD45+ cells from alive cells, determined as in additional Fig 2s. (ii) Il-1β mRNA expression from BP CD45+ isolated cells from young (2 months) and aged (10 months) SAMR1 (green) and SAMP8 (red) animals. Data in the box and whisker plot (as in Fig. 5a iii) are presented as dCt (Ct il1β-Ct 36b4). Lower values of dCt means higher Il-1β transcript expression in the sample. (iii) Relative quantification of Il-1β mRNA expression was referred to average values of 2 months old SAMR1 as control animals that were given a value of 1. Plot represents individual values are mean ± SEM of n = 3 to 6 male brains. SAMR1 is shown in green and SAMP8 in red. Two months data are represented with triangles and 10 months data with circles. (b) (i) Dissected choroid plexus and meningeal membranes (m/Ch) were pooled into an Eppendorf tube and total RNA was obtained as indicated in material and methods. Specific brain regions were stained with anti CD31 for brain vessels (red), Iba1 (green) and DAPI for nuclei (blue), and representative images of these areas were taken with a SP5 Leica TCS confocal fluorescent microscope, show abundance of Iba1+ cells (green) by immunofluorescence in both brain localizations. Scale bars are included in the images. (ii) Il-1β mRNA expression from m/Ch preparations from young (2 months) and aged (10 months) SAMR1 (green) and SAMP8 (red) animals. Specific mRNAs were amplified from total mRNA qRT-PCR using 36b4 as reference gene. Data are presented as dCt (Ct il1β-Ct 36b4) as in panel A (ii). Lower values of dCt means higher Il-1β transcript expression in the sample. (iii) As before, relative quantification of Il-1β mRNA expression was referred to average values of 2 months old SAMR1 m/Ch values as control animals that were given a value of 1. Two months data are represented with triangles and 10 months data with circles. SAMR1 is shown in green and SAMP8 in red. Plot represents individual values are mean ± SEM of n=3 to 6 male brains. **p < 0.01 and ***p < 0.001: (ns) means non-significant differences, n ≥ 3 male
Fig. 7
Fig. 7
bMyC from brain parenchyma (BP) and m/Ch respond to low doses of systemic LPS. Isolated CD45+ cells were isolated form BP and m/Ch preparation as in Fig. 6. (a) BP CD45+ (b) m/Ch preparations, from aged (10 months) old SAMR1 (green bars) and SAMP8 (red bars) that were injected with saline (empty bars) or LPS (1 mg/mL) (stripped bars) for 3 h and Il-1β (panel i), Tnf-α (panel ii), Il-6 (panel iii), and Ccl2 (panel iv) mRNA expression was then qRT-PCR as before. Cytokines-specific mRNAs increased significantly 3 h after the injection of LPS. Data in box and whisker plots are presented as dCt (Ct Gene-Ct 36b4). (mean ±SEM) n = 3 males). Lower values of dCt means higher cytokine transcript expression in the sample. SAMR1 is shown in green and SAMP8 in red. Two months data are represented with triangles and 10 months with circles **p < 0.01 and ***p < 0.001. (ns) means non-significant differences between specified groups, n ≥ 3 males

Similar articles

Cited by

References

    1. Conde JR, Streit WJ. Microglia in the aging brain. J Neuropathol Exp Neurol. 2006;65(3):199–203. - PubMed
    1. Streit WJ, Sammons NW, Kuhns AJ, Sparks DL. Dystrophic microglia in the aging human brain. Glia. 2004;45(2):208–212. - PubMed
    1. Lee CK, Weindruch R, Prolla TA. Gene-expression profile of the ageing brain in mice. Nat Genet. 2000;25(3):294–297. - PubMed
    1. Lu T, Pan Y, Kao SY, Li C, Kohane I, Chan J, et al. Gene regulation and DNA damage in the ageing human brain. Nature. 2004;429(6994):883–891. - PubMed
    1. Ximerakis M, Lipnick SL, Innes BT, Simmons SK, Adiconis X, Dionne D, et al. Single-cell transcriptomic profiling of the aging mouse brain. Nat Neurosci. 2019;22(10):1696–1708. - PubMed