. 2021 May:206:108541.
doi: 10.1016/j.exer.2021.108541. Epub 2021 Mar 16.

Role of the superior salivatory nucleus in parasympathetic control of choroidal blood flow and in maintenance of retinal health

Affiliations

Role of the superior salivatory nucleus in parasympathetic control of choroidal blood flow and in maintenance of retinal health

Chunyan Li et al. Exp Eye Res. 2021 May.

Abstract

The vasodilatory pterygopalatine ganglion (PPG) innervation of the choroid is under the control of preganglionic input from the superior salivatory nucleus (SSN), the parasympathetic portion of the facial motor nucleus. We sought to confirm that choroidal SSN drives a choroid-wide vasodilation and determine if such control is important for retinal health. To the former end, we found, using transscleral laser Doppler flowmetry, that electrical activation of choroidal SSN significantly increased choroidal blood flow (ChBF), at a variety of choroidal sites that included more posterior as well as more anterior ones. We further found that the increases in ChBF were significantly reduced by inhibition of neuronal nitric oxide synthase (nNOS), thus implicating nitrergic PPG terminals in the SSN-elicited ChBF increases. To evaluate the role of parasympathetic control of ChBF in maintaining retinal health, some rats received unilateral lesions of SSN, and were evaluated functionally and histologically. In eyes ipsilateral to choroidal SSN destruction, we found that the flash-evoked scotopic electroretinogram a-wave and b-wave peak amplitudes were both significantly reduced by 10 weeks post lesion. Choroidal baroregulation was evaluated in some of these rats, and found to be impaired in the low systemic arterial blood pressure (ABP) range where vasodilation normally serves to maintain stable ChBF. In retina ipsilateral to SSN destruction, the abundance of Müller cell processes immunolabeled for glial fibrillary acidic protein (GFAP) and GFAP message were significantly upregulated. Our studies indicate that the SSN-PPG circuit mediates parasympathetic vasodilation of choroid, which appears to contribute to ChBF baroregulation during low ABP. Our results further indicate that impairment in this adaptive mechanism results in retinal dysfunction and pathology within months of the ChBF disturbance, indicating its importance for retinal health.

Keywords: Autonomic; Choroidal blood flow (ChBF); Parasympathetic; Retinal degeneration; Superior salivatory nucleus (SSN).


Conflict of interest statement

Declarations of competing interest

None.

Figures

Fig. 1.
Fig. 1.
Panels A–C show schematics of the three ChBF recording sites for the right eye (RE), the anterior temporal site (1), the anterior nasal site (2), and the posterior nasal site (3), as seen in a dorsal view (A), lateral view (B), and medial view (C). Panels D–O show images of choroidal SSN just lateral to the facial motor nuclear complex, at a level corresponding to Paxinos and Watson (2009) −10.5 mm Bregma, in a ChAT-immunostained section at a low (D) and a high magnification (E), the stimulation site in choroidal SSN in rat RChBF52 as indicated by cfos+ neurons at the stimulation site at a high (F) and a low magnification (G), choroidal SSN just lateral to the facial motor nuclear complex in a nNOS-immunostained section at a low (H) and a high magnification (I), the stimulation site in choroidal SSN in rat RChBF53 as indicated by cfos+ neurons at the stimulation site (note electrode track at upper edge of the field of cfos+ neurons) at a high (J) and a low magnification (K), the level of the stimulation site in rostral choroidal SSN in rat RChBF29 in a ChAT-immunolabeled section at low magnification (L), the stimulation site in rostral choroidal SSN in rat RChBF29 at higher magnification as indicated by cfos in nNOS+ neurons of choroidal SSN (M), a higher magnification view of two cfos+/nNOS+ choroidal SSN neurons in RChBF29 (N), and the stimulation site in rostral choroidal SSN in rat RChBF29 as indicated by cfos in nNOS+ neurons of choroidal SSN at the same low magnification as shown in panel L (O). The ChAT and nNOS immunolabeling was detected with a brown DAB reaction product, while cfos was detected with a black nickel-enhanced DAB reaction product. The scale bar in M pertains to E, F, I, and J as well, while that in L pertains to D, G, H, K and O as well. Abbreviations: ChAT – choline acetyltransferase; cSSN – choroidal subdivision of SSN; IHC – immunohistochemistry; IR – inferior rectus muscle; LR – lateral rectus muscle; MR – medial rectus muscle; nNOS – neuronal nitric oxide synthase; RE – right eye; SO – superior oblique muscle; SR – superior rectus muscle.
Fig. 2.
Fig. 2.
Effect of choroidal SSN stimulation on ChBF, ChBVol, ChBVel, and ABP responses with metal electrodes at the anterior temporal (A, n = 5), anterior nasal (B, n = 2) and posterior nasal (C, n = 5) recording sites, and with glass micropipette electrodes at the anterior nasal site (D, n = 7). Stimulation yielded significant increases in mean and peak ChBF and ChBVel at all sites with metal electrodes, and ChBF, ChBVol, and ChBVel were all significantly increased at the anterior nasal site with glass micropipette electrodes. Asterisks indicate significantly different from baseline, and pound symbol indicates a trend toward significance.
Fig. 3.
Fig. 3.
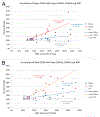
Correlation of mean (A) and peak (B) ChBF with mean and peak ChBVol (blue regression line), ChBVel (red regression line), and ABP (grey regression line) across all animals and all recording sites (n = 19). The formula boxes show the slope and y-intercept for the regression lines, and the r2 values for the regressions. Note that ChBVel is highly correlated with ChBF, ChBVol is less correlated with ChBF, and ABP is not correlated with ChBF.
Fig. 4.
Fig. 4.
Graph showing the time course of the mean ChBF, ChBVol, ChBVel and ABP responses to choroidal SSN stimulation, for six of the rats with glass micropipette stimulation. The blue bar marks the stimulation period. Each data point is the mean for a 250 ms interval, and ChBF, ChBVol, ChBVel and ABP responses are all expressed as percent of basal. The rapid ChBF rise is driven by rapid increases in both choroidal blood velocity and volume, with the ChBVel rise being somewhat earlier than the ChBVol rise, consistent with our overall analysis showing a somewhat greater role of blood flow velocity increases in the ChBF increase.
Fig. 5.
Fig. 5.
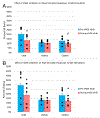
Histograms showing the mean (A) and peak (B) ChBF, ChBVol and ChBVel responses to choroidal SSN stimulation, expressed as a percent of basal ChBF, ChBVol and ChBVel responses, prior to NOS inhibition and after NOS inhibition (n = 5). Note that SSN stimulation prior to NOS inhibition yielded significant ChBF, ChBVol and ChBVel increases, and that NOS inhibition attenuated the ChBF, ChBVol and ChBVel increases. Asterisks indicate significantly less than prior to NOS inhibition, pound symbol indicates a trend toward significance.
Fig. 6.
Fig. 6.
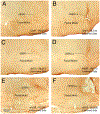
Images showing right choroidal SSN in several rats, three to four months after an electrolytic lesion. Sections were immunolabeled for ChAT or nNOS, both of which are found in choroidal SSN neurons, to assess lesion accuracy. Successful (100%) destruction of right choroidal SSN is shown for rat RLS13 immunolabeled for ChAT (B) and nNOS (D) compared to choroidal SSN of the left side of its brain, and for right choroidal SSN for RLS36 immunolabeled for nNOS (F), compared to the left side of its brain (E). Left side images are flipped horizontally for ease of comparison to the right side. Abbreviations: ChAT – choline acetyltransferase; cSSN – choroidal subdivision of SSN; Lx – lesion; nNOS – neuronal nitric oxide synthase.
Fig. 7.
Fig. 7.
Graphs showing the mean flash-evoked scotopic a-wave peak amplitudes (A, B) and b-wave (C, D) peak amplitudes for the right eye in response to a series of light flashes, prelesion and at two different time points post lesion, for rats with lesions that destroyed right choroidal SSN (A, C) compared to rats with lesions that missed right choroidal SSN (B, D). Amplitudes are expressed as a percent of the pre-lesion response to the brightest light flash to facilitate comparisons between rats with SSN destruction and rats without. Panel A. At 4 and 10 weeks post-lesion, a-wave peak was significantly reduced for the right eye in right SSN-Lx rats (n = 11) compared to prelesion (n = 10) for the three brightest light intensities (asterisks). Panel B. The a-wave peak of the right eye for the three brightest light intensities was not significantly reduced in right SSN-miss rats (n = 9) compared to prelesion (n = 9) at 4 weeks post lesion attempt, but it was at ten weeks (asterisk). Panel C. At 10 weeks post lesion, the b-wave peak was significantly reduced for the right eye in right SSN-Lx rats (n = 11) compared to prelesion (n = 10) for the five brightest light intensities (asterisk). Panel D. The b-wave peak was not significantly reduced for the right eye in right SSN-miss rats (n = 9) compared to prelesion (n = 9) for the five brightest light intensities at either 4 or 10 weeks post lesion attempt.
Fig. 8.
Fig. 8.
Graphs showing the mean flash-evoked scotopic a-wave (A, B) and b-wave (C, D) peak amplitudes for the left eye in response to a series of light flashes, prelesion and at two different time points post lesion, for rats with lesions that destroyed right choroidal SSN (A, C) compared to rats with lesions that missed right choroidal SSN (B, D). Amplitudes are expressed as a percent of the prelesion response to the brightest light flash to facilitate comparisons between rats with SSN destruction and rats without. Panel A. At 10 weeks post lesion, but not 4 weeks, the a-wave peak was significantly reduced for the left eye in right SSN-Lx rats (n = 11) compared to pre-lesion (n = 10) for the 3 brightest light intensities (asterisk). Panel B. At neither 4 nor 10 weeks post SSN-miss was the a-wave peak significantly reduced for the left eye in right SSN-miss rats (n = 9) compared to prelesion (n = 9) for the three brightest light intensities. Panel C. At 10 weeks but not 4 weeks post lesion, the b-wave peak was significantly reduced for the left eye in right SSN-Lx rats (n = 11) compared to prelesion (n = 10) for the five brightest light intensities (asterisk). Panel D. At neither 4 nor 10 weeks post SSN-miss was the b-wave peak significantly reduced for the left eye in right SSN-miss rats (n = 9) compared to prelesion (n = 9) for the five brightest light intensities.
Fig. 9.
Fig. 9.
The graph shows ChBF plotted as a function of ABP for rat eyes ipsilateral to right choroidal SSN destruction (A, n = 3) compared to rats with lesions that missed right choroidal SSN (B, n = 3), with both ChBF and ABP expressed as a percent of basal. Mean ChBF performance is plotted per 5 mmHg ABP bin over a range of 40% below and 60% above basal ABP. The blue line shows ChBF as it would be if it linearly followed ABP. The formula boxes show the slope and y-intercept for the regression lines, and the r2 value for the regressions. Panel A. The graph shows ChBF plotted as a function of ABP, in eyes ipsilateral to SSN-Lx. Note that ChBF during ABP <100% of basal changed nearly linearly with ABP. The magenta box shows that the slope of the ABP-ChBF relationship during low ABP approached 1, and their correlation was 0.716. ChBF remained relatively flat, however, at ABP greater than 100% of basal, the green box showing a flat slope and low correlation of the ABP-ChBF relationship. Panel B. The graph shows ChBF plotted as a function of ABP, in eyes ipsilateral to lesions that missed SSN. Note that ChBF during ABP <100% of basal changed little as ABP changed. The magenta box shows that the slope of the ABP-ChBF relationship during low ABP approached 0, and their correlation was also nearly 0. ChBF remained relatively flat also at ABP greater than 100% of basal, the green box showing a flat slope and low correlation of the ABP-ChBF relationship.
Fig. 10.
Fig. 10.
Images showing that VIP+ parasympathetic innervation is evident throughout choroid, as evidenced by the abundance of vascular innervation in the superior (A), inferior (B), temporal (C) and nasal (D) sectors of the eye. Moreover, neither the parasympathetic innervation nor sympathetic innervation is obviously affected by lesions of choroidal SSN, as evidenced by similar immunolabeling for VIP for equatorial temporal choroid ipsilateral to destruction of choroidal SSN (E) compared to contralateral to the lesion (F), and similar immunolabeling for VMAT2 in equatorial temporal choroid ipsilateral to destruction of choroidal SSN (G) compared to contralateral to the lesion (H).
Fig. 11.
Fig. 11.
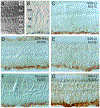
Images showing the effects of destruction of choroidal SSN on GFAP immunolabeling of retinal Müller cell processes in the ipsilateral eye ~3 months post lesion. Images A and B show retinal layer organization, while images D and F show retina ipsilateral to a missed SSN lesion (D) or after no lesion (F), and images C, E, and G show retina ipsilateral to choroidal SSN destruction (cSSN-Lx). Note that in cSSN-Lx rats, intense GFAP immunolabeling was seen in Müller cell processes in the IPL of the ipsilateral eye (C, E, and G), but not in control retinas (D, F). GFAP upregulation occurred throughout the topographic extent of the retina (images show superior retina). Abbreviations: GCL – ganglion cell layer; INL – inner nuclear layer; IPL – inner plexiform layer; IS – inner segments; ONL – outer nuclear layer; OPL – outer plexiform layer; OS – outer segments; NFL – nerve fiber layer.
Fig. 12.
Fig. 12.
In rats with unilateral right destruction of choroidal SSN (n = 12), intense GFAP immunolabeling was seen in Müller cell processes in IPL in both eyes, but not in control retinas, which included SSN-miss cases and normal control rats (n = 11). Using a scoring system for the GFAP immunolabeling of Müller cell processes (Kimble et al., 2006), labeling in SSN-Lx retinas at a mean postlesion survival of 13.5 weeks was significantly elevated (asterisk) above that in control retinas with a mean post-lesion survival of 11.5 weeks for both eyes. Regression analysis showed the GFAP score was uncorrelated with survival across SSN-Lx and SSN-miss cases.

Similar articles

Cited by

References

    1. Alm A, 1992. Ocular circulation. In: Hart WM (Ed.), Adler’s Physiology of the Eye: Clinical Application. Mosby, St Louis, pp. 198–227.
    1. Alm A, Bill A, 1973. The effect of stimulation of the cervical sympathetic chain on retinal oxygen tension and on uveal, retinal and cerebral blood flow in cats. Acta Physiol. Scand 88, 84–94. 10.1111/j.1748-1716.1973.tb05436.x. - DOI - PubMed
    1. Bhutto IA, Baba T, Merges C, McLeod DS, Lutty GA, 2010. Low nitric oxide synthases (NOSs) in eyes with age-related macular degeneration (AMD). Exp. Eye Res 90, 155–167. - PMC - PubMed
    1. Bill A, 1985. Some aspects of the ocular circulation. Invest. Ophthalmol. Vis. Sci 26, 410–424. - PubMed
    1. Bill A, Sperber GO, 1990. Control of retinal and choroidal blood flow. Eye 4 (Pt2), 319–325. 10.1038/eye.1990.43. - DOI - PubMed

Publication types