. 2021 Mar 18;14(3):dmm047589.
doi: 10.1242/dmm.047589.

Murine myeloid cell MCPIP1 suppresses autoimmunity by regulating B-cell expansion and differentiation

Affiliations

Murine myeloid cell MCPIP1 suppresses autoimmunity by regulating B-cell expansion and differentiation

Ewelina Dobosz et al. Dis Model Mech. .

Abstract

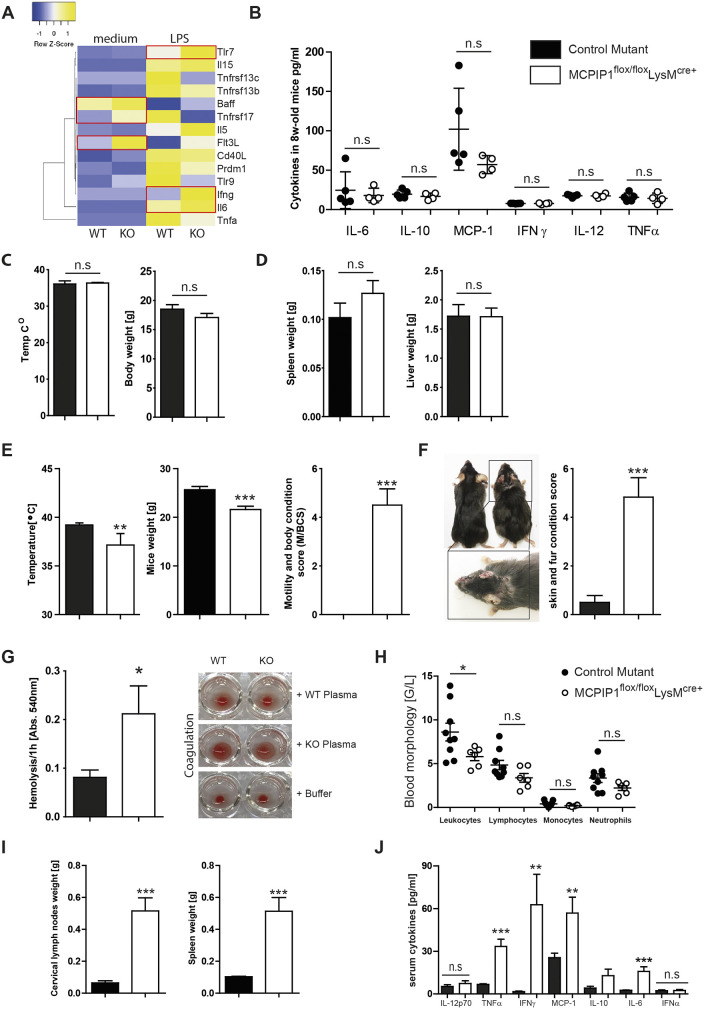
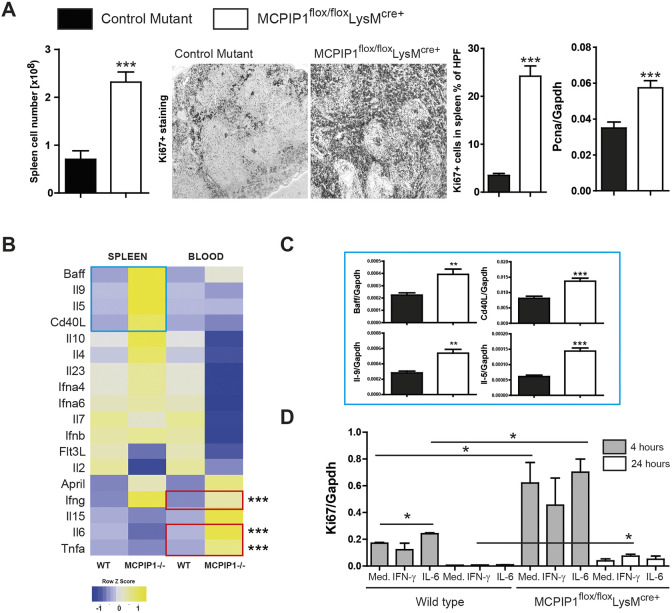
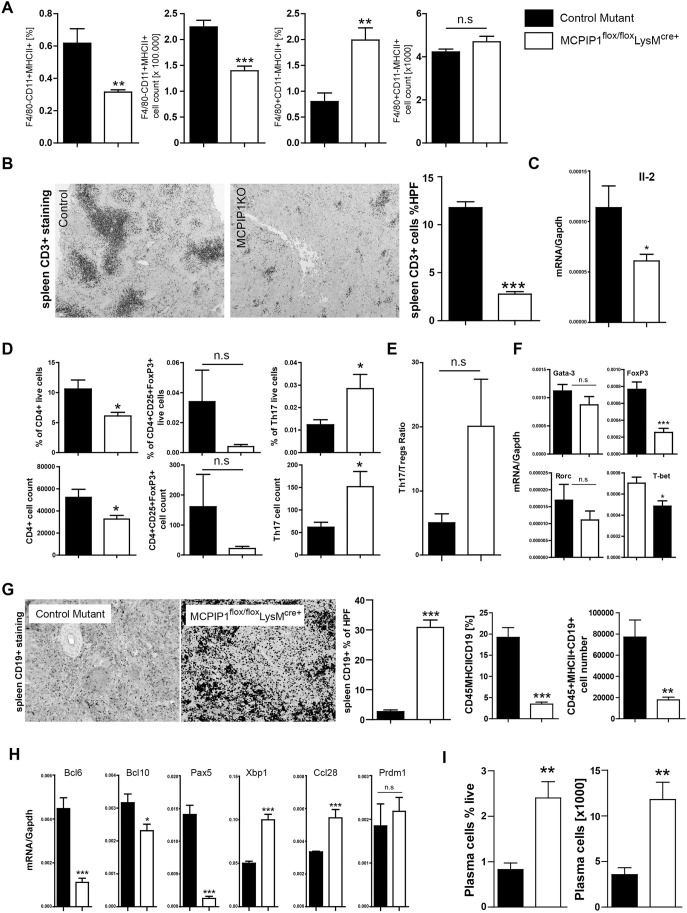
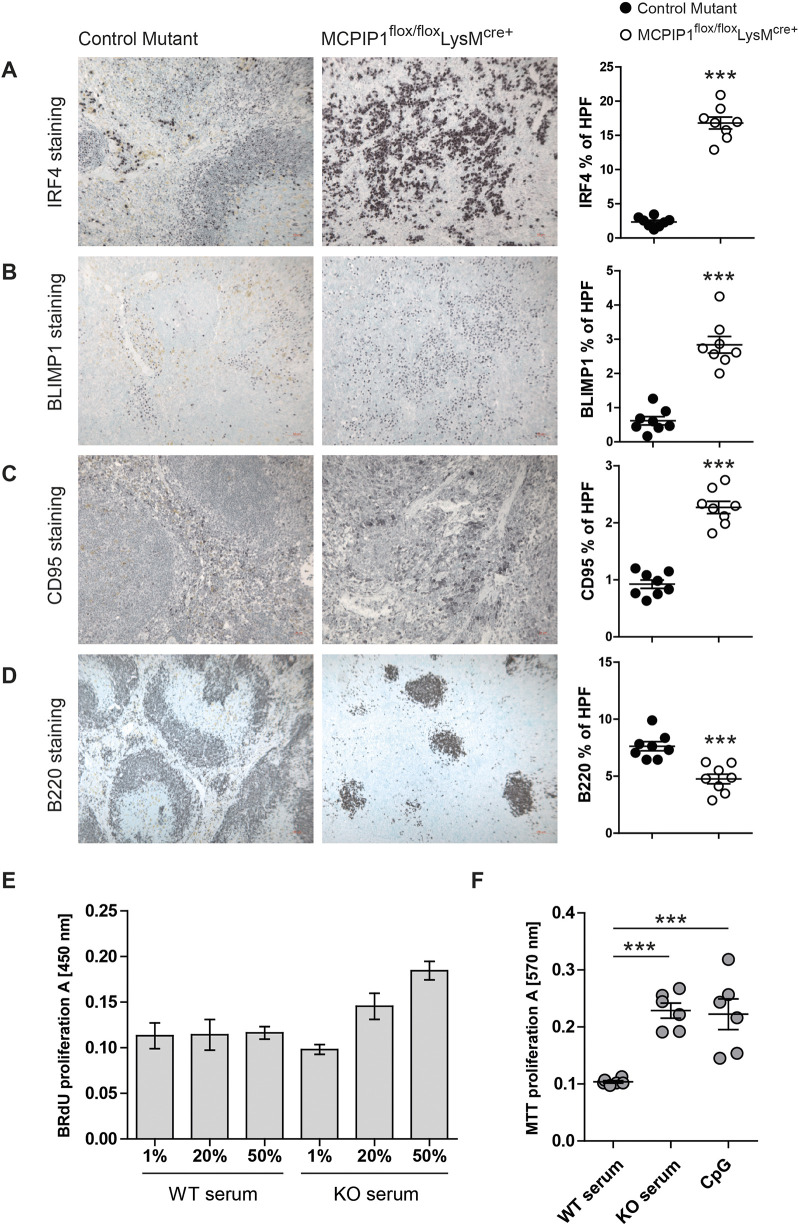
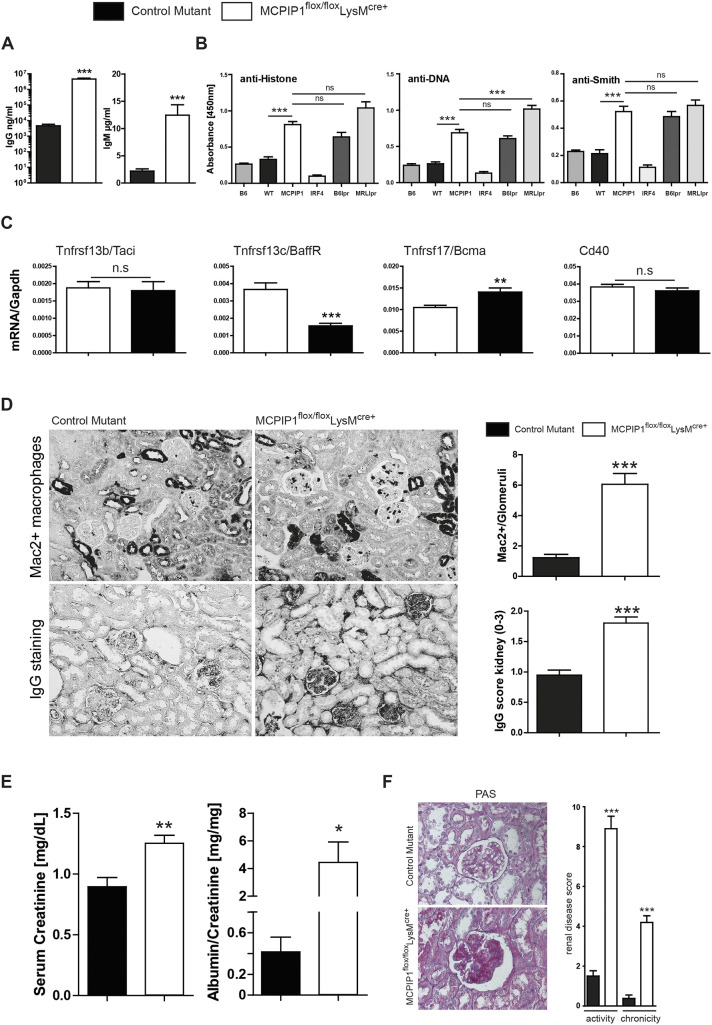
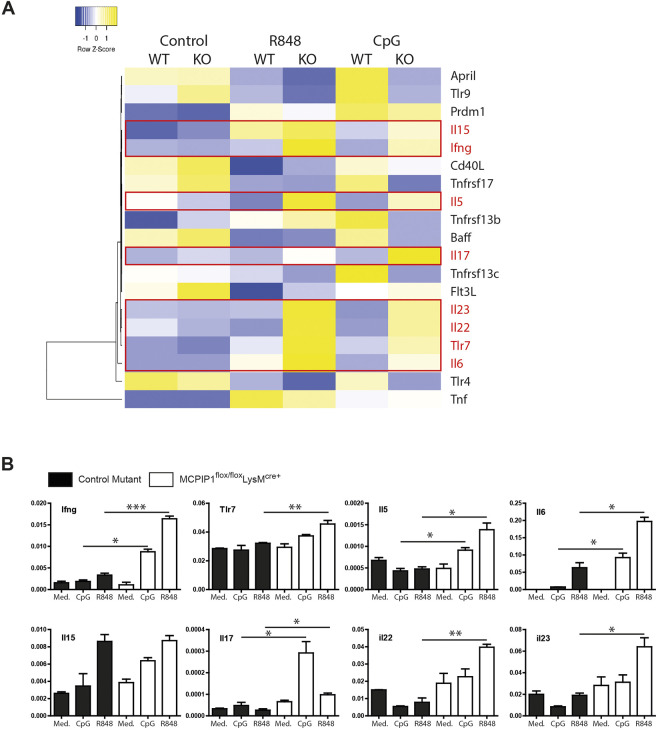
Myeloid-derived cells, in particular macrophages, are increasingly recognized as critical regulators of the balance of immunity and tolerance. However, whether they initiate autoimmune disease or perpetuate disease progression in terms of epiphenomena remains undefined.Here, we show that depletion of MCPIP1 in macrophages and granulocytes (Mcpip1fl/fl-LysMcre+ C57BL/6 mice) is sufficient to trigger severe autoimmune disease. This was evidenced by the expansion of B cells and plasma cells and spontaneous production of autoantibodies, including anti-dsDNA, anti-Smith and anti-histone antibodies. Consequently, we document evidence of severe skin inflammation, pneumonitis and histopathologic evidence of glomerular IgG deposits alongside mesangioproliferative nephritis in 6-month-old mice. These phenomena are related to systemic autoinflammation, which secondarily induces a set of cytokines such as Baff, Il5, Il9 and Cd40L, affecting adaptive immune responses. Therefore, abnormal macrophage activation is a key factor involved in the loss of immune tolerance.Overall, we demonstrate that deficiency of MCPIP1 solely in myeloid cells triggers systemic lupus-like autoimmunity and that the control of myeloid cell activation is a crucial checkpoint in the development of systemic autoimmunity.

Keywords: Autoantibodies; Autoimmunity; Lupus nephritis; MCPIP1; Myeloid cells.


Conflict of interest statement

Competing interestsThe authors declare no competing or financial interests.

Figures

Fig. 1.
Fig. 1.
MCPIP1 suppresses autoinflammation and lymphoproliferation in 6-month-old mice. (A) Heat map depicting the altered genes from expression analysis of pre-selected genes in bone marrow-derived macrophages isolated from wild type (WT) and MCPIP1 knockouts (KO) and stimulated with 10 ng/ml ultrapure LPS. Red frames mark the genes that were significantly upregulated. (B) Knockout and control mice were bled at 2 months to determine serum levels of IL-6, IL-12, IL-10, IFN-γ, MCP-1 and TNF-α. Data represent means±s.e.m. from at least four mice per group. (C) At 2 months of age, MCPIP1-deficient mice had normal body weight and temperature. Data represent means±s.e.m. from at least four mice per group. (D) At 2 months of age, MCPIP1-deficient mice exhibited no hyperplasia, no lymphoproliferation/splenomegaly and no hepatomegaly. The weights of organs from four mice per group are presented as means±s.e.m. (E) At 6 months of age, MCPIP1-deficient mice displayed decreased body temperature, decreased body weight and increased motility. Data from eight mice per group are presented as means±s.e.m.; **P<0.01, ***P<0.001. (F) At 6 months of age, macrophage-specific MCPIP1-deficient mice exhibited massive skin inflammation. Eight mice per group were scored, and data are presented as means±s.e.m.; ***P<0.001. (G) Macrophage-specific MCPIP1-deficient mice displayed increased hemolysis (means±s.e.m.; *P<0.05) and decreased blood coagulation. (H) Blood morphology revealed a significantly decreased number of leukocytes in knockout mice. Data from at least six mice per group are presented as means±s.e.m.; *P<0.05 (I) At 6 months of age, macrophage-specific MCPIP1-deficient mice exhibited massive hyperplasia of cervical, axillar and mesenteric lymph nodes as well as splenomegaly. The weights of cervical lymph nodes and spleens from 16 mice per group are presented as means±s.e.m.; ***P<0.001. (J) Knockout and control mice were bled at 6 months to determine serum levels of IL-6, IL-12, IL-10, IFN-γ, MCP-1, TNF-α and IFN-α. Data represent means±s.e.m. from at least 16 mice per group; **P<0.01, ***P<0.001. n.s., not significant.
Fig. 2.
Fig. 2.
MCPIP1 regulates the proliferation of splenocytes. (A) Splenocytes were quantified by flow cytometry; spleen sections were stained with Ki67 proliferation marker and quantified using image software as described in the Materials and Methods (magnification ×100). RNA was isolated from knockout and control mice for real-time PCR analysis. Data are expressed as means of the ratio of Pcna versus that of Gapdh mRNA. Data are means±s.e.m. from at least eight mice per group; ***P<0.001 versus control mice. (B) Heat map depicting the splenic and whole-blood expression of pre-selected genes of wild type and MCPIP1 knockouts. Red frames mark the genes that were significantly upregulated in the blood; blue frames mark the genes that were considerably changed in the spleen. (C) Genes that were considerably changed in the spleen were investigated in a larger sample (eight wild type versus eight knockouts). (D) Freshly isolated splenocytes were stimulated with selected cytokines to investigate their potential role in splenomegaly. Expression levels of transcripts were quantified by real-time PCR. Data are shown as means of the ratio of the specific mRNA versus that of Gapdh mRNA; *P<0.05, **P<0.01, ***P<0.001.
Fig. 3.
Fig. 3.
MCPIP1 suppresses the activation of macrophages and, indirectly, Th17 lymphocytes and B-cell subsets. (A) The total number of CD11c+ dendritic cells and F4/80+ macrophages and their activation in spleens was quantified by flow cytometry in both investigated genotypes as described in the Materials and Methods. Data represent means±s.e.m. from at least eight mice per group. **P<0.01, ***P<0.001 versus control mice. (B) Spleen sections were stained for CD3+ T cells and quantified with image software as described in the Materials and Methods (magnification ×100). Data are means±s.e.m. from at least eight mice per group; ***P<0.001. RNA was isolated from spleens, and mRNA levels in spleen were analyzed for relevant transcripts. (C) Expression levels of Il2 were quantified by real-time PCR. Data are shown as means of the ratio of the specific mRNA versus that of Gapdh mRNA; *P<0.05. (D,E) The total numbers of the CD4+ T-cell subset (D) and Th17/Treg ratio (E) were quantified by flow cytometry in both investigated genotypes as described in the Materials and Methods. Data represent means±s.e.m. from at least eight mice per group. *P<0.05 versus control mice. (F) mRNA levels of T-cell-relevant transcription factors in spleens were quantified by real-time PCR. Data are shown as means of the ratio of the specific mRNA versus that of Gapdh mRNA; *P<0.05, ***P<0.001 versus control mice. (G) Spleen sections were stained for CD19+ B cells and quantified with image software as described in the Materials and Methods (magnification ×200). Data are means±s.e.m. from at least eight mice per group; ***P<0.001. The total numbers of spleen B220+/CD19+/MHCII+ cells were quantified in 6-month-old mice by flow cytometry. Data are means±s.e.m. of at least eight mice per group; **P<0.01, ***P<0.001 versus control mice. (H) mRNA levels in the spleen were analyzed for B-cell survival and stimulatory factors. Expression levels were quantified by real-time PCR. Data are shown as means of the ratio of the specific mRNA versus that of Gapdh mRNA; *P<0.05, ***P<0.001. (I) Mature B cells and kappa light chain+ CD138+ (also known as Sdc1+) plasma cells were quantified in 6-month-old mice by flow cytometry. Data are means±s.e.m. of at least eight mice per group; **P<0.01 versus control mice. n.s., not significant.
Fig. 4.
Fig. 4.
Macrophage-derived MCPIP1 regulates B-lymphocyte expansion in lymphoid organs. (A-D) Spleen sections were stained with anti-mouse IRF4, BLIMP1, CD95 and B220 antibodies and quantified by Adobe Photoshop software as percentage of positively stained high-power field (HPF) from eight mice per group; ***P<0.001. (magnification ×200, A,B; ×400, C; ×100, D) (E) The proliferative activity of primary B lymphocytes stimulated with serum from wild-type and knockout mice. Data are means±s.e.m. (F) The proliferative activity of A20 B-lymphocyte cell line stimulated with serum from wild-type and knockout mice and CpG. Data are means±s.e.m.; ***P<0.001.
Fig. 5.
Fig. 5.
Macrophage-derived MCPIP1 limits antibody production and kidney injury. (A,B) Mice from both groups were bled at 6 months to determine serum levels of IgG and IgM (A), as well as anti-histone, anti-dsDNA and anti-Smith autoantibodies (B) by ELISA. Data show means±s.e.m. from at least 16 mice per group; ***P<0.001 versus control mice. (C) mRNA levels in the spleen were analyzed for B-cell-relevant genes. Expression levels were quantified by real-time PCR. Data are shown as means of the ratio of the specific mRNA versus that of Gapdh mRNA; **P<0.01, ***P<0.001. (D) Kidney sections were stained for Mac2 and total IgG, and quantified by counting (Mac2) or by using a semi-quantitative score (IgG) (magnification ×400). Data are shown as means of at least 40 scored HPFs or quantified in glomeruli from at least eight mice per group; ***P<0.001. (E) Kidney parameters were measured in both groups of mice. Data are means±s.e.m. of eight to 16 mice per group; *P<0.05, **P<0.01 versus control mice. (F) Kidney sections were stained with periodic acid–Schiff (PAS) and Masson Trichrome, and quantified using a semi-quantitative score (magnification ×400). Data are shown as means of at least 40 scored HPFs or quantified in glomeruli from at least eight mice per group; ***P<0.001. n.s., not significant.
Fig. 6.
Fig. 6.
MCPIP1 orchestrates autoimmunity by affecting TLR7 and TLR9 signaling. (A) Heat map depicting the altered genes from expression analysis of pre-selected genes in bone marrow-derived macrophages isolated from wild type and MCPIP1 knockouts and stimulated with R848 and CpG. Red marks the genes that were upregulated in knockouts upon stimulation. (B) Expression of selected genes was determined in bone marrow-derived macrophages 4 h post-stimulation with R848 and CpG. Data represent means±s.e.m.; *P<0.05, **P<0.01, ***P<0.001.

References

    1. Bengtsson, A. A., Sturfelt, G., Truedsson, L., Blomberg, J., Alm, G., Vallin, H. and Rönnblom, L. (2000). Activation of type I interferon system in systemic lupus erythematosus correlates with disease activity but not with antiretroviral antibodies. Lupus 9, 664-671. 10.1191/096120300674499064 - DOI - PubMed
    1. Benson, M. J., Dillon, S. R., Castigli, E., Geha, R. S., Xu, S., Lam, K.-P. and Noelle, R. J. (2008). Cutting edge: the dependence of plasma cells and independence of memory B cells on BAFF and APRIL. J. Immunol. 180, 3655-3659. 10.4049/jimmunol.180.6.3655 - DOI - PubMed
    1. Birnberg, T., Bar-On, L., Sapoznikov, A., Caton, M. L., Cervantes-Barragán, L., Makia, D., Krauthgamer, R., Brenner, O., Ludewig, B., Brockschnieder, D.et al. (2008). Lack of conventional dendritic cells is compatible with normal development and T Cell homeostasis, but causes myeloid proliferative syndrome. Immunity 29, 986-997. 10.1016/j.immuni.2008.10.012 - DOI - PubMed
    1. Castro, G., Liu, X., Ngo, K., De Leon-Tabaldo, A., Zhao, S., Luna-Roman, R., Yu, J., Cao, T., Kuhn, R., Wilkinson, P.et al. (2017). RORγt and RORα signature genes in human Th17 cells. PLoS ONE 12, e0181868. 10.1371/journal.pone.0181868 - DOI - PMC - PubMed
    1. Charo, I. F. and Ransohoff, R. M. (2006). The many roles of chemokines and chemokine receptors in inflammation. N. Engl. J. Med. 354, 610-621. 10.1056/NEJMra052723 - DOI - PubMed

Publication types

MeSH terms

LinkOut - more resources