. 2021 Mar 23;118(12):e2021758118.
doi: 10.1073/pnas.2021758118.

Vagus nerve stimulation activates two distinct neuroimmune circuits converging in the spleen to protect mice from kidney injury

Affiliations

Vagus nerve stimulation activates two distinct neuroimmune circuits converging in the spleen to protect mice from kidney injury

Shinji Tanaka et al. Proc Natl Acad Sci U S A. .

Abstract

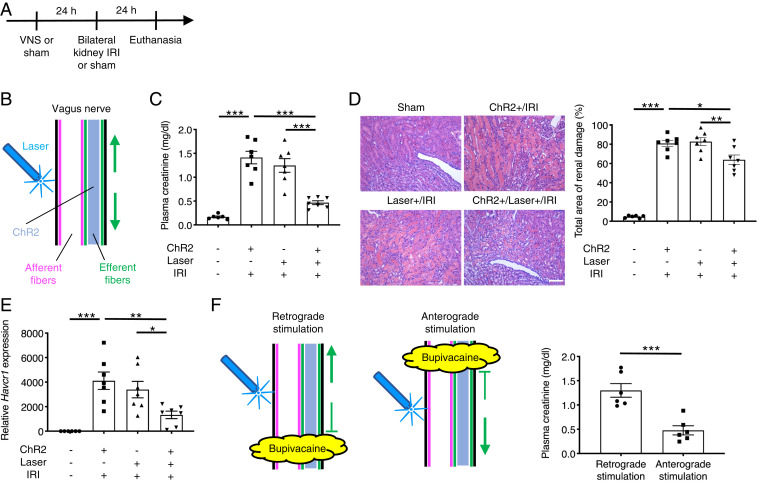
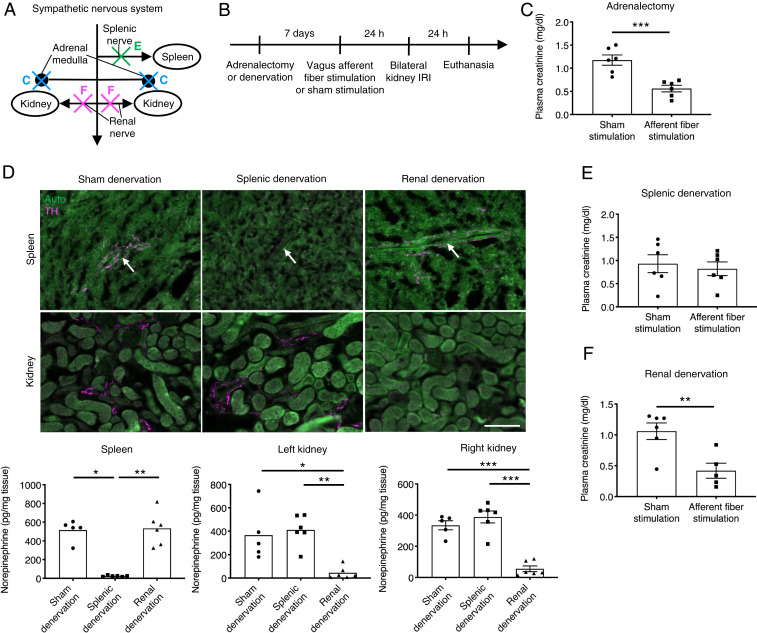
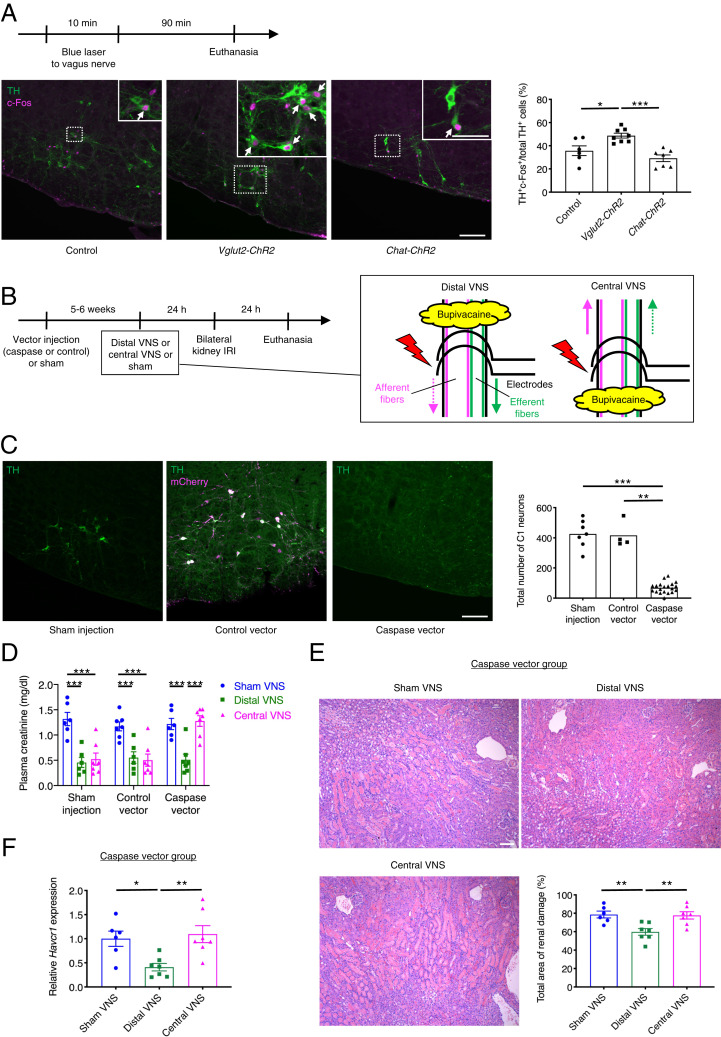
Acute kidney injury is highly prevalent and associated with high morbidity and mortality, and there are no approved drugs for its prevention and treatment. Vagus nerve stimulation (VNS) alleviates inflammatory diseases including kidney disease; however, neural circuits involved in VNS-induced tissue protection remain poorly understood. The vagus nerve, a heterogeneous group of neural fibers, innervates numerous organs. VNS broadly stimulates these fibers without specificity. We used optogenetics to selectively stimulate vagus efferent or afferent fibers. Anterograde efferent fiber stimulation or anterograde (centripetal) sensory afferent fiber stimulation both conferred kidney protection from ischemia-reperfusion injury. We identified the C1 neurons-sympathetic nervous system-splenic nerve-spleen-kidney axis as the downstream pathway of vagus afferent fiber stimulation. Our study provides a map of the neural circuits important for kidney protection induced by VNS, which is critical for the safe and effective clinical application of VNS for protection from acute kidney injury.

Keywords: acute kidney injury; neuroimmune interactions; sympathetic nervous system; vagus nerve stimulation.


Conflict of interest statement

The authors declare no competing interest.

Figures

Fig. 1.
Fig. 1.
Optogenetic stimulation of vagus efferent fibers in an anterograde direction protects kidneys against IRI. (A) Timeline of experiments. (B) Illustration depicting optogenetic stimulation of cervical vagus nerve in Chat-ChR2 mice. Note that action potentials elicited in response to optogenetic stimulation are transmitted only in efferent fibers in both anterograde (downward arrow; toward the periphery) and retrograde (upward arrow; toward the brain) directions. Blue shading, fibers that express ChR2 and that can be activated by blue laser. (CE) Effect of selective efferent fiber stimulation (5 Hz, 10 min) on plasma creatinine (a representative marker for kidney function) (C), acute tubular necrosis score (% of total surface area of the kidney section occupied by tubule injury) with representative hematoxylin and eosin (H&E) staining in outer medulla of kidney sections (D), and renal Havcr1 (Kim-1, a representative marker for tubular injury) mRNA (E) in Chat-ChR2 and control mice. (F) Effect of optogenetic retrograde versus anterograde efferent vagus nerve fiber stimulation (5 Hz, 10 min) on plasma creatinine in Chat-ChR2 mice with illustration depicting the strategy. Blue laser was applied to the central (for retrograde stimulation) or distal (for anterograde stimulation) side of the area anesthetized with bupivacaine. n = 6 in sham IRI group and n = 7 in IRI groups (CE); n = 6 in each group in bupivacaine experiments (F). Scale bar, 100 μm. Data are represented as mean ± SEM; *P < 0.05, **P < 0.01, and ***P < 0.001 by one-way ANOVA with post hoc Tukey test (CE) or unpaired two-sided Student’s t test (F).
Fig. 2.
Fig. 2.
Optogenetic stimulation of vagus afferent fibers in an anterograde direction protects kidneys against IRI. (A) Timeline of experiments. (B) Illustration depicting optogenetic stimulation of cervical vagus nerve in Vglut2-ChR2 mice. Note that action potentials elicited in response to optogenetic stimulation are transmitted only in afferent fibers in both anterograde (upward arrow; toward the brain) and retrograde (downward arrow; toward the periphery) directions. Blue shading, fibers that express ChR2 and that can be activated by blue laser. (CE) Effect of selective afferent fiber stimulation (5 Hz, 10 min) on plasma creatinine (C), acute tubular necrosis score (% of total surface area of the kidney section occupied by tubule injury) with representative H&E staining in outer medulla of kidney sections (D), and renal Havcr1 mRNA (E) in Vglut2-ChR2 and control mice. (F) Effect of optogenetic retrograde versus anterograde afferent vagus nerve fiber stimulation (5 Hz, 10 min) on plasma creatinine in Vglut2-ChR2 mice with illustration depicting the strategy. Blue laser was applied to the distal (for retrograde stimulation) or central (for anterograde stimulation) side of the area anesthetized with bupivacaine. n = 6 in sham IRI group and n = 7 in IRI groups (CE); n = 6 in each group in bupivacaine experiments (F). Scale bar, 100 μm. Data are represented as mean ± SEM; *P < 0.05, **P < 0.01, and ***P < 0.001 by one-way ANOVA with post hoc Tukey test (CE) or unpaired two-sided Student’s t test (F).
Fig. 3.
Fig. 3.
A critical role of splenocytes in the protective effect of vagus efferent and afferent fiber stimulation against kidney IRI. (A) Timeline of experiments for B and C. (B and C) Plasma creatinine 24 h after bilateral kidney IRI. Mice underwent optogenetic vagus efferent fiber stimulation (Chat-ChR2 mice, B), afferent fiber stimulation (Vglut2-ChR2 mice, C), or sham stimulation (same trains of laser light delivered to Cre-negative littermates, B and C) 7 d after splenectomy. (D) Timeline of experiments for E and F. (E and F) Plasma creatinine 24 h after bilateral kidney IRI. Donor mice underwent optogenetic vagus efferent fiber stimulation (Chat-ChR2 mice, E), afferent fiber stimulation (Vglut2-ChR2 mice, F), or sham stimulation (same trains of laser light delivered to Cre-negative littermates, E and F), and 24 h later, splenocytes were isolated from the donor mice and were injected i.v. (1 × 10⁶ cells/recipient mouse) into naïve recipient wild-type mice. The recipient mice were subjected to kidney IRI 24 h after splenocyte transfer. n = 6 in each group (B, C, E, F) except for the efferent fiber stimulation group in the splenectomy experiment (n = 5, B). Data are represented as mean ± SEM; **P < 0.01 and ***P < 0.001 by unpaired two-sided Student’s t test (B, C, E, F).
Fig. 4.
Fig. 4.
Sympathetic nervous system plays a predominant role in kidney protection by vagus afferent fiber stimulation. (A) Plasma corticosterone levels immediately after vagus afferent fiber stimulation or sham stimulation (by setting the laser output to zero) for 10 min in Vglut2-ChR2 mice with illustration depicting optogenetic anterograde versus retrograde VNS. Bupivacaine was directly applied to the left cervical vagus nerve to block nerve conduction, and blue laser was applied to the central or distal side of the anesthetized area for anterograde or retrograde stimulation, respectively. (B) Timeline of experiments (CE) for investigating which pathway among HPA axis, sympathetic nervous system (SNS), and efferent vagus nerve (VN) mediates the protective effect of vagus afferent fiber stimulation against kidney IRI. (CE) Plasma creatinine 24 h after bilateral kidney IRI. Mice were given mifepristone (corticosterone receptor antagonist, C) or hexamethonium (ganglionic blocker, E) or underwent subdiaphragmatic vagotomy (D) before optogenetic vagus afferent fiber stimulation (Vglut2-ChR2 mice) or sham stimulation (same trains of laser light delivered to Cre-negative littermates). n = 4 in each group (A), and n = 6 in each group (CE). Data are represented as mean ± SEM. When no error bar is shown, this is because the data were not normally distributed, and a nonparametric test was used. *P < 0.05, **P < 0.01, and ***P < 0.001 by one-way ANOVA with post hoc Tukey test (A), unpaired two-sided Student’s t test (C and E), or two-sided Mann–Whitney test (D). CNS, central nervous system.
Fig. 5.
Fig. 5.
Splenic nerve mediates the protective effect of vagus afferent fiber stimulation against kidney IRI. (A) Illustration depicting ablation studies (CF) in the sympathetic nervous system. Adrenalectomy (C), splenic denervation (E), or renal denervation (F) was performed seven days before optogenetic vagus afferent fiber stimulation (Vglut2-ChR2 mice) or sham stimulation (same trains of laser light delivered to Cre-negative littermates) to investigate components of the sympathetic nervous system that mediate the protective effect of vagus afferent fiber stimulation against kidney IRI. (B) Timeline of experiments for C, E, and F. (C, E, and F) Plasma creatinine 24 h after bilateral kidney IRI in mice with adrenalectomy (C), splenic denervation (E), and renal denervation (F). (D) Efficacy and selectivity of splenic and renal denervation. Mice were euthanized seven days after splenic denervation, renal denervation, or sham denervation (without kidney IRI). Norepinephrine levels (determined by HPLC) in the spleen and kidneys are shown with representative immunofluorescent labeling of spleen/kidney sections for TH (a marker for sympathetic nerves; magenta). White arrows indicate a branch of the splenic artery, with which sympathetic nerves in the spleen run in parallel. Auto, green autofluorescence in spleen/kidney sections. n = 6 in each group (C and E); Sham denervation: n = 5, Splenic denervation: n = 6, Renal denervation: n = 6 (D); Sham stimulation: n = 6, Afferent fiber stimulation: n = 5 (F). (Scale bar, 100 μm.) Data are represented as mean ± SEM. When no error bar is shown, this is because the data were not normally distributed, and a nonparametric test was used. *P < 0.05, **P < 0.01, and ***P < 0.001 by unpaired two-sided Student’s t test (C, E, and F), Kruskal–Wallis with Dunn’s test (D, Spleen and Left kidney), or one-way ANOVA with post hoc Tukey test (D, Right kidney).
Fig. 6.
Fig. 6.
C1 neurons in the lower brainstem mediate the protective effect of vagus afferent fiber stimulation against kidney IRI. (A) Percentage of total C1 neurons (TH+) that are activated (TH+c-Fos+) in Cre-negative littermate controls, Vglut2-ChR2 (for afferent fiber stimulation), and Chat-ChR2 (for efferent fiber stimulation) mice with representative images of TH (green, in cytoplasm) and c-Fos (magenta, in nuclei) immunoreactivity in the (coronal plane, −6.7 mm from bregma). Mice were euthanized 90 min after blue laser application to the left cervical vagus nerve. TH and c-Fos immunoreactivities were assessed in the RVLM, where C1 neurons reside. White arrows indicate activated C1 neurons (TH+c-Fos+). (Scale bars: 100 μm; 50 μm (Inset). (B) Timeline of experiments for CF with illustration depicting distal and central electrical VNS and positioning of electrodes. Caspase 3 vector (AAV2-DIO-taCasp3-TEVp) or control vector (AAV2-DIO-EF1α-mCherry) was microinjected bilaterally to RVLM of Dbh-Cre mice 5 to 6 wk prior to electrical (distal or central) VNS (5 Hz, 10 min) to selectively ablate C1 neurons. Electrodes were positioned at the distal or central side of the area anesthetized with bupivacaine in the left cervical vagus nerve. Solid and dotted arrows indicate action potential transmissions in anterograde and retrograde directions in each type of fibers, respectively. (C) Total number of C1 neurons assessed by TH immunoreactivity in RVLM with representative images of TH (green) and mCherry (magenta) immunoreactivity in the RVLM (coronal plane, −6.7 mm from bregma). Colocalization of TH and mCherry immunoreactivity is shown in white. (Scale bar, 100 μm.) (DF) Plasma creatinine in all groups (D), acute tubular necrosis score (% of total surface area of the kidney section occupied by tubule injury) with representative H&E staining in outer medulla of kidney sections (E) and renal Havcr1 mRNA (F) in the caspase vector group 24 h after bilateral kidney IRI. (Scale bar: 100 μm.) Control: n = 6, Vglut2-ChR2: n = 8, Chat-ChR2: n = 7 (A); Sham injection: n = 7, Control vector: n = 4, Caspase vector: n = 20 (C); n = 6–7 in each group (DF). Data are represented as mean ± SEM. When no error bar is shown, this is because the data were not normally distributed, and a nonparametric test was used. *P < 0.05, **P < 0.01, and ***P < 0.001 by one-way ANOVA with post hoc Tukey test (A, E, and F), Kruskal–Wallis with Dunn’s test (C), or two-way ANOVA with post hoc Tukey test (D).

References

    1. Ronco C., Bellomo R., Kellum J. A., Acute kidney injury. Lancet 394, 1949–1964 (2019). - PubMed
    1. Levey A. S., James M. T., Acute kidney injury. Ann. Intern. Med. 167, ITC66–ITC80 (2017). - PubMed
    1. Chawla L. S., Eggers P. W., Star R. A., Kimmel P. L., Acute kidney injury and chronic kidney disease as interconnected syndromes. N. Engl. J. Med. 371, 58–66 (2014). - PMC - PubMed
    1. Coca S. G., Singanamala S., Parikh C. R., Chronic kidney disease after acute kidney injury: A systematic review and meta-analysis. Kidney Int. 81, 442–448 (2012). - PMC - PubMed
    1. Webster A. C., Nagler E. V., Morton R. L., Masson P., Chronic kidney disease. Lancet 389, 1238–1252 (2017). - PubMed

Publication types

LinkOut - more resources