

Effect of COVID-19 lockdown on hospital admissions and mortality in rural KwaZulu-Natal, South Africa: interrupted time series analysis
- PMID: 33737445
- PMCID: PMC7977076
- DOI: 10.1136/bmjopen-2020-047961
Effect of COVID-19 lockdown on hospital admissions and mortality in rural KwaZulu-Natal, South Africa: interrupted time series analysis
Abstract
Objective: To assess the effect of lockdown during the 2020 COVID-19 pandemic on daily all-cause admissions, and by age and diagnosis subgroups, and the odds of all-cause mortality in a hospital in rural KwaZulu-Natal (KZN).
Design: Observational cohort.
Setting: Referral hospital for 17 primary care clinics in uMkhanyakude District.
Participants: Data collected by the Africa Health Research Institute on all admissions from 1 January to 20 October: 5848 patients contributed to 6173 admissions.
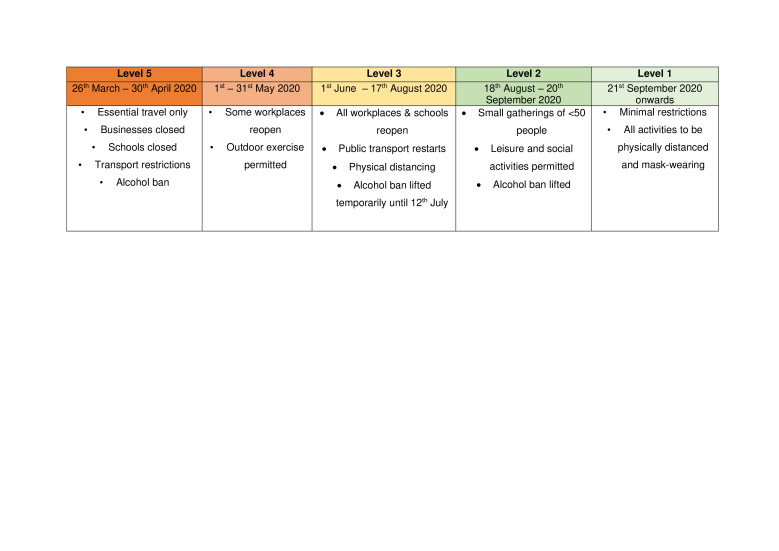
Exposure: Five levels of national lockdown in South Africa from 27 March 2020, with restrictions decreasing from levels 5 to 1, respectively.
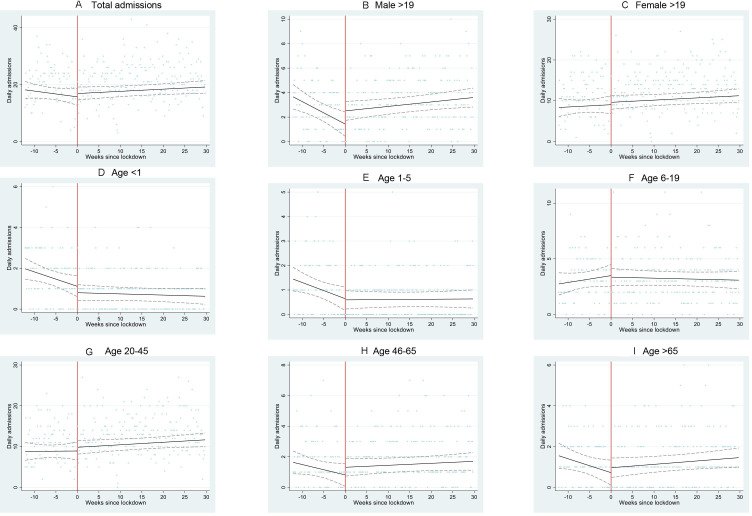
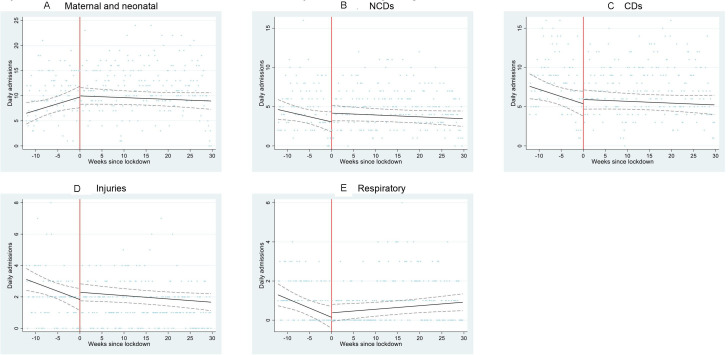
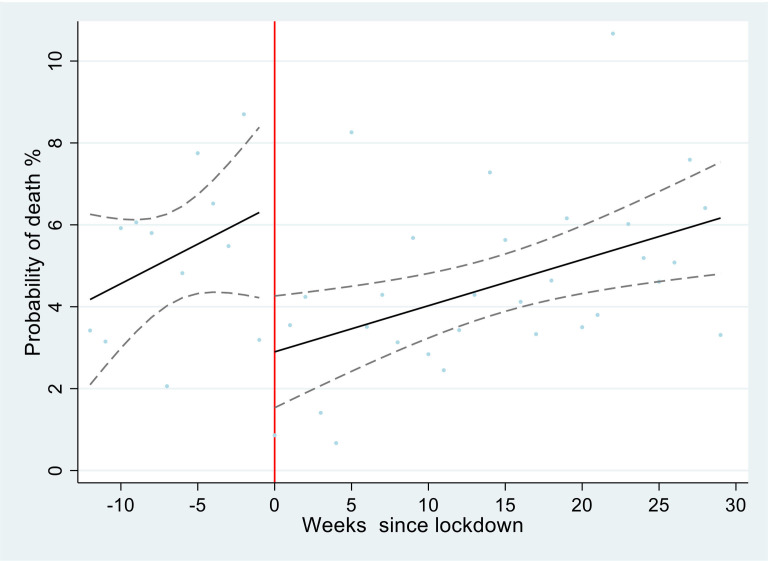
Outcome measures: Changes and trends in daily all-cause admissions and risk of in-hospital mortality before and at each stage of lockdown, estimated by Poisson and logistic interrupted time series regression, with stratification for age, sex and diagnosis.
Results: Daily admissions decreased during level 5 lockdown for infants (incidence rate ratio (IRR) compared with prelockdown 0.63, 95% CI 0.44 to 0.90), children aged 1-5 years old (IRR 0.43, 95% CI 028 to 0.65) and respiratory diagnoses (IRR 0.57, 95% CI 0.36 to 0.90). From level 4 to level 3, total admissions increased (IRR 1.17, 95% CI 1.06 to 1.28), as well as for men >19 years (IRR 1.50, 95% CI 1.17 to 1.92) and respiratory diagnoses (IRR 4.26, 95% CI 2.36 to 7.70). Among patients admitted to hospital, the odds of death decreased during level 5 compared with prelockdown (adjusted OR 0.48, 95% CI 0.28 to 0.83) and then increased in later stages.
Conclusions: Level 5 lockdown is likely to have prevented the most vulnerable population, children under 5 years and those more severely ill from accessing hospital care in rural KZN, as reflected by the drop in admissions and odds of mortality. Subsequent increases in admissions and in odds of death in the hospital could be due to improved and delayed access to hospital as restrictions were eased.
Keywords: COVID-19; epidemiology; paediatrics; public health.
© Author(s) (or their employer(s)) 2021. Re-use permitted under CC BY. Published by BMJ.
Conflict of interest statement
Competing interests: None declared.
Figures
References
-
- Kinross P, Suetens C, Gomes Dias J, et al. Rapidly increasing cumulative incidence of coronavirus disease (COVID-19) in the European Union/European economic area and the United Kingdom, 1 January to 15 March 2020. Euro Surveill 2020;25:2000285. 10.2807/1560-7917.ES.2020.25.11.2000285 - DOI - PMC - PubMed
-
- The New York Times . Italy’s health care system groans under coronavirus — a warning to the world. Available: https://www.nytimes.com/2020/03/12/world/europe/12italy-coronavirus-heal... [Accessed 10 Nov 2020].
-
- Dunn P, Allen L, Cameron G. COVID-19 policy tracker. The health foundation, 2020. Available: https://www.health.org.uk/news-and-comment/charts-and-infographics/covid... [Accessed 10 Nov 2020].
-
- World Health Organization . Statement on the third meeting of the International health regulations (2005) emergency Committee regarding the outbreak of coronavirus disease (COVID-19). 1 May 2020, 2020. Available: https://www.who.int/news/item/01-05-2020-statement-on-the-third-meeting-... [Accessed 28 Oct 2020].
-
- Haffajee F. Post-covid economy resembles a post-war landscape as joblessness climbs to highest ever, 2020. Available: https://www.dailymaverick.co.za/article/2020-09-30-post-covid-economy-re... [Accessed 10 Nov 2020].
Publication types
MeSH terms
Grants and funding
LinkOut - more resources
Full Text Sources
Other Literature Sources
Medical